The World’s Most Important Civic Science Library
TRUTH: The World at our Hands Civics Library explains Civics in 130 Case Studies and evidence-based STEM science Transition Economics (TE), to understand why national policy (decisions) are:
#1 Important to Human Advance
#2 Neutral or Unimportant
#3 Harmful, Expensive, or Dangerous

Index
“In a time of universal deceit, telling the truth is a revolutionary act”
George Orwell
CSQ’s WAOH, MEMS A.I., APIs, and ETFs “Feed the Right Wolf” – by teaching evidence-based Civic Science that advances social, economic, and investment policy responsibly and reliably. Micro and Macroeconomics is Wealth Theory; Indoctrination instead of Education in our Schools.
Country builders, universities, and finance industry governors can use Civic Science to easily unlock the full power of STEM data science to recover the average $4.3 billion lost daily in every economy today


Public Library

The World at Our Hands Report (WAOH) is a Public Library (Symbol: OTWA) and the knowledgebase, Standard of Research, and reporting arm of Fact-tank CSQ Research and their Civic Science Faculty’s Scientific Societies Programme – SSP
WAOH’s Value: WAOH explains the importance of every civic measure – with data science support.
Is a GDP Report important? No. Unemployment? Stock Market Performance? CPI? These are deceptive reports
CSQ Research: Also curates the MEMS Double Your Economy Challenge, Civic Scientist Certifications, and Scientific Journal Civic Science Magazine
The Rules
The Rules: No theories, opinions, peer-reviewed obfuscations in math and modeling, harmful ideologies, or indoctrinations are permitted in the library.
- 220 nations maintain Constitutions, books of law, human rights, and policies that create a measurable national performance report
- These measured statistics are ranked and scored using Civic Science Transition Economics – from reports of 28 nations (the minimum survey size) to 150+ nations (preferred)
- “Favoured” reports use “normalized” data – where stats are presented per %GDP (Percent of Gross Domestic Product), per Capita, and per PPP (Purchasing Power Parity)
- Less Favoured – are $US or LCD (Local Currency) reports which favour countries with higher currency valuations, costs of living, etc.
- All context assertions must withstand credible challenges presented by the community of evidence-based researchers
- We don’t “throw out the baby with the bathwater” – WAOH presents all worldwide statistics both today’s and historic. While we aspire to 100% accuracy, there will be mistakes. So, when accuracy problems are found, we log and fix our automation problem, and then we also revise any context misstatements as needed. Revisions to WAOH’s categorizations and causality assignments were routine in the early days of the library, but are the exception today because sufficient information (context) confirms their ranking, causality placement, and importance is validated credibly.
- ALL Countries misreport their embarrassing stats – suicide, overdose, inflation, unemployment, vaccine deaths, divorce, production loss, military spending (for examples, see ShadowStats.com). Canada’s PM Stephen Harper fired his statistics Deputy Minister because he wouldn’t fake stats or reduce record keeping as requested. WAOH assumes that the tactic is ubiquitous in every country, and WAOH currently counts every nation’s reporting inaccuracies as comparable.
- Criminal Legislatures – go so far as to hide statistics of their Crimes Against Humanity Infertility and High Treason Election Fraud Immigration
 STEM Science

Watch the 2011 movie Moneyball to understand how evidence-based Civic STEM Sciences like Transition Economics are a game changer for high transaction systems like economies. WAOH presents 60,000+ reports and 50,000+ indicators and causal aggregates, organized into Methods and Programs by role, by industry, by indicator importance (causality), by report, as follows …
Take me to the Library …
Standard of Research

Like all Civic Science curricula, WAOH’s Research is based on 100% evidence-based science that requires all facts to be documented and confirmed to be “in context” with a historical track record of notable success.
Truth Testing 
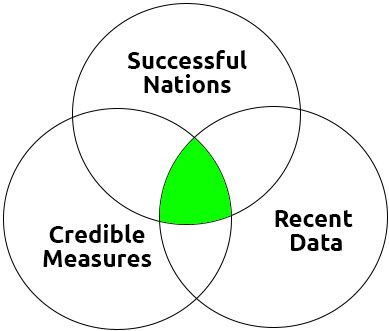
Transition Economics (TE) is the simple evidence-based econometric data science that visualizes and proves the merit, value, and importance of most economic and social measures in the Library. Like TE, WAOH always compares successful nations, and it always qualifies claims of causality with examples and “context”.
Context means that any conclusions presented are considered comprehensively with all facts that relate and add introspection. For example, does the high Infertility in high-income nations today indicate that Infertility is desireable? No, of course Infertility is Unsustainable and therefore an example of collapse. Does “number of years” in school indicate a good education system? When the education system creates measurable national advance, then and only then is it a good system. 90% of large Western Democracies are collapsing today, so 48 of 54 education systems are failing.
 If your faculty is studying TE or thinking of adding it to curricula, please send a note and reach out to ask for help and teaching resources
Researchers, Contributors, and Educators wishing to add research articles to the library, please see About WAOH
See also: Credibility – Credible Measures & Context
Strategic & National Leadership
WAOH is explained by the Civic Science Book of Knowledge (CS-BOK), which was first released in 2021 alongside a case study and book called simply The Book – because our civilization’s Civics textbook has always been called “Ta Biblia” (The Books).
The revelations taken from the scientific evidence-based study of economics are that strategic Nationalism is essential, that monetized Productivity advances any nation reliably, and that there is no separation between economy and society. To suggest that there can be a separation is proven-failed theory entirely.
Leaders are experts who build strong economies by ensuring Good Lives (Social Contract), monetized production, living wages, single-income families, and affordable Cost of Living and homeownership.
Belief-based theories and ideologies are little more than religions: Wealth Theory, Neoliberalism, Libertarian, Marxism, etc., collapse nations reliably. Theory and ideology create collapse that is dangerous, expensive, socially irresponsible, avoidable, and correctable too.
EVERY Problem is Solvable
BASIC Principals
Economies are high-transaction systems
Like a busy casino or pro baseball at-bats, economies that run only policies with a higher probability of success are mathematically certain to Advance
The opposite is true also; nations with weak causal indicator scores, or strong “collapse policy” scores, are guaranteed to Collapse
Every problem is solvable AND important problems MUST BE corrected
Problems go unidentified, actively hidden, and unresolved for decades in our present theory, ideology, and indoctrination-based university civics curricula – collapsing 90% of large Democracies today. This broad collapse MUST STOP because it is expensive, correctable, avoidable, and dangerous
The scientific determination that a nation is in “Collapse” is not intended to be an insult; rather, it identifies an important problem so that it can be corrected; instead of hiding problems and permitting collapse to detract from humanity’s advance across 220 nations worldwide
Civic Science and Leadership is this simple …
TRUTH – Prove our calculations true for yourself
No bias or opinion is permitted in the library. ALL cornerstone explanations and summaries MUST be supported by data and research across 220 countries. This requirement of rigour creates no small research effort BUT it ensures Truth
Contributing researchers quickly find it impossible to forward unsupported opinions here due to pushback from others who can easily validate false assertions based on data
To build any TEP Chart here for yourself, visit our Science of 70% tutorial and start with a basic Excel template. You can also upload a much larger sample pack of spreadsheet examples on the About WAOH page – see Contributions (or click here)
The WAOH Library makes the source data available for every one of the 60,000 charts presented here, allowing you to recreate and validate TEP frequency distribution charts for yourself. We’ve summarized ALL of these calculations here at WAOH, and then also created an enterprise STEM and API Program alongside the most advanced Decision Support Dashboard Console available – MEMS for Government and MEMS for Schools
Directory

 By Causality – Causal, Sustainable, Neutral, and Unsustainable categorize policy and indicators by importance – using quantitative measures, context, and track records of success or collapse
- Data Science – by Rank – Transition Economics ranks 2,000 indicators and 60,000 surveys in TEP Causality Reports (see Science of 70 ), Scatter XY Plots, and Indicator Timelines with Context, Targets, Visualization tools, dashboards, quantitative, and probability sciences. TE uses techniques similar to those used in quality control, casinos, and the SaberMetrics explained in the 2011 movie MoneyBall
- Strategic Central Planning – by Role – Our Aristotelean Right Plan suggests four roles of policy – Social, Government (Public), Business, and Finance
- By Industry – Manufacturing, Real Estate, Imports, Exports, etc.
- Transition Engineering – FIAT-seeded Autonomous Supply Chains that provide for Human Rights and SDG -Sustainable Development Goals
- FDR built the greatest economy in history based on strong social contracts, living wages, regulating opportunistic unproductive business, and correcting inequality. America’s greatest export is FDR’s Second Bill of Rights
- The Bible – is a second update of the Codes/Constitutions of Hammurabi and Ur’Nammu, and a Civics textbook that explains lessons learned in 3,000 years of civic rise and fall. 800 Constitutions are based on the Bible and all nations that follow a full list of its human rights are advancing today. CSQ Research’s CASE Study and thesis “The Book” – updates The Bible for a third time – with evidence-based science validating it in a context for today’s now-literate populations
- Reporting – a study of important and misleading reports. Reports can hide or identify problems that need solving. Reports should explain performance, common lies, scientific proofs, and truth of problems so that they can be corrected
- Indexes – aggregation permits the combining of 50,000+ indicators to act as causal indicators which are optimized to maximize a probability of success. Social Contract, Social Contract Product, and similar thematic indexes use a TE Index approach
- FAQS – Frequently Asked Questions offer search engines featured snippets based on WAOH’s evidence-based scientific Standard of Research
 ITSM Managed Services – Service Catalogs, Service-Level Management, MACs – SLA-Managed Moves/Adds/Changes; Problem, Incident, and Knowledge Management
- Collapse Motivators – are examples of merit and bonuses awarded within our society for our civilization’s collapse: Pharmaceutical Treatments without Cures, HR Policy that creates Genocide, and so on …
- APIs – Available to universities and government organizations, TE APIs make real-time TEP charts easy and quick to display and compare using your own data science developments
- Epistemology – Engineering Best Practices, Expert Systems, Highest Probability of Success approaches, Lessons-Learned, Project/Program/Case/Change Management, LEED, SCRUM, Data Science, Quality Control, Failure Analysis, Data Science Analytics, Artificial Intelligence, Material Science, and Peer Review (in today’s Academia, an unscientific peer-review process has created a systemic mediocracy with near-100% false-positive endorsements of harmful Business, Finance, Law, Economics, Public Health, and Political Studies curricula)
- About WAOH
![]() Join the WAOH online Discord Community here
Join the WAOH online Discord Community here ![]()
Glossary
Civic Science (CS) – is the evidence (data science) based context-validated (truth-telling) science of Civic Leadership (in 220 sovereign nations).
Performance Management, Central Planning, Human Advance, Proven Economic Success – Civic Science uses Performance Management and Central Planning to guarantee human and economic advance in every nation.
What is the Economic Cost of blocking Civic Science today? $200 trillion annually is lost because we block Civic Science in Universities and 90%-collapsing Western democracies.
Civic Science Faculties and Ministries – ensure Leadership governing all Civics faculties: Economics, Business, Finance, Law, Government, Education, and Social Sciences & Services.
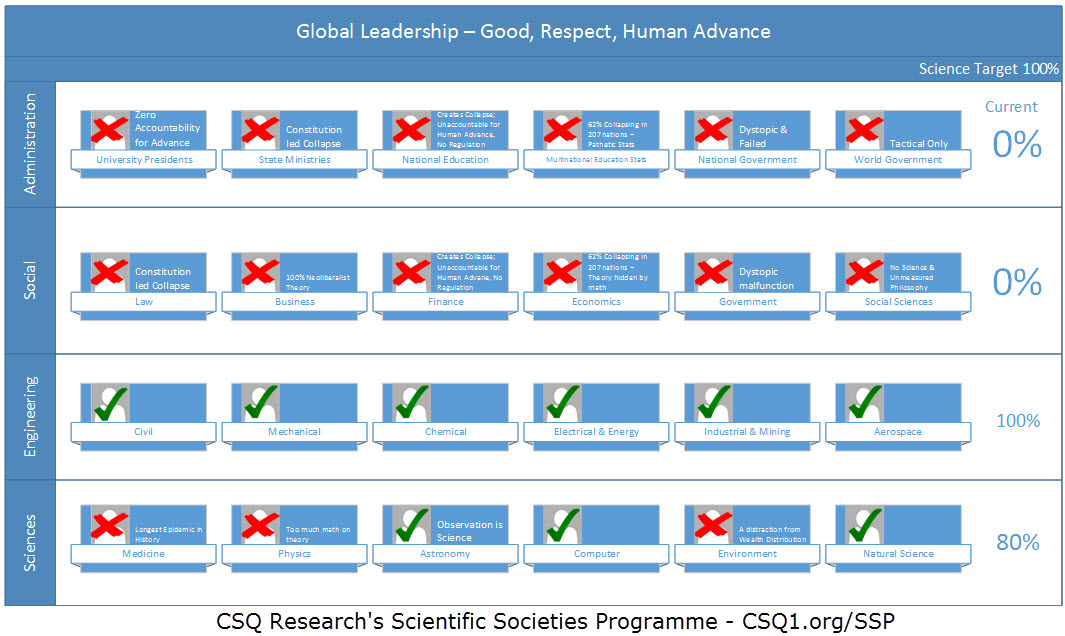
- If there is no Civic Sciences Faculty in your University, we can 100% assure that civics curricula here teach indoctrination, NOT education, and teaches reliable collapse only
- Civic Science Faculties ensure that faculties can NEVER DO HARM TO THE PUBLIC. Today, 75% of faculties harm the public with proven-failed indoctrination and Peer Review. Only Engineering and Medical Faculties (excluding Pharma) promise this leadership …
Civic Science is Leadership – in recent months, CSQ Research has rebranded its literature from “Global Leadership” to “National Leadership” and “Civic Science” in recognition of the need for 220 nations to focus on truthful Civic Science, strategic Nationalism and Export, and to clarify that Civic Science has nothing in common with harmful globalist organizations, criminal legislatures, or harmful ideologies.
- Globalists – Squandered their opportunity to add value, support, and contribution, and became pariahs instead, when they mandated their own decision making, Oligarchy control, and wide collapses through poverty, human rights violations, and economic decline
- The United Nations – was established to ensure that mature capitalism could never create another World War – but it failed at that goal. It no longer even recognizes this goal – at all, so it requires a complete restaffing with proper leadership again
- Human Right Commissions – are a UN-coordinated NGO network of non-profit organizations that DO NOT protect Human Rights. More often, these groups don’t understand Human Rights and protect harmful ideologies only
- Defunding – is important for Global groups that do not offer legitimate Civic Science and best practice assistance
Yes, unfortunately even the United Nations has turned harmful in recent years. They completely forgot their 1948 Goal to ensure that a Mature Capitalism can never happen again – and threaten the entire world with another avoidable World War.
CS’s Book of Knowledge – CS-BOK (and its public portal at WAOH) explains the science, social, and economic performance management of 220 nations here at WAOH, from multiple viewpoints: by role, by industry, by indicator importance (causality), by reporting, and …
Meaningful, unambiguous, and measurable TERMS – are essential to any productive scientific discussion. See Civic Science’s Master List of Terms here and at Transition Economics‘ Home Page
Civic Science discussions will often use the TERMS: Advance, Collapse, Causal, Sustainable, Neutral, Harmful, Unsustainable (some unsustainable policies help to monetize Boom Economies short-term, but they always collapse after a time in any economic season), Aggregates, Indexes, Transition Economics, Evidence-based, Use Cases, Social Contract, Production and Productivity, Prosperity and World Peace.
ISMs are theories, fictions (proven-false theory), and ideologies, so there is none in Civic Science. If you find yourself signed up for a class teaching economic theory and “isms”, you are not paying for an education, rather, you are paying for indoctrination.
Theory is never important or real; and Science is always real, observable, and important.


![]()

![]()
Insights
What new insights are possible with evidence-based science?
1. ONE Constitution creates Advance
 In a Case Study of every Constitution, we found that one Constitution creates advance reliably in any country. Would it surprise you to learn that America introduced the world to it, and yet it’s not the Constitution that this collapsing nation uses today?
Large Democracies have become the worst-run nations in the world, while Monarchies like UAE have a GDP fully one-quarter that of Canada – and even space programs, despite being 1/100th Canada’s size. There is no homelessness in Monarchies, while each has economically outperformed the G7 for 25 years now, with free healthcare, free education, and no income tax.
2. Civic Science is “Old Fashioned”
 Common Sense (Social Benefit in decision-making), common courtesy (good actions and honesty), systemic empathy in law-making, family values, heads of households, and the shepherding of consistent human advance, are found in Civic Science to build the most productive nations in the world today.
In our Case Study of the Bible, Civic Science (CS-BOK) and Transition Economics were able to confirm that “Ta Biblia” (Greek for “the Books”) was not religious, and was scientific because it was based on Civics lessons learned through documented observation over centuries and millennia.
This study permitted CSQ Research’s founder Edward Tilley, to validate and then update the Bible for the first time in 1,700 years; for today’s literate and educated populations and audience.
The Bible predates today’s religions. Religions teach civics so they used it, but they abused it too, which is why it’s still not explained for what it is still today: The Bible and its lessons: are proven Constitutions (the Codes of Hammurabi and Ur’ Nammu), Bill of Rights, and Books of Law, with a track record of success proven across 3,000 years of civil rise and fall. This is the reason that harmful ideologies call the Bible old-fashioned and out of date, while their new and progressive moralities and values are what’s really important instead.
A 1% literacy rate at the time of the Bible’s last update, mandated its storytelling format, but the Bible’s teaching tools of a Father, Son, and Holy Spirit, explain very well a trinity of personal values and behaviors, that build successful societies reliably
Good Values are:
- Good – Systemic Empathy in decisions, actions, and in laws – Good Thoughts, Good Words, Good Deeds
- Respect – the Golden Rule’s respect for family values, neighbours, disabled, sick, elderly, employees, employers, travelers, and foreigners
- Human Advance – Productivity, building and improving each generation. Leadership, shepherding, and good stewardship
Ideologies: are utopic ideas about how a society should operate, and most 99.9% are harmful – “False Idols”. All harmful ideologies claim to be modern, ethical, moral, respectful, scientific, real, etc., but none are; and, all insist that we must ignore the Bible – because it warns against these harmful and unsustainable ideas at great length. In your own life, you will never want to “worship” harmful ideologies like NAZIism, Right and Left Divisionism, Neoliberalism (Wealth theory), Gender Theory, Rugged Individualism / Libertarianism (cold indifference to our neighbors), Marxism, Feminism, and similar. See “Ideologies” below
Indoctrination: is the teaching of harmful ideologies in our media, social media, schools, and universities. Indoctrination is ubiquitous today as 90% of large democracies have fallen into the same traps we did in the 1920s, which lead to the Great Depression.
The Bible endorsed only an ideology of Family Values and warned us that “The Beast“, the devil, etc. (merchant-class economic powers – also called Oligarchy) use tactical wealth and political manipulations to forget essential good values and drive nations to collapse consistently, throughout our long history of documented civilization.
When we allow Oligarchies to lead without regulation (laisse-faire, trickle-down, cheap labour, starvation wages, immigration/open borders, etc.) in times of imbalance like mature capitalisms, every country loses their productivity – often unreported and hidden, despite often forfeiting 50% to 100% of their economy.
3. Education Reforms are Needed Urgently
 Education Reform: Findings in this Case Study were Shocking.
60% of males in North America drop out; 75% of university degree graduates don’t learn science (citation); and, our boardrooms and investment committees are filled (90%) with mis-educated graduates and experts of indoctrination entirely.
Today is a time of imbalance, a time when proven change and rebalancing are essential. The greatest example of a successful economic turnaround in history was built by FDR in the 1940s, but that example is completely ignored in universities. Instead, we teach theories and policies that created the Great Depression in the 1920s.
Education is indoctrination and university curricula teach “fiction”, whenever lessons are composed entirely of proven-failed theory and ideologies that cannot be verified-successful by evidence-based observation. Aristotle’s Scientific Method states clearly that Theory is fiction until it can be proven true by observation – by anyone anywhere repeatably.
Not only do our colleges and universities teach fiction to students as real, but universities actively block civic science as well.
Science is Truth and Reality. Science matters; Theory does not
Micro and Macroeconomics, Wealth Theory, Marxism, Political “Science”, and similar teachings are theory-based AND have proven false for a century now (Friedman, Marx, Hayek, Keynes). Civic Science does not collapse societies and economies, so these curricula are “fictions” taught to our children as truth. Indoctrination, rather than education.
We found: egregious performance, national infanticides, crimes against humanity, anti-family-values, anti-male, anti-expert, anti-merit, and anti-leadership bias across almost all large democracies. 60% of males (and 40% of females) in North America drop out of 4-year bachelor programs that admit 60% females as well. University Programs were too long, taught unreliable tactical civic collapse, contained little or no evidence-based science, and taught belief-based ideology exclusively via theorist mathematicians who were unqualified to teach evidence-based STEM sciences
Solution: Deprecate fiction and insist on Science
A scientific approach and proof of success are mandated by evidence-based Civic Science curricula (see also TASK). TE, for example, deprecates Wealth-theory (Micro/Macroeconomics’ Supply, Demand, Cost, Profit, Labor, GDP, Stock Market Performance, Sales Economies, U-3 Unemployment, and Finance Accounting) because they teach reliable social collapse, as do the reports that we rely on to decide who to vote for – and what to invest in. These teachings ignore and hide collapse altogether – as if it does not and can not exist; while in reality collapse is expensive, predictable, preventable, and correctable too.
Can you remember when Businesses used to create the greatest economies and societies in history? It was only 70 years ago, yet today our universities teach tactical collapse entirely. We are completely ignoring the strategic advance curricula taught to students in the 1940s and 1950s that created the Greatest Economies in History.
Missing Discussions
What did we miss here? Suggest new Topics (new ways of looking at our societies), new data, Research – and discussion revisions here
WAOH grew at the rate of 2 updates and new reports per day in 2023. As important new data is located, we add it to the library – and that often means we have evaluated and “posted and dismissed” five or six unimportant measures too
At WAOH, Theory equals Fiction until proven Science (Truth and Reality) transparently and repeatably – in 100 countries and more.
Missing images?
Refresh your browser. There are hundreds of images being downloaded on many of WAOH’s web pages; this first page alone holds 400 charts with 1,000 links to 6,000 additional charts


 For Governments
Finance
and Schools
MEMS A.I. & Machine Learning
 TRUTH about Policy based on evidence-based Performance

WAOH contributes curriculum to the emerging scientific field of Civic Science and evidence-based Country Building, by curating 2,000 indicators, indexes, and 80,000 reports for 220 countries over 200+ years, ranked by causality with context validations by expert systems and best-practice epistemology (Survey, TE Data Science, Project & Case Management, Socratic Method, Scientific Method, quantified multi-approach validation, etc.)
WAOH Library tools are simple and explain How-to Questions & Answers that build an advancing society – and a sustainable World Peace too. Professional and Academic groups have access to much more sophisticated planning tools in MEMS AI and APIs, which provide a comprehensive solution of Data Science Analytics, change management, performance monitoring, index creation, and interactive dashboard reporting tools – designed to recover the $4.3 billion lost daily to every economy today
Observation by Method and Program
WAOH presents 11 Methods and 5 Programmes that look at our world from different points of view – by role, by industry, by importance, by successes, and so on. Begin by selecting the tab that corresponds with each “Method” here – and “Programs” are accessible from the “Learning” menu tabs above …

Methods Overview
Method 2: Go To Data Science

![]()
Method 4: Go To – By Industry

3: Go To Aristotle’s Right Plans
The Four Pillars of a Right Plan
The Right Plan is the one whose ends, means, practical thinking and purposeful action result in a Good Life. A life full of things you need – and not necessarily a life full of everything you want. With a little luck, goods in body and soul, and by making a habit of good choices that reflect moral virtues of temperance, courage, and justice, a Good Life should be sought and found
Abridged from Politic 322 BCE (Messerly, 2013)
5: Go To SDGs
Method 6: Go To FDR’s Proven Turn-around
In the 1930s, American President Franklin Delano Roosevelt (FDR) worked against Congress and Senate obstruction to ensure tens of millions of starving Americans had the basics of life.
FDR’s Second Bill of Rights policies were taken straight from the Bible (the Codes of Hammurabi and Ur-Nammu) and laid the foundation for the American Dream’s strong Social Contract that built the greatest economy in history
Science is measurable, repeatable Observation!
Method 7: Go to The Bible
The Book – The Scientific Update of the Bible
The first five books of the Bible are the third update of Hammurabi and Ur-Nammu’s Code and Constitution; it’s not a book about religion. The Bible was created to explain civics: basic instructions on how to build good lives and strong communities. The Bible was scientific too because it based its lessons on best practices learned over two-thousands years of observing civic rise and fall


Method 8: Go To Reports
Political Opportunism – Hidden, Misleading, and Essential Reports
The first step in solving any problem is to see that a problem exists. When Constitutions permit politicians groups to build dysfunctional democracies, they will invariably prefer reporting that is always positive, irrelevant, and designed to appease sponsors
Method 9: Go To Collapse Motivators
What are Collapse Motivators?
Collapse Motivators are a Method of Civic Science academics introduced by the Civic Science Book of Knowledge. Collapse Motivators document processes that work against the success of civilization and humanity
Method 10: Go To Aggregates – Indexed Indicators
Transition Economics permits Proofs (TEP Charts) using indices – measures created by combining multiple individual indicators, similar to the S&P 500 Index
Go To About – The WAOH World at Our Hands Report
 n the Beginning …
Method 1: TE’s Policy Library – by Causality
Transition Economics‘ Proofs and Method support the following categorization of Policies
World at Our Hands |
|||
| CAUSAL | SUSTAINABLE | NEUTRAL | UNSUSTAINABLE |
Missing images? Click Refresh …
To view just one column at a time – and not 4 columns side-by-side, reduce the width of your browser or increase text size
Causal |
Transition Economics
No opinion is permitted in the WAOH library; all qualitative claims must have a quantitative validation in data. To accomplish this, WAOH makes extensive use of Transition Economics (TE)
TE is a simple evidence-based Civic Science that leverages probability to counter collapse and to guarantee advance in any high-transaction economy
WAOH uses Transition Economics to confirm policies that are:
- Essential to National Success (Causal)
- Important (Sustainable)
- Having little influence on an economy (Neutral)
- Harmful (Unsustainable)
TE is a computational STEM data science that measures performance, fact, truth, and reality transparently, unlike the economics curricula taught in Western Universities today
Universities teach theory-based logic and math that is amenable to sponsors while it actively blocks Civic Sciences like TE
Transition Economics’ homepage is here
Visit Transition Economics at Discord 
The Science of 70%
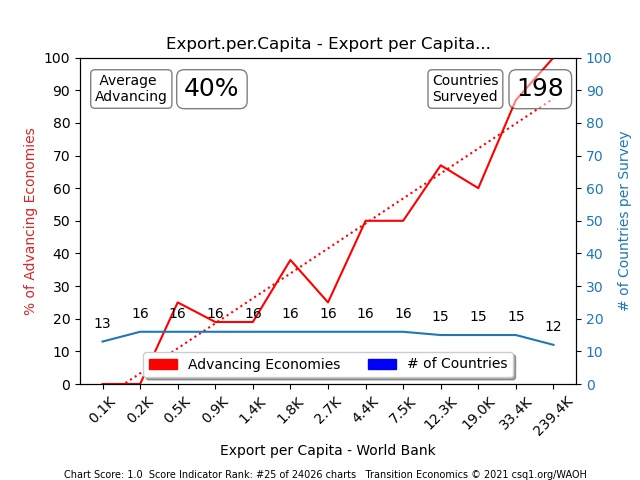
Transition Economics‘ Thresholds, Proof Charts, Scores, and Rankings are created using this 70/30 Rule

The Tilley Principal ![]() or The 70/30 Rule
or The 70/30 Rule ![]() explains the frequency distribution-based data mining approach used to determine causality, importance, and benefit in large national indicator data-sets
explains the frequency distribution-based data mining approach used to determine causality, importance, and benefit in large national indicator data-sets
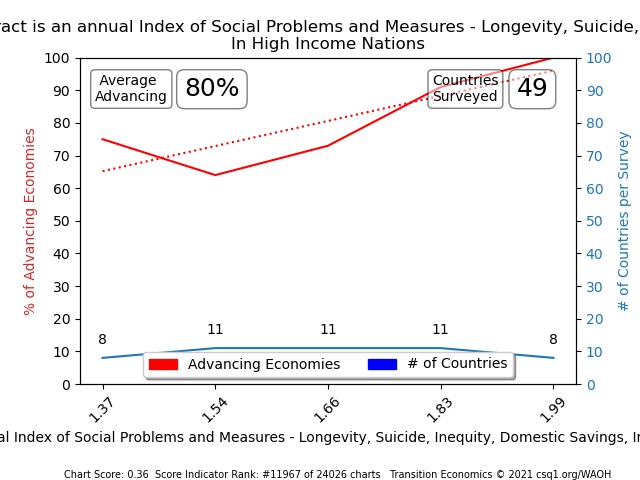
TEP Chart Linear Distribution (dotted lines), Average Advancing summaries, etc. are created with thresholds explained in Transition Economics’ 70/30 Rule
Science of 70%
TE Threshold Analytics (TA)
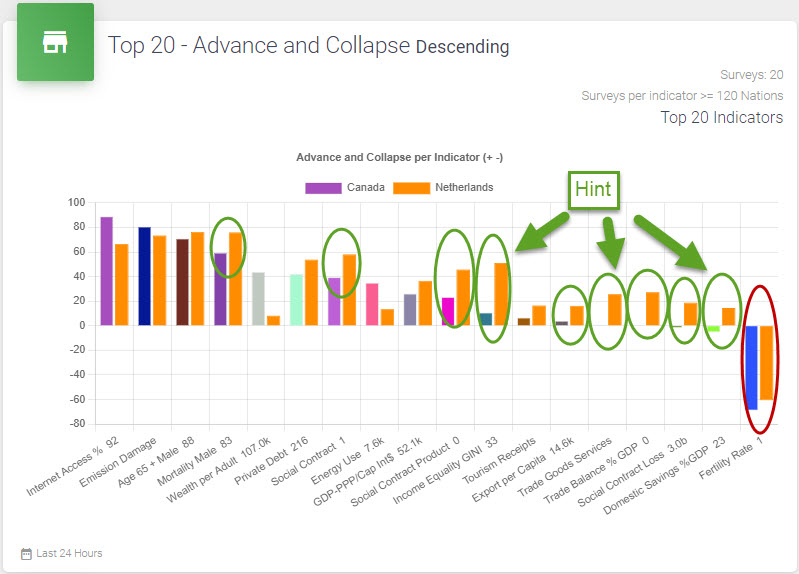
TA Top 20
Threshold Analytics compares the most causal measures of every country against those of the highest-performing economies in the world
Threshold Analytics
Viewpoints and Category Panels

Think of WAOH’s viewpoints as different approaches to looking at the world we live in
WAOH looks at every nation By Industry, by Actor (Citizen, Government, Academia), by Role, by Indicator, by Causality, and our list of categories and viewpoints grows with time and experience
WAOH is the static online version of the Civic Science Book of Knowledge and MEMS is the far more interactive data science dashboard that we use to ensure performance managed Advance in every nation – from every point of view
CS-BOK & MEMS

MEMS uses panels, maps, charts, and tables to view the many parts of an economy and society. Panels permit side-by-side comparisons of measures with varying causality (importance to economic advance or collapse)
Buttons in WAOH are more static but they present evidence-based civic and data science from every possible angle similarly
COMING SOON! We are hoping to integrate Oxford’s excellent World in Data charting tools into Buttons within the coming several weeks
Our 3D image of Auguste Rodan’s famous statue “The Thinker” is shown above considering every possible viewpoint of each society on earth. “The Thinker” is located at the Musee Rodin in Paris France
WAOH Viewpoints
TEP Sheet Indicators
Social Contract *
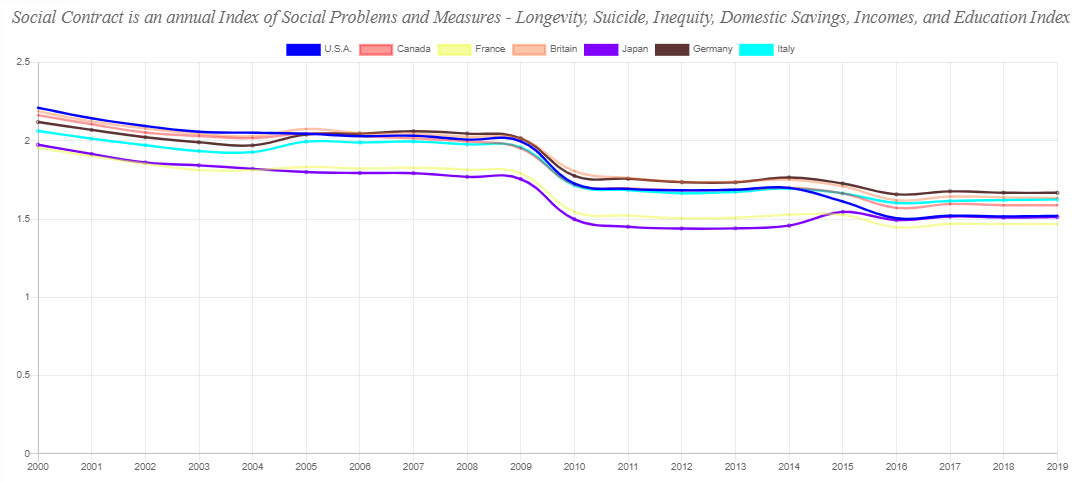
Social Contract (SC) is a causal index indicator (an important indicator composed of multiple individual indicators – like the S&P 100. SC measures the status of any nation’s society
Find a full explanation of Social Contract at https://csq1.org/SCP
At CSQ Research, we assign a Machine Learning MEMS application to search for the most meaningful combination of social indicators for the Social Contract Index
Social Contract Discord
SCP * Social Contract Product
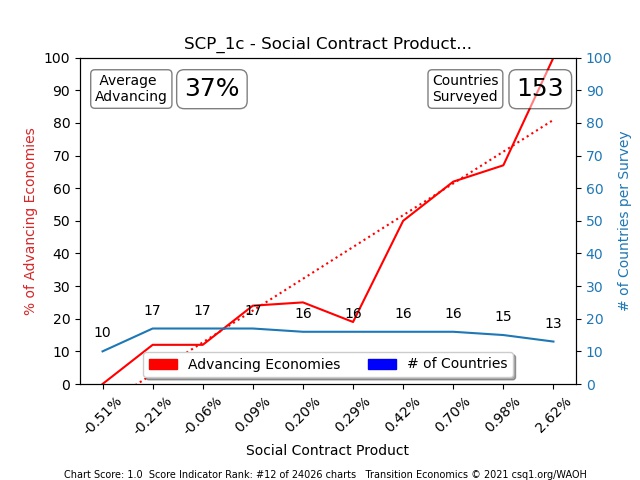
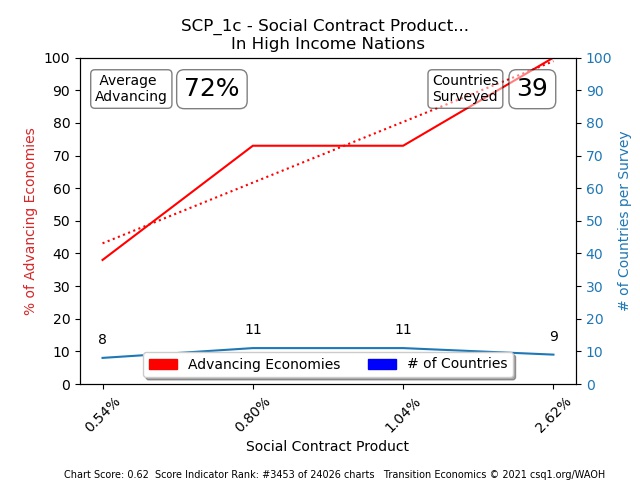
Social Contract Product is a causal index that combines Social Sontract with Economic Indicators to determine economic and social status together. In Transition Economics, social measures (longevity, infant mortality, education) are just as important and often more important to economic advance than many economic measures (trade, GDP, spending, savings)
A #1 ranked SCP Report is the far more important measure than a #2000-ranked GDP Report
Find a full description of SCP at https://csq1.org/SCP
A Machine Learning MEMS algorithm searches constantly to find the most meaningful combination of social and economic measures for the SCP Index
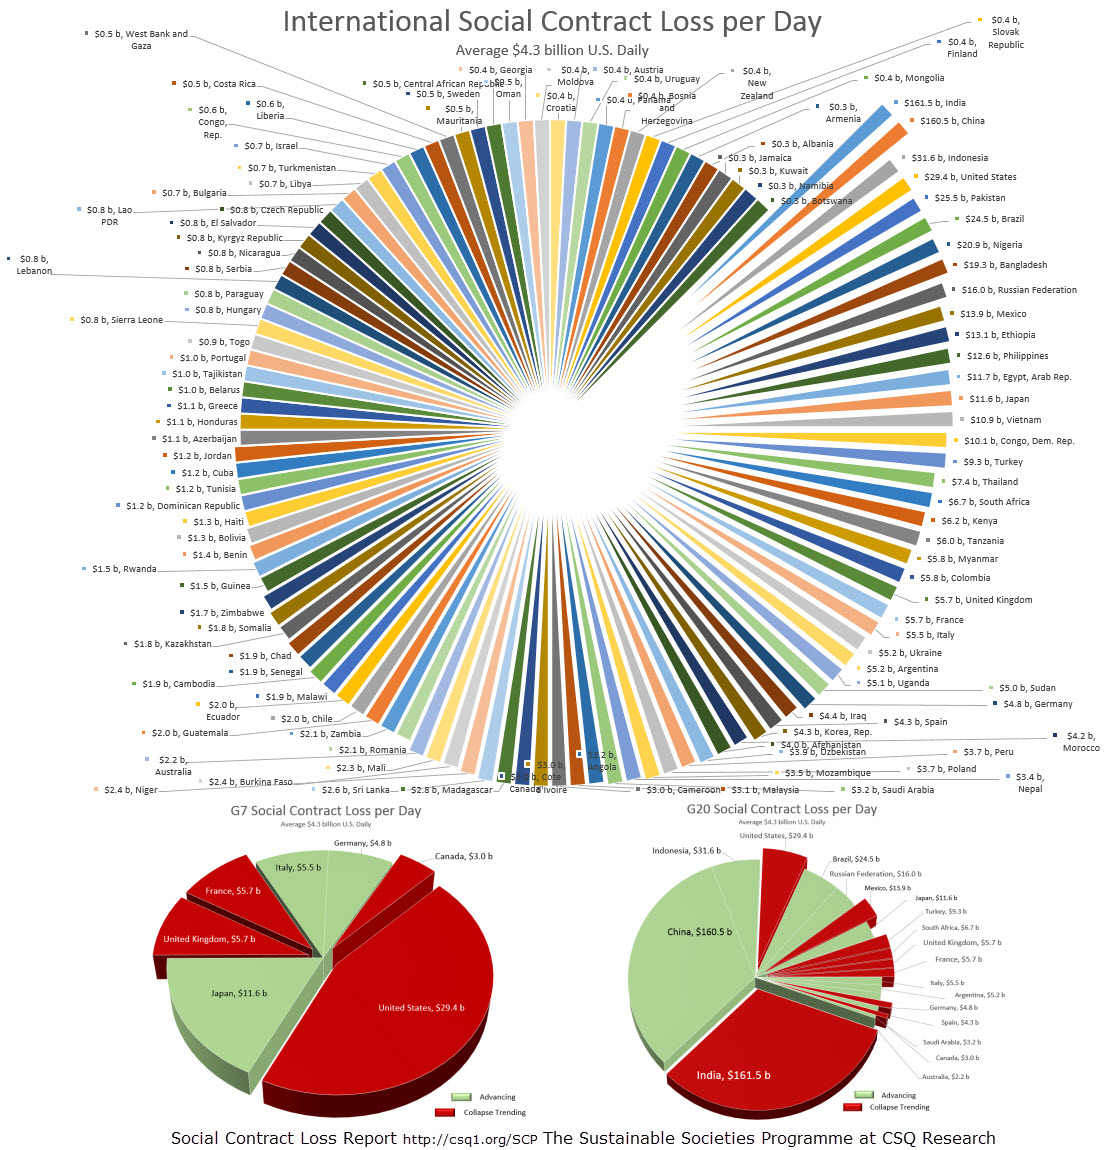
SCL * Social Contract Loss
Social Contract Loss measures the revenues lost in every nation, compared to the incomes per capita of the highest-performing economies in the world
The average Social Contract Loss for every nation is $4.3 billion US per day today
$200 trillion
Is lost annually…
SCL is managed extensively in the
MEMS Double Your Economy Challenge
Join the Challenge!
Social Contract Loss
Trade *
Trade Surplus nations are considered Advancing and Trade Deficit nations are considered Collapsing for this indicator, because $0 (in trade) is the threshold used most commonly


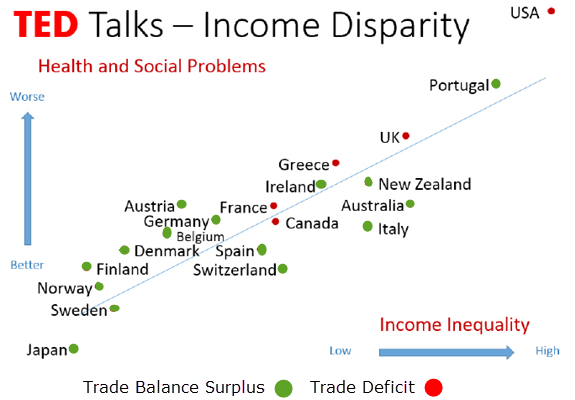
Trade Surplus is higher in high Social Contract Nations
Trade Surplus

TE Trial Indicators
GDP PPP per Capita **

GDP PPP per Capita and GDP per Capita are two of the most important and causal measures for success in any nation

See: WAOH Data Science, austerity, poverty
TE Trials are added to TE Sheets for an indefinite period. TE Thresholds find the highest probability of success indicators in the dataset and so Threshold Charts are usually the best source for finding new trial indicator suggestions
Other Trial Indicators include:
Bank Swiss Mean Wealth, Income per capita, Lowest 40% incomes, GINI Income and Wealth ***
TE Trial Indicators
Legend:
* Causal Measures of Advancing Economy
** Probationary Measures
*** Possibly Causal – needs more data input & adoption
Causal Policy
Abundance and Prosperity
versus
Poverty , Scarcity , and Austerity
See also: Competent Government
Law
Criminal Legislatures
Strategic Central Planning
Right Plans
Right Planning
Poverty
GDP per Capita
Poverty, and the Neoliberalist collapse policies mandating Scarcity and Austerity, are both indoctrinations and Poor Leadership
While Strategic Planning could build abundance in any scientific Civics or Engineering classroom, Austerity Curricula in Western classrooms explain that poverty and scarcity are essential. This lie is pure harmful ideology, indoctrination, and the opposite of education
Any large FIAT nation can easily finance revenue-generating export through Oil and Gas Refineries, LNG (Natural Gas), Nuclear Plants, Copper, Tin, or Titanium mines, to create production and profits that easily afford and offset all costs of government services AND basic human rights and needs as well
The Golden Rule
The Golden Rule is as much sound economics as it is Common Sense
“Be good to each other, export more than import, and be 100% self-sufficient – as a fall-back position fit for any global panic”

Citation: The Proof – that Wealth Theory’s need for Scarcity collapses any nation
Proof that Austerity is Misleadership
Scarcity is a Theory-based approach explained in Wealth Theory – Micro/Macroeconomics, Neoliberalism, Conservatism, Libertarianism, etc. – and in Western Universities where 90% of large democracies are collapsing today
A simple method to prove that this Scarcity Theory is false is to observe productivity growth during boom economies versus production growth in mature capitalism’s Great Depressions – as we saw in the 1930s and as we see today.
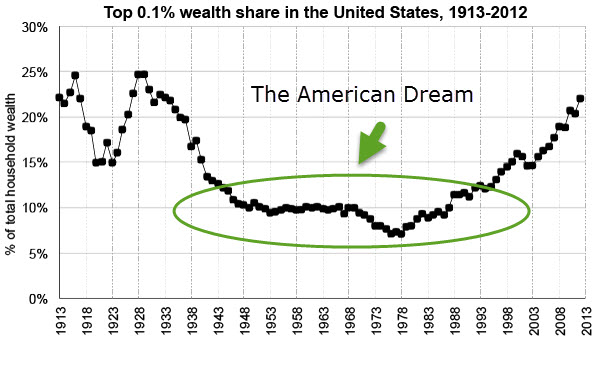
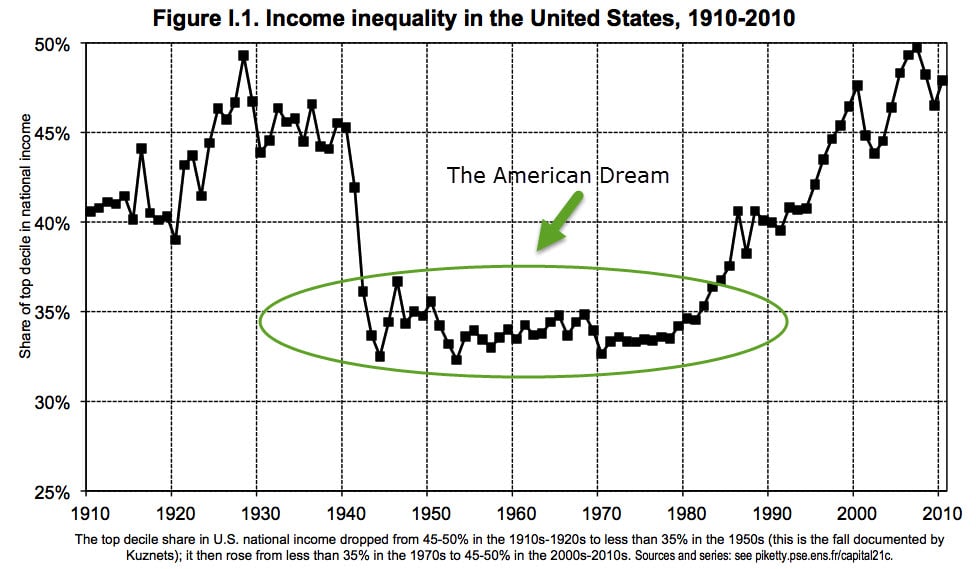
Observe the mirrored (equal and opposite) change in Production Growth during times of high financial inequality (today and in 1930), versus the corrected financial inequality of the period between 1940 and 1980. America built the greatest economy in history during its most recent era of financial equality

Great Britain’s Poor Leadership Example
The United Kingdom loses $7.5 billion US DAILY today (citation) while planning to “cut off the heat” for its senior citizens this winter – in support of “Austerity Measures needed to Balance the Budget“

Austerity & Budgets over Human Rights
Inequality is Ridiculous – Dangerous and Unproductive
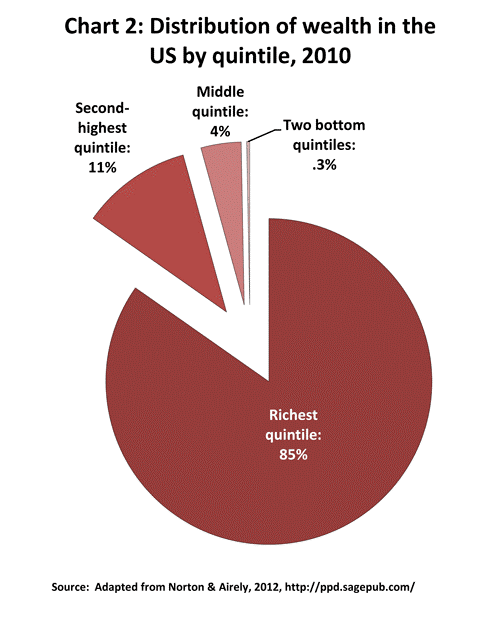
The following chart’s stats were taken from a 2012 U.S. Federal Reserve Report

130 million Americans (40% of 330 million) own nothing, due to starvation wages, and hidden economic losses that cost the USA a staggering $30 billion per day (52% of its economy). Production Growth here and worldwide are at 1930s levels while 90% of large democracies are collapsing – completely unreported

Large Democracies Support Collapse
In Civic Science, People are a nation’s greatest resource
Nations are always more productive when abundance and opportunity abound
Large Democracies are 90% collapsing because they are Oligarchies. Our vote gives Oligarchies control of public funds, which means that billions can be spent annually to ensure Wealth Theory propaganda and other indoctrinations can replace education 100% in our schools – and then in our media too
After decades of slow, steady collapse, our ballot cards no longer offer one single leadership party. This is why WAOH explains that Civic Science Certifications and ACT Parties are essential and necessary to turn around the West’s 40-year collapse


See also Wealth Theory
Abundance & Prosperity
ACT Parties
90% of large Democracies are collapsing today, so Civic Scientists realize that a solution is needed to correct Mature Capitalism and the imbalances created in these Oligarchies now
As a rule, we always suggest solutions to the problems we report here at CSQ. Simply stating a problem and then leaving the reader hanging to guess what to do next is weak.
CSQ presents Two
Guaranteed Solutions
Solution 1
“ACT Parties” is a Case Study Thesis that deploys Civic Science and Civic Scientists, to guarantee that Advance is available to every voter
Read more at What are ACT Parties?
See an example of an ACT Party website at The Advance Party of Canada
Solution 2
Solution 2 makes Civic Science Certification available to existing Political Parties
Endorsements, Certification, and Monitoring
When a Political Group ignores their Monitored Civic Science compliance, they lose their Certifications – and voter confidence as well
Transition Economics is a Civic Science that recognizes the imbalances between incomes and cost-of-living, occur slowly over decades to create mature capitalisms when leadership and corrections are ignored
The United Nations failed
The United Nations was created to protect the world from these reliable cyclic collapses – but has failed in its highest goal and priority entirely. See United Nations
ACT Parties are a thesis in Civic Science that builds FDR Constitutions and Political Parties that emulate policies that make any country successful, as proven in Civic Data Science and as proven by FDR’s unparalleled turnaround (after our last Great Depression) through the 40 years of progressive success that followed his equality laws (see this clearly in the chart below)

ACT Parties can be rolled out in every nation to ensure sustainable Good, Respect, and Human Advance


FDR’s Second Bill of Rights was based on our civilization’s first Constitutions – as explained in the Bible, but without a storytelling format
Certified Civic Science
 DO NOT VOTE
without it!
CSQ Research Certification and Monitoring ensures that FDR’s Causal and Sustainable policies are followed by any Political Party wanting to attract voters and build national and human advance reliably
There are ACT Parties for:
America – ACT Party of America
Great Britain – ACT Party of Great Britain
France – coming soon …
Canada – Advance Party of Canada
and so on …
Automation
Disruption, Change, Human Advance
Good Values for any society include Good, Respect, and Human Advance
Automation is an essential part of Human Advance which must only add benefit and never deny Good (systemic empathy) and Respect (the Golden Rule) to your society.
The Ludites’ example of 1811’s loom automation impact on the textile industry starved to death tens of thousands of unemployed textile workers and their families, who had no government leadership support and, therefore, no income support once their working incomes were abruptly terminated. Workers swept across Nottingham, neighboring shires, and England, as famously explained to England’s Parliament by Lord Byron in 1812
“The perseverance of these miserable men, tends to prove that nothing but absolute want could have driven a large and once honest and industrious body of people into the commission of excesses so hazardous to themselves, their families, and the community. … Never, under the most despotic of infidel governments, did I behold such squalid wretchedness as I have seen since my return, in the very heart of a Christian country.”
– Lord Byron, Maidenhead Speech to England’s Parliament
See also: Competent Government
Competent Investment
Central Planning
Strategic Planning
Right Plans
Right Planning
Two Day Work Weeks
Three-Hour Work Days
This was a reality for husband and father George Jetson and his family in the 1960s Cartoon TV Show – The Jetsons

George Jetson’s button pushing job and flying car was a show and product of The Greatest Generation, a generation of Americans who navigated a Great Depression and War with decency and common sense under the direction of Franklin Delano Roosevelt. The Greatest Generation built 40 years of consistent economic and social advance and left the world a better place for their children
Interestingly, the Baby Boomers – with every benefit given to them by their parents (the Greatest Generation), would fail to repeat the success and accomplishment of their parents
See: The Tytler Cycle
FDR
When your nation fails to navigate itself in a direction of measurable human advance, truth, self-sufficiency, and sustainability, your systems of law, election, and education are either led by a Criminal Legislature or an incompetent one
Edward Tilley, 2025
90% of large democracies are collapsing Oligarchies today, so Civic Science MUST be implemented in Western nations to have any hope of matching the advance seen in Eastern nations this past 30-years

National Productivity – China’s world-leading economic performance is mimicked by dozens of countries that have outperformed the G7 for 25 years now
Dark Factories
Today, China, Singapore, South Korea, and others HAVE Dark Factories, automation, AND Advancing Societies – at the same time


Automation builds abundance, monetizable exports, and higher-quality goods and services. Still, these profits and benefits can also be funneled away from society, offshore, and into a very small number of pockets, leaving millions unproductive and destitute.
Businesses must be Tactical – and focus on their production’s profitability, which is why …
Governments must be Strategic – legislatures, laws, and policy-makers must ensure that Human Rights, Families, and Households are always supported fully throughout these advances, changes, and disruptions.
When businesses can hire politicians or politicians don’t understand Civics, Strategy falters and any society will collapse reliably.
Western Auto Manufacturing Disruption
The Auto Industry is experiencing a 100-year disruption right now as major car markets are refusing to buy the “Ladas” produced by Western accountants at legacy car makers, and are instead deciding with their dollars to buy high-tech, self-driving, battery-powered, Chinese and Engineering Firm cars and trucks.
Governments have never been weaker as 90% of large Western democracies are collapsing today, so the impact of this disruption – on economies and on societies – will be great.
Automation and Unemployment
When automation makes tens of thousands or hundreds of thousands of income-earning workers unemployed, incompetent Government – and not automation – can be singled out as “the problem” immediately
The First Industrial Revolution from 1750 to 1820 created almost no economic benefit or increase because European Governments kept workers in slave-wage workhouse conditions. For automation to make a positive contribution, its profits must be shared to ensure income supports and financial equality across communities in such a way as to encourage automation and not discourage it.
Hybrid Economies
The Evolution of Economics
As automation advances, the need for Human Rights never diminishes.
Automation makes providing for all of our Human Rights easier, but this only happens when time, resources, and good laws are created to protect human rights.
We talk about the importance of the controlled capitalism that created the greatest economy and nation in history below in Civic Science, and we explain the $4 billion per day lost to uncontrolled capitalism in every country today – see the SCP
We discuss UBI (Universal Basic Incomes) that ensure human rights are maintained in Capitalist nations.
The Chinese have installed a hybrid Communist Capitalist economy that protects people and builds strong economies in much the same way that FDR’s Human Rights-focused Capitalism did from the 1940s to 1980s. Some (approximately 5%) private ownership is permitted as are capitalist businesses and commerce.
CSQ Research suggests:
1) The decision system (the “operating system”) is Evidence-based Civic Science
CSQ Research frames Civic Science as assembling evidence-based facts and reality in civics across 220 countries, explicitly rejecting ideology/theory as a basis for governance. CSQ1+1
Key pieces in that CSQ stack:
-
Context-validation + “truth-tested” civic data (WAOH library positioning). CSQ1+1
-
Transition Economics (TE) as a computational civic data science for policy performance management. CSQ1+1
-
“Science of 70% / Tilley 70/30 Rule” to identify high-causality indicators and thresholds for “advance vs collapse” from large datasets. CSQ1
Think of this as: pick policies by measured causality + monitor outcomes continuously, rather than by theory-first debate.
2) Distribution models (hybrids that keep money, but change who gets what)
-
UBI (cash floor; many variants/pilots—some now national-scale). The Guardian WAOH
-
Negative Income Tax (NIT) (cash support via the tax system for low incomes). MIT Sloan+1
-
Universal Basic Services (UBS) (guaranteed access to core services). Wikipedia+2Faculty of Public Health+2
-
Job Guarantee / Employer of Last Resort (public job at a set wage for anyone who wants one). Wikipedia+1 WAOH
-
Social dividend / resource dividend (e.g., Alaska’s Permanent Fund Dividend concept). Permanent Fund Dividend
3) Ownership and power (hybrids that change who owns/controls production)
-
Codetermination (worker participation in governance/boards; strong example: Germany). Wikipedia+1
-
ESOPs / employee ownership (workers gain equity stakes via benefit plans). Investopedia+1
-
Community Land Trusts (community/nonprofit holds land to preserve long-term affordability). Community Land Trusts+1
-
Public banking (state-owned bank model, e.g., Bank of North Dakota). Bank of North Dakota+1
4) Exchange/coordination alternatives (money-adjacent systems)
- Time Equity – read more here
-
LETS / mutual credit networks (member ledger, local units, interest-free credit). Wikipedia+1
-
Timebanking (one hour = one time credit; typically local/community scale). Cambridgeshire Support+1
-
WIR-style complementary currency (dual-currency business trade system in Switzerland). Wikipedia+1
-
Platform cooperatives (digital platforms owned/managed by members). OECD
Competent Governments
& Strategic Planning
Today’s rapid rise in AI and automation makes the loss and hardships created by incompetent governments more important to correct than ever. There has never been a more important time for Civic Scientist Country Builders than today.
National 5-Year, 10-Year, and 100-Year Right Plans are essential to set targets and manage performance against those goals.
Worthwhile Industries’ autonomous supply chains and CSQ Research’s WP Projects are examples of International Trade-creating Autonomous Supply Chain Programs


Competent Investment
 Feed the Right Wolf
In 2025, CSQ Research will be rolling out to 90 countries Economy Doubling ETFs (stocks) which invest in the highest-performing companies that also contribute an essential social and economic benefit
Coming very soon: InvestCS.com
Want to contribute? Refer your responsible Pension and Treasury leads

Feed the Right Wolf
See also:
Abundance
ACT Parties – Responsible Government
Civic Science Certifications
Constitutions – A History
90% of large democracies are collapsing today because of poor Constitutions, and mistraining in what Constitutions should contain
Ask any lawyer or judge in 131 Western nations today, where Constitutions come from: Where do Constitutions originate? You will hear crickets, stumbling, and silence. Law Professors have no idea where Constitutions came from, based on their indoctrination of omitted knowledge, and misleading curricula (see Education Reform)
Harvard University removed “Christus and Ecclesiastes” from its motto (Veritas, …) because a school filled with supposedly “great scholars” didn’t realize that Christus means community and Ecclesiastes means responsible and proven Civics instruction
Contrary to reports by Wikipedia, Google, and every other untruthful indoctrination source, the Bible is NOT a religious book. Religions used and abused the Bible, but its first five books are our first Constitutions, Bill of Rights, and Criminal codes, updating the Code of Hammurabi, Ur’ Nammu, and others. This 5 books, plus 68 others, comprise a scientific civics textbook of lessons taught using storytelling (for its illiterate audience) and teaching tools (a Father, Son, Holy Spirit, and others) based on lessons learned from 2,000 years of civic rise and fall
The Bible is scientific because its lessons are based on evidence and real-world results and outcomes. Its belief-based teaching method was necessary, given our 30 centuries of illiterate populations
EVERY large nation that follows all Human Rights mandated in this Constitution is advancing today
EVERY nation (> 15 million population) that does not, is collapsing – and collapses every 60 years reliably
Citation: The Science of Constitutional Reform
… which is why 800 Constitutions are based on the Bible since 1791
The greatest economy in history was created by FDR’s Second Bill of Rights (taken from the Bible), which corrected the U.S. Constitution after slaveowner “Founding Fathers” cherry-picked (from the Bible) just the rights that kept their slaves as “property”
See also: Turn Around, Advance Policy, and Reset
Importantly, the Bible taught the difference between essential values and harmful ideology:
Values: Using the teaching tools of a Father, Son, and Holy Spirit:
- Good – systemic empathy in actions and in Law (in “Lord”)
- Respect – of family, women, children, parents, neighbours, travelers, and respect for truth and human capital also – known in every religion as the Golden Rule
- Creation – Building and the shepparding of Human Advance
— Versus —
Ideologies – “false idols” and “the Beast”. 99% of ideologies are harmful, are not “morality”, and are definitely not our good values
Do you not imagine that the NAZIs interviewed their leaders to ensure that their “values” aligned with the NAZI party’s harmful ideology? They did of course, and citizens were forced to suppress good values as the country was destroyed by war
See also: Ideologies
Societies must earn their right to exist. Systemically unempathetic regimes (the definition of “evil societies” in the Nuremberg Diaries) always fall throughout history. Their neighbours mass until the offending nation is overthrown – without exception
This is timelessly important teaching because merchant-class Oligarchies have always collapsed societies reliably. Guaranteed collapses leave Oligarchies with no alternative (in democratic voting populations) other than to control reporting, control media, to indoctrinate the public with propaganda, to ignore reports of collapse and responsible Civics instruction, and to win hearts and minds through lying and omission. Why? Because no responsible voter would vote for these political groups again based on the truthful reporting of their abysmal performance and misleadership
Once an election is easily purchased in a large democracy, these groups can then use public funds to spread their indoctrination and propaganda in full
Citation:
Constitutions
Civic Science , Constitutions , Turn Around , Human Advance , Economy , Economic Reset , and Advance Policy
See also: Competent Government
Criminal Legislatures
Globalist Election Sieges
What is Civic Science?
Civic Science – explains 100% evidence-based, context-validated facts and realities in Civics
It does this for 250 countries and principalities, and Civic Science explains these facts and realities today, as for 4,000 years in history
Like most sciences, Civic Science adheres to the Scientific Method and can be confirmed truthfully by anyone, anywhere
Civic Science adheres to Isaac Newton’s principle that Science must be simple and never compromised by complex manipulations
Like any legitimate science that impacts the public, Civic Scientists swear an Oath to “DO NO HARM” to the public
Solutions in Civic Sciences build measurable economic and social advance realiably (read about TE Proofs, Fact Tanks, Context Validation, Truth Testing, and the Science of 70%)

Harmful Civics
False, utopic, unsustainable platitudes and harmful definitions of Good and Good Values (ideologies) are warned against in Civics for 3,000 years
The Bible never says God is a deity. What it says, 20+ times, is that God is Good. Then its first law commands that no false definitions of Good – “No False Gods” – can be permitted. Its second law forbids the symbols of these harmful ideologies, like swastikas and pride flags
How common are harmful ideologies today?
Today, rainbows depopulate nations by more people annually than six years of swastikas did in World War II. Ideology has become common, ubiquitous, systemic, and embarrassing
ALL AI companies, Google, Microsoft, YouTube, Wikipedia, ChatGPT, Grok, DeepSeek, and others, explain and teach harmful ideologies. – proven-failed theory (Aristotle’s definition of fiction) entirely 100%. Wealth Theory (far right macro and microeconomics), Gender Theory, Climate Dysphoria, Female Equality hiring, Feminism, …
The AI tools and anchors at CSQ Research WAOH teach Civic Science, proven to advance societies
The Nobel Prize
The Nobel Prize‘s brand was corrupted to explain harmful economic theory as truth – beginning in 1971. Micro and Macroeconomics are theory-based curricula, and the proven-failed Wealth Theory that says Profit is the most important priority of every nation
Wealth Theory is all that we teach in Western Christian Universities while:
- 90% of large democracies are collapsing for four decades today
- Two dozen large democracies are in a state of war and siege against globalist criminal legislatures
- The average Western nation loses $4 billion per day – the USA loses $30 billion per day (see The SCP Report)
- We are in another Great Depression – hidden from us by paid and censored media, one-sided propaganda, and academic macroeconomic theory and Central Bank reporting
- Public Reports are UNIMPORTANT: GDP, U-3 Unemployment, Stock Market Performance, FDI Inbound, Balanced Budgets, ESG – are not important to economic advance
“When you don’t know what to stand for, you fall for anything”
Responsible Civics
Responsible Civics are lessons learned from the rise and fall of empires over four thousand years of written record
These lessons were written down so that we would not fall into the same trap again and again
The Code of Hammurabi (1763 BC) and Ur’Nammu (2100 BC) were successful Constitutions, the first was more “eye for an eye” and appropriate for times of great unrest, and the second earlier book of law favoured financial penalties – as suited a more balanced and peaceful society
Codes and Cylinders through the ages explained what we today call a Constitution, Bill of Rights, and Criminal Code
22o countries have surprisingly similar Constitutions today. Many of the Ten Commandments are seen in Ur’Nammu’s text while many of Hammurabi’s 203 laws were updated to 620 laws by the Hebrews in 763 BC’s Old Testament
The Golden Rule
Why was a New Testament added to our Civics textbook? To add the essential storytelling, teaching tools, and good values explained by the Golden Rule – Respect. Respect of neighbours, parents, children, women, husbands, and the reminder to treat others as you would want to be treated …
Always with Dignity and Human Rights
Economies are “high transaction systems” – like a busy Casino or major league baseball season. Transactions that are executed within High Probability of Success rules (policies), are guaranteed to succeed
Probability is the reason that “the house always wins” in a busy casino. Every transaction takes place with a slightly higher percentage chance of the house winning over-all. Casinos do not have to win every transaction or to “beat” every player
Unfortunately, in stable global societies, the groups in positions of authority, power, and wealth, can protect their power by misrepresented and miscommunicated responsible civics lessons to the point today where these handed down learned lessons are fairly indecipherable. The lessons are still there, and just need to be explained properly
See Civic Science Certification
The Book – the Scientific Update of the Bible
Transition Economics
One of the first legitimate Civic Sciences is Transition Economics (TE), see that example here
There are no ISMs and no Theories in Civic Science. You should be running away from any wannabe professors and courses who tell you differently. Experts of ISMs, ideology, and fiction, are experts of nothing, and their ideology is indoctrination whenever it is presented as “real and important”
“ISMs” are not education
No Theory or Ideology-based Economists are permitted as Civic Science uses only evidence to confirm:
#1 Important decisions and policies
#2 Unimportant and Neutral policies
#3 Dangerous, Harmful, and Expensive policies

Learn Civic Science
Civic Science is simple, easy to understand, and requires grade 5 math only, but like Civics itself its scope is broad with many extensive, important Research topics in many areas. The creator of Civic Science updated the Bible by validating its observation-based lessons learned from history’s rise and falls, with today’s civic data science
Civic Science Courses – are available here
Books – The Book, Civic Science Book of Knowledge, End of War, Transition Economics (concepts before data science was introduced)
Online Knowledgebase & Context Validated Summaries (Truth) – Transition Economics and WOAH Public Library (this library is the online CS-BOK)
Adoption – Every new science endures a transition period of initial resistance to foundational adoption. This was true of Einstein’s Special Relativity, Bill James’ Sabermetrics, Alan Turing’s Bomba Enigma-cracking computer, DNA Evidence in western courts of law, and evidence-based Civic Sciences like Transition Economics (TE) is no different
Legal Adoption – Like DNA Evidence, Civic Science must be adopted by Courts. Statements of Claim and Leave to Appeal to Supreme Courts establish important Case Laws, guidance, and precedents that Courts can then use to ensure Criminal Legislatures can never find a ballot box or build media propaganda ministries in your nation.
See: Globalist Siege
Criminal Legislatures
Tilley vs HMK in Canada’s Federal Court
Civic Science Endorsements & Certification
For political parties, corporate, and government Civic Science Certification – see Endorsements, Certification, and Monitoring
See also Certifications
Say Yes to Civic Scientists & No to Economists
Civic Science is created and taught by Civic Scientists, and not by Professors of Economics or Finance in Western Universities who actively block Civic Science today
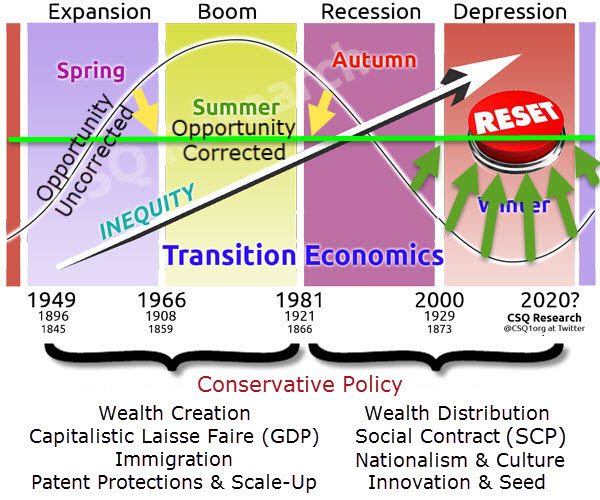
All Capitalist nations lose a healthy “cost-of-living versus income” balance every 60 years cyclically and reliably. This reality has been recorded since the first Constitution explained how to correct these repeating imbalances 4,000 years ago. The earliest record of back-then-frequent and normal “Resets” is in the Code of Hammurabi (1763 BC). The Bible is an update of this Constitution so that you can find a description of preemptive 50-year Jubilee Year Economic Resets (aimed at resetting imbalances in any economy) in Leviticus 25:26
Imbalances between incomes and cost of living occur slowly over decades (due to compounding inflation and luck in business dealings or farming mishaps), or more quickly in the case of Canada’s Bill 25 laws that deny income to families and leaders, until inequalities grow to create Mature Capitalisms (Great Depressions). These happen reliably whenever leadership can not or will not correct the imbalances
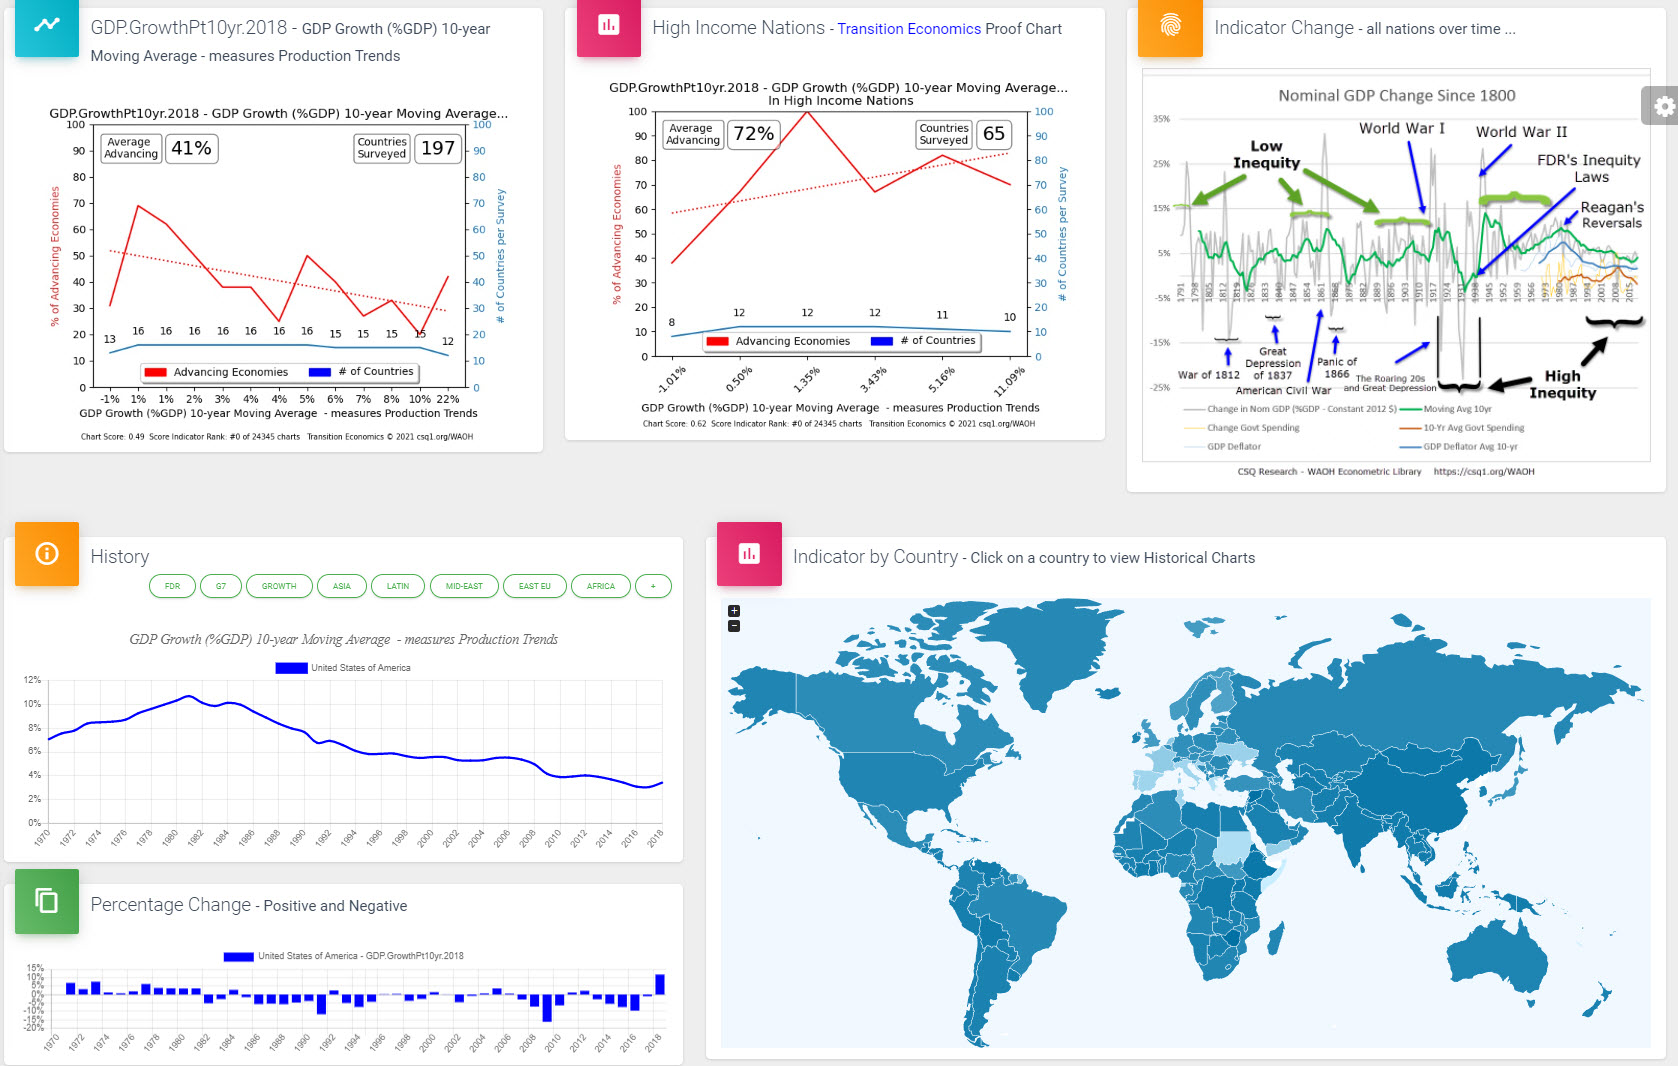
The cycles are predictable and correctable, obviously. The research chart above depicts monetary system cycles as explained by Nicholae Kondratieff a century ago in 1925, overlayed by the corrections recommended by Transition Economics; corrections that avert collapses later in the cycle to permit consistent advance sustainably
The Bible is storytelling that teaches Civic Science (Lessons Learned)
Populations in most of the world were illiterate and without formal education until just 50 years ago. Civics and good values had to be taught to populations with belief-based teaching methods.
The Bible (the Pentateuch is its first 5 books – Genesis, Exodus, Leviticus, Numbers, Deuteronomy) is an update of at least two successful and time-tested Constitutions – one by Hammurabi and another by Ur’Nammu.
Economic Resets? Look to Leviticus 25-26 to see 50-year Jubilee Years to reset all debts and obligations, resetting things back to a state of balance so that all members of a society can live productive, good lives sustainably
Good Values? Father, Son, Holy Spirit – are teaching tools for Good, Respect (the Golden Rule), and the shepherding of Human Advance
Criminal Codes and Law? To find the Bible’s 613 laws, replace “This is the word of the Lord” with “This is the Law” as you read Exodus
Bill of Human Rights? We ask readers to please support the WAOH Civics Library by finding the answer to this question when you purchase and read “The Book“
FUN FACT: Affidavit of Truth
In a Court of Law, an educated individual will insist on the Bible when offering an Affidavit of Truth, while an indoctrinated individual will refuse it

America’s Greatest Civic Scientist
US President Franklin Delano Roosevelt (FDR) created the greatest Great Depression turnaround and economy in history, with the following turnaround policies:
Voters can only support sustainable Advance Policy. Voting for Collapse Policies is socially irresponsible and explains why 90% of large democracies are collapsing today
FDR’s Second Bill of Rights restored a full list of human rights (from the Bible’s proven Constitution) to the United States after slave-owner Founding Fathers cherry-picked only the human rights that protected their property in their Bill of Rights
FDR’s constitutional corrections went on to become the United Nations’ Universal Declaration of Human Rights. Today, this Constitution serves 83 nations (Wikipedia), including Germany, Japan, and Italy. The nations that lost the Second World War are all advancing still today because they updated their Constitutions to this new (4000-year-old) standard
Truly, it’s a terrible shame that FDR passed away before being able to amend the US Constitution with his Second Bill of Rights. The missed opportunity has today evolved into an expensive and dangerous period of imbalance for the United States
Constitutions, the Cost of Collapse, & Population Size
Population size matters in a democratic system of government, especially in nations with weak Constitutions, insufficient Human Rights, and Laws that permit imbalance. The United States is one of the earliest large democracies but it uses a “cherry-picked” Constitution, unfortunately, so it has collapsed into Great Depressions every 60 years since 1776’s Great Depression. America has fallen into mature capitalisms every 60 years since it surpassed a population of 20 million in 1850

Smaller democracies can vote out harmful policies and groups quickly. We saw Jacinda Ardern voted out (population 5 million) in New Zealand quickly, while Justin Trudeau (population 35 million) remained in leadership for years after Canada suffered the world’s largest housing bubble alongside many similar harmful WEF-sponsored DEI and gender theory policies
See article: 90% of large democracies are collapsing today
Costs of Resisting Advance Policies
207 countries lose $4 billion per day on average, the USA loses $30 billion daily, due to the lowest production growth since the 1930s worldwide
Collapse Policies – create Social Costs:
- Loss of financial support for the nuclear family, pensions, living wages, good jobs from diversity and inclusion DEI campaigns or opened borders (high immigration)
- population genocides equal to WWII Europe’s losses – are found in 64 countries today (1.5% is annually lost to WEF’s Diversity “Girl Power” Feminism Campaigns)
- incarceration rates spike; gun dysphoria; demonstrations, mobs and revolutions
- suicide, assisted suicide, and divorce soars
- homelessness soars – this is seen in democracies only; no homelessness is permitted in Monarchies
Resistance to versus Adoption of – Important Change
Individuals or Organizations who don’t want things to change will resist change. But change is needed to rebalance the cost of living and to ensure citizens can be productive
Examples include:
- Landlords oppose Rent Controls that ensure affordable homes (regardless of people being homeless)
- Economist Mathematicians oppose evidence-based Civic Science, and this makes them unqualified even to teach Economics
People who have what they need, who want to continue to hold power, or who want no change will:
- resist or block important change and rebalancing – see Our Academic Mediocracy
- teach everyone else to resist change –
- dumb down Government – by calling leaders of balance and change Authoritarian or Totalitarian
- dumb down Schools to fail individuals who introspect (60% of males fail degree programs in North America) and advance those who follow indoctrination,
- dumb down Business – teach MBAs, Accountants, Human Resources, and Teachers to be anti-expert (experience and ability are unimportant), anti-leadership, tactical (not strategic), anti-merit, and to do what the consensus and status quo does
- only give jobs and degrees to followers (someone who is a “fit”)
Examples:
- Einstein sat for 20 years unrecognized and ignored for his (and his brilliant wife’s) e=mc2 Special Relativity work (1905)
- 90% of large democracies are collapsing because they are unable to make changes as needed to rebalance their status quo
- Transition Economics is data science that TE is actively blocked at every major University in the World, by Wikipedia, and even Google
- The Loom Weavers (Ludites) uprising of 1750 (due to laws and misleadership failing to support lost jobs due to automation)
- Alan Touring, Bill James, and many, many others
Credibility
Credible Measures
The beating heart of an important Civics Library like WAOH is the data it reports is:
- Accurate – as possible,
- Current – as relevant (events like Covid make “the most current trade data” untypical), and
- In Context – appropriate to the truthful explanation of conclusions, policies, and recommendations made from these measures
The Truth and Credibility of the statistics at WAOH stand up. 99% of the library is here unchallenged for 3 to 6 years without update or challenge by an international community
New Additions to WAOH:
- Incarceration (Jail time) for Thoughts and Words
- Law
- Investment – Civic Science ETFs & Bonds
- Criminal Legislatures
- Corruption
- Female-Vote
… build on foundational learning and statistics, which each section is bound to link to within the library, like building blocks in any science or structure
Examples include:
Education – WorldBank’s data library 6 years ago used Number of Years of School alone as the basis for its assessment of education quality in 220 nations. Today, it extends its measures to add credibility to an obvious gap. See Education at WorldBank
Other Civics Data Repositories:

WorldBank
Education IndexEducation Costs
WAOH Data Science – Find the most recent list of TE Education Stat Reports and scores by entering “Education” in the Indicators List

Experts
Science
Experts in evidence-based sciences are essential
FACT Tanks
Fact Tanks differ from Thinktanks
Fact tanks present evidence-based sciences, driven by a Standard of Research, Context Validation (Truth Seeking), and Performance Reporting that confirms a concerted effort to advance Good, Respect, and Human Advance in Civics; measurable and confirmable by anyone
Fact Tanks can have a difficult time finding billionaire and DEI government sponsorship, so DONATE to these initiatives whenever you can
Professions with the most Experts
Professions that take an oath to never harm the public are a good indication that they are essential experts in their fields, but actions and performance through career count too
- Engineers
- Journeymen, Apprenticed Tradesmen and Craftsmen
- Civic Scientists – Civic Science is 100% evidence-based and context-validated truth that leads to strategic Good, Respect, and Human Advance reliably. See Civic Science Certifications
Professions that are NEVER
Scientists, Experts, or Leaders
Charles Darwin’s daughter was treated with mercury, lead, and arsenic until her horrible death at age two – by doctors trained at the highest Academy schools and Societies in the land
Scientists, Doctors, and Experts – who distributed and prescribed Thalidomide or an untested COVID vaccine – were never Experts or Scientists either
- Economists – are qualified by irrelevant double-integral calculus in Western Universities, to study and then protect non-evidence-based Proven-Failed Wealth Theory Micro and Macroeconomics
- Professors – who teach “ISMs are real and important”. Social or Political Scientists rely on partial tactical misleading (not context-validated) data that fails to build Good, Respect, and Human Advance reliably or strategically
- Opthamologists – who prescribe ever stronger eye-glasses for the lifetime of a patient
- Accountants, MBAs, and Bankers – Businesses led by entirely tactical Accountants trained in Wealth Theory by our universities – have proven their professions parasites by collapsing 90% of large Democracies into another Great Depression today. Clearly, experts in bookkeeping are not experts in Business, Government, or Leadership
- DEI Appointed individuals – Promote collapse in any society. See Diversity
Professions that encourage ANTI-EXPERT viewpoints
- Politicians defending harmful ideologies like Neoliberalism and Wealth on the “right”, or feminism and DEI on the “left”
- Persons trained to believe that harmful ideologies (like Right and Left) are real and important
- Non-Leaders, Followers, “Fits”
- People who don’t understand, or are not trained, how to recognize experts AND how to dismiss harmful proven-false theorists quickly
- People who insist on other “Other Gods”; other utopic definitions of Good, like Feminism, Libertarian, Capitalism (Capitalism created the Great Depression in the 1920s) and similar harmful ideologies
Freedom
Freedom is essential to strong societies and economies in science, but it’s also an ambiguous term that we want to define as:
- The Right of a Good Job – access to Income
- The Right of a Living Wage – that well affords Costs of Living
- The Right of a Pension and Security in Old Age
- The Right of a good Home and Home Ownership
- Truthful Reporting
- Expert Leadership
- Protection from over-reaching, intrusion, and harm
Freedom by this definition enables Productivity, which created the greatest economies and societies in history in the 1940s and 1950s, and can easily double our economies again today also …
FDR called his “Freedom Campaigns” his Second Bill of Rights, and it was extremely successful
God
Good
Warning: Religious literalists will want to skip to the Religion and Civics section below
“God” is a teaching tool for “good” – essential, systemic empathy in any society. “Good” must be in laws (the Bible calls Laws “Lord”) and good must be in our values
Santa Claus is a teaching tool for kids to learn good behavior – and God and his Trinity teach adults good civics. The Bible states “God is Good” twenty times, so this is hardly a stretch explanation
Good, Respect, and Human Advance – is truthful fact-based instruction
Father, Son, Holy Spirit – is proven-to-work belief-based instruction
Teaching good civics with a belief-based approach was important when populations were illiterate. Human beings were just as capable 2,000 years ago but were uneducated and superstitious too. Teaching a population of people that being good 7/24 is in their own hands with no watchdog or afterlife incentive, encouraged “holidays” where murder, theft, adultery, etc. might seem ok because “we have behaved well for a couple of weeks now, after all”
For any civilization to thrive, we must all be good all of the time without exception
Human Mortality also needs blame taken away from grieving parents and loved ones – so that now it’s “God’s will” (not Mom’s fault). Christians and the Vikings, assured us that a God and afterlife built stronger armies
Voltaire said it best,
“If God did not already exist, we would surely have to invent him”
If you ever called yourself an Atheist, now you understand that God is the start of an important lesson in good civics. Most Atheists believe in good already, they are just not bright enough to figure out the Bible’s “teaching tool” approach (for teaching good civics and good values)
—— Religion and Civics —–
It is important to believe in God and the civics teachings of the Bible. I’m a Civic Scientist and I do. Why?
Because the Bible teaches that good and systemic empathy are essential (based on its observation of 2,000 years of civic rise and fall and this is Scientific Method’s approach as well). The Nicaean scholars ensured that their storytelling and civics lessons were the same in belief-based and evidence-based explanation
Is homelessness okay? No, the Bible explains that a home is a Human Right.
How about employment/income, education, pensions, living wages, families? These are Human Rights too. FDR‘s Second Bill of Rights are all from the Bible, and those laws built the greatest economy and society in history
Are Feminism, Neoliberalism, Right, Left, Isms, Economic Theories, harmful ideologies, and deep fakes (“false idols”) moral, good values, and important? No, the Bible’s Constitution prohibited “false explanations of good and reality” with examples and parables of what is good and what is not good
Are foreign or internal groups that conspire to weaken countries economically and socially good or bad? The Bible called these economic powers “The Beast”
Guesswork in civics (Separation of Church and State) has collapsed 90% of large democracies today, so God’s good civics training is essential as can be easily validated by the evidence-based surveys and science found here at WAOH
“Good Thoughts, Good Words, Good Deeds”
– Zoastrian Christian prayer
Actions are not thoughts and not words. Our thoughts and words might not be as good as we like, but only our actions should be measured and held accountable. “Good in all three” is a goal that every society should work toward – through productive human rights, justice, and equality
Good is never achieved – by legislating and enforcing the thoughts, words, and actions of harmful ideologies
See also Education: Belief-based and Evidence-based
The Bible at WAOH
Constitutions
Human Rights
Abundance:
- a decent Income (a Living Wage and a good job)
- support in important self-employment)
- Food
- a Good Home
- Healthcare
- a good Education
- Protection from Foreign Competition and Monopolies
- Pensions
- Family
- Good – in Law and in Government
- …
EVERY large nation that provides the United Nations’ Constitution and UDHR (Universal Declaration of Human Rights) is advancing today. UDHR was FDR’s Second Bill of Rights which also created the greatest economy in history for America 70 years ago

Where did FDR get his list?
From The Bible’s Constitution, I suspect. The Bible is a 4,000-year-old Civics Textbook that teaches scientific-by-observation lessons and best practices using teaching tools and belief-based teaching methods
Civic Science is evidence-based data science that confirms that the Bible’s policies work every bit as well today, with more detail on how to ensure success
When the world was 99% illiterate, belief-based training methods were essential. Today, however, we all need training in Civic Science to combat a constant barrage of harmful ideologies at work, school, and in our media
In the Bible, a Father, Son, and Holy Spirit, teach Good, Respect (the Golden Rule), and Human Advance
In the Bible, utopia-promising Harmful Ideologies were “Other Gods”; other definitions of good values should never be allowed – because they collapse ANY society
Right Political Parties – install collapse and harmful ideology (Wealth Theory, insufficient Human Rights). Left Political Parties – install collapse and harmful ideology Feminism, Woke anti-expert and anti-merit Cancel Cultures
When you don’t know what to stand for, you fall for anything
CSQ doesn’t publish the Bible’s full list of human rights – Charter of Rights – here on our website. We ask instead, for your help in supporting this Library’s operating costs by purchasing “The Book” and its Civic Science Book of Knowledge (CS-BOK) for full documentation of the Bible’s 4,000-year-old Civics lessons
Why do Human Rights assure Civic Advance?
Because a full complement of Human Rights permits all citizens to be productive and to create monetizable exports as well

The US Constitution was created by slave owners, does not protect human rights sufficiently, collapses America every 60 years, and is proven to collapse all other nations when they use it too (once their populations exceed 15 million people). This is a very correctable problem …
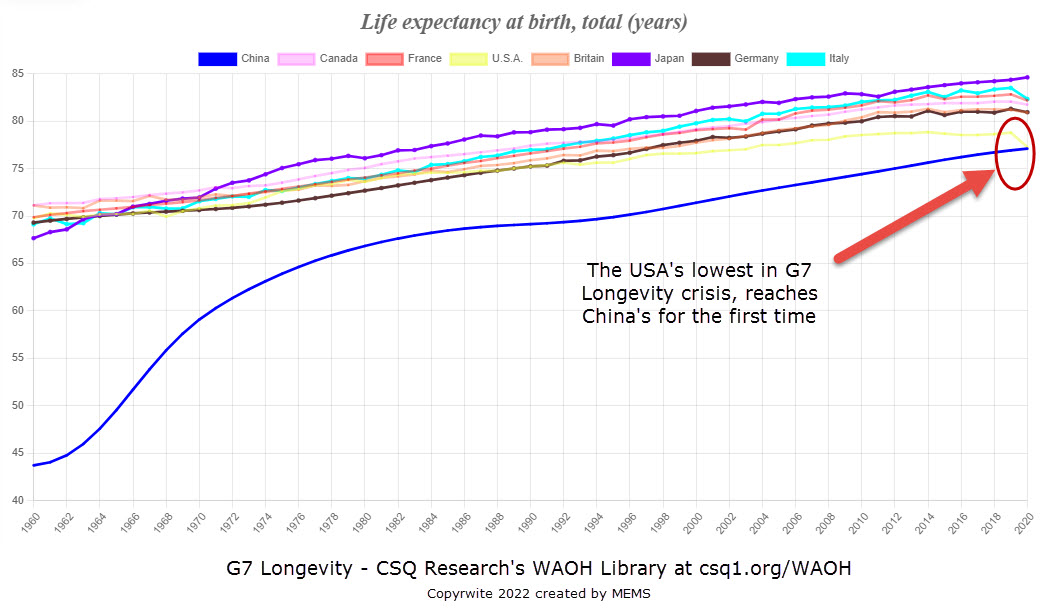
Human Right: Good Homes &
Home Ownership


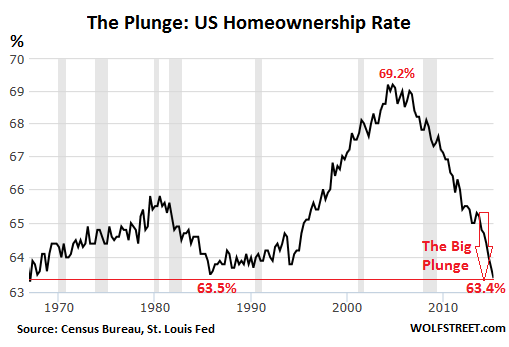
The Human Right to a Decent Home is essential
According to who?
- The Bible – the Bible’s first five books update successful Constitutions built from lessons learned while observing civic rise and fall over 3000 years
- FDR’s Second Bill of Rights – which built the greatest economy in history and all nations that follow it are advancing today. Adapted from the Bible …
- The United Nations’ Universal Declaration of Human Rights – adapted from FDR’s Second Bill
- The Canadian Bill of Rights of 1961 – was ignored for 30-years until Canada is now marginally collapsing as homes have become unaffordable and homelessness has skyrocketed
- Evidence-based Civic Science – for all countries
EVERY nation that assures a Decent Home in Constitution is advancing today – Citation
Housing Bubbles ![]()
Housing bubbles must be prevented AND repaired when created!
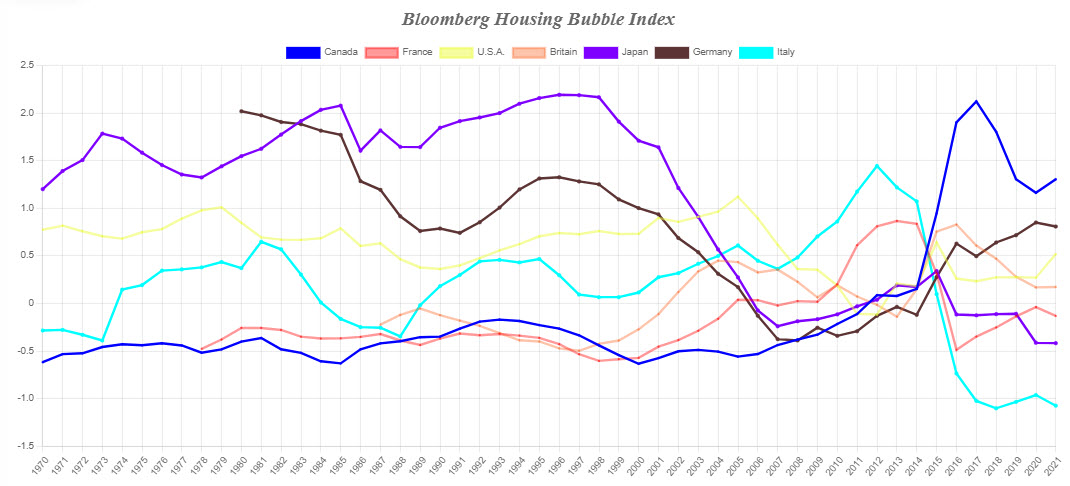

The Bloomberg Housing Bubble Index
Creating a Housing Bubble

Creating a bubble is straightforward. And, only financial incompetence and unqualified leadership permit them.
- Raise a billion-dollar fund. It’s easy to do and costs nothing when you have a track record of repayment and profit.
- Money from nothing. International banking jurisdictions do not have to prove they have 10% in saving when a 90% mortgage is provided.
- Focus on one town at a time
- Buy every house – tell realtors you are buying with “cash”. As only 1 in 50 homes is typically for sale at any one time, you will artificially inflate the property values of all homes.
- Complicit or financially illiterate banks will immediately begin to extend lending (loans) based on newly “bubbled” asset valuations, instead of “cost plus inflation” (which is all that an aging home’s value has – with few exceptions). All structures have a lifespan and don’t improve with age, so any home by itself should be a devaluing asset.
- The home “bubbler” can now borrow to pay off the 10% down payment that they claimed to win the mortgage that bought the property. Your children work for a lifetime to pay for a mortgage
- Usury – how can a 100,000 per year employee with a 45% tax rate pay off a $1 million home loan? They cannot, and very few will. Young families become lifelong debt slaves while they compete with banks that paid nothing to bid their home’s cost up, up, and up – to unaffordable levels.
- Politicians permit this predatory banking profit-making because of banking lobby contributions (corruption) and a GDP report increase, despite creating zero new production. When GDP goes up, politicians count on your ignorance of the report’s unimportance to win elections by claiming a strong economy.
- Sell your housing holdings for double or triple their original cost in a snowballing market of house flippers and slumlords, until the bubble bursts in spectacular fashion, which creates wide poverty and hardship for all, while only profiting just a handful.
Off-shore banks are not required to prove they hold a 10% downpayment when securing 90%, where banks in North America and Europe demand evidence. This means that new home buyers must compete for homes with “magically” created money. All that the offshore bank has to do is to cover the 10% deposit with their 100% return at the time of sale.
At this point, housing becomes unattainable for young families (and anyone who doesn’t own a home). Many are forced into Usury (the practice of taking loans that can never be paid back; a form of financial slavery and lifelong servitude to a debtor.
Financial Inclusion
Universal Basic Income
See also Unemployment
Access to income is a human right and an essential need of every successful economy and society. Financial Inclusion, Living Wages, Full Employment, UBI Universal Basic Income, and Safety Nets are all essential
It’s important to realize that anti-family policies like Female Equality – hiring policies encouraging Double Income Traps, Family Pension Deletions, Starvation Wages, and anti-expert, anti-human-capital, anti-merit, anti-leader, and anti-respect policies of hiring by race, gender, creed, or sexual proclivity, can never be confused with Financial Inclusion
Financial Inclusion ensures that all heads of households are employed in positions and incomes appropriate to skills, experience, contribution, etc.
In the 1940s, no senior politician or businessman could be employed unless they also supported a family, and then their incomes also easily afforded all needs of life – a home, a cottage, a good life for a couple and both families, land, and were able to start a business, etc.
See also Inequality and Diversity and Inclusion
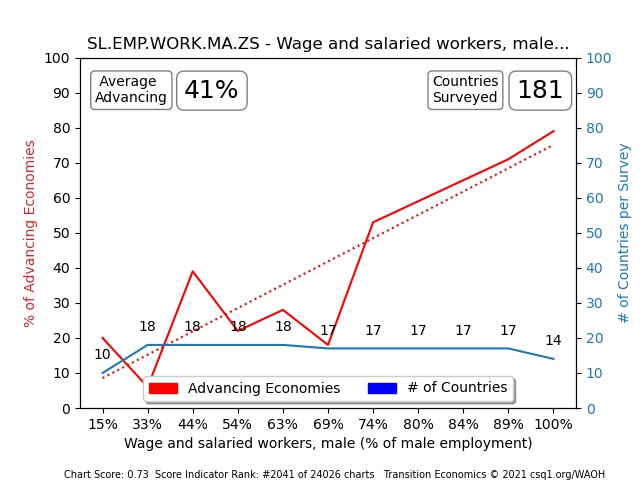
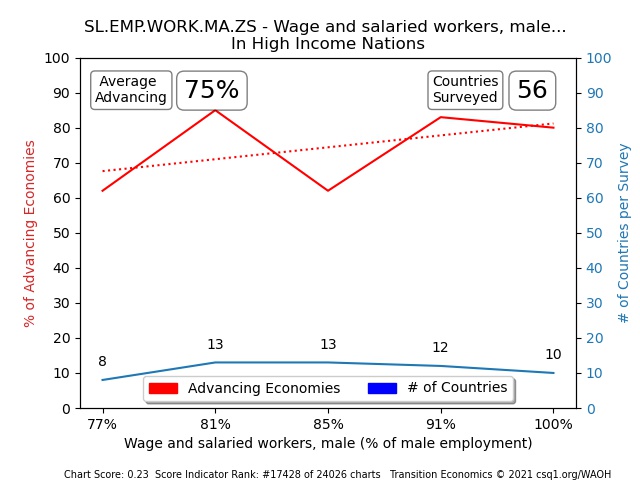
Fix Inequality
Inequality is the greatest problem of our generation, as we stumble (very foolishly) into another leadership void and mature capitalism imbalance created by incomes not matching costs of living – and poor civics training
The solution to Inequality is Trickle-Up (wealth and income distribution). Trickle Up built and still builds the greatest economies in history, while today’s pervasive Trickle Down builds collapse reliably
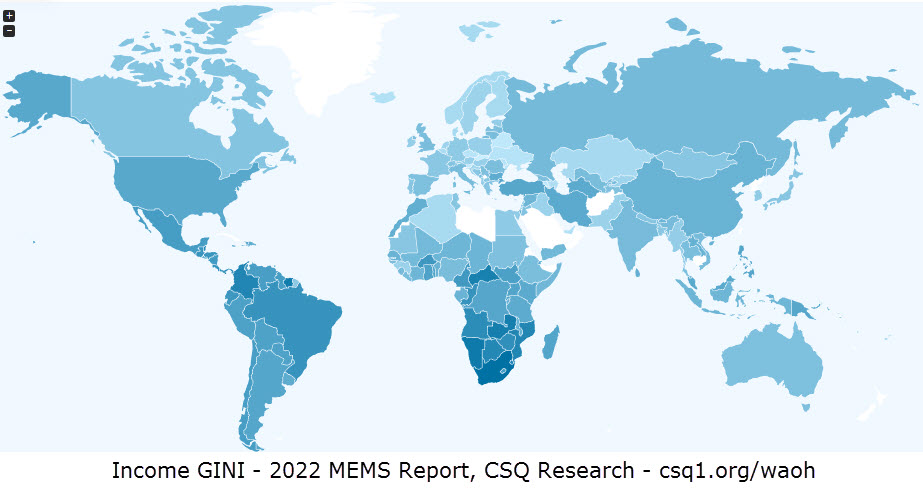
Income inequality (GINI)
Income GINIs of .26 enabled the greatest boom in history

Historic Income Tax – Top Percentile
Income and Wealth Inequality costs every nation $4 billion per day; the USA loses $30 billion per day (50% of their economy)
Palma Ratio
Top 10% incomes divided by bottom 40% is an important emerging inequality measure

Inheritance Tax
1980s Republican “Think Tanks” renamed Inheritance Tax, as a “Death Tax” in a marketing campaign and effort to sell harmful Wealth Theory indoctrinations in media and common TV vernaculars.
These think-tank programs were showcased in the Michael Moore movies: Capitalism: A Love Story (2009) and Where to Invade Next (2015)
The “Greatest Success” of indoctrination campaigns like these, was probably the propagation of harmful ideology textbooks by Milton Friedman, which are still required reading in most Western Universities today
As it sounds, an Inheritance Tax is simply a tax on the estate of individuals who have passed away.
Wealth Inequity dropped to .66 in 1944, at the start of the greatest economy in history
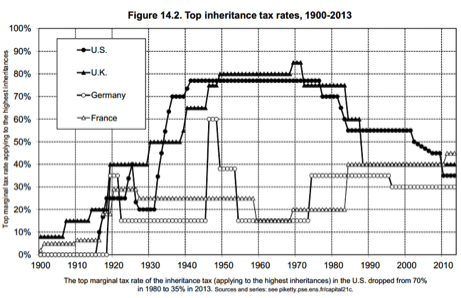
100-years of Inheritance Tax – Top Percentile
Fed Reserve Wealth Inequality 2022
Internet Access
One of the most reliable precursors to Advance in any nation is Internet Access
Leadership
Leadership – both Strategic and Tactical, requires a firm understanding of proven-successful civics, scientific evidence-based policies, and Constitutions
The only “side” you should be voting for is Advance. ACT Parties are essential because democracies can’t vote for advance or responsible leadership today, with media and the merchant class’s money and support of harmful Right and Left ideologies
An old trick of population control installs non-expert non-leaders into high positions nationwide, while marginalizing the engineers, builders, most experienced (human capital), and smartest citizens of a nation. Reports of national collapse are hidden and harmful ideologies are applauded. Poland has been a victim since WWII, as has Russia, Canada, Britain, and the USA
CS-BOK is The Civic Science Book of Knowledge

Health Care and Longevity
Longevity (“Expected Lifespan at Birth”) – is a causal measure, and on of the best measures of a nation’s healthcare infrastructure and human rights also
Insufficient basic needs of life (Income, Food, Housing, Healthcare, Education, etc.) will lead to reduced longevity – and favourable conditions lead to longer lifespans
Longevity is a 600th-rank report while GDP is a 2000th-rank TEP report. This makes Longevity more important to economic success than GDP

Nations with longer lifespans advance – while nations with lower longevity collapse
Innovation
The Global Innovation Index is an international measure of national innovation, that ranks countries on dozens of evidence-based measures
Canada is a G9 economy, formerly G7 and now 16th in innovation, which leads one to believe poor Innovation is indeed a causal measure – as confirmed by TE


Nationalism
Nationalism and Culture are the most important values that a country can share
Self-sufficiency and Infrastructures for all basic needs of life (SDGs) are every nation’s first priority
Freedom from competition for jobs and goods from other nations’ suppliers – and from immigration, offshoring, on-shoring, and female equality that eliminates living wages, family pensions, and families too
Culture – is also essential to any country. Melting Pots create strong communities while Multi-culturalism creates weakness by division

SEED Automating Social Contracts & Self Sufficiency
In large democracies, Advance Parties (Civic Science Certified and Monitored experts – see ACTCanadian.com) are essential
Global Organizations
The United Nations
In 1945, the United Nations was created by geniuses to teach every nationalist nation on earth how to avoid mature capitalisms, how to monetize economies via strategic win-win international trade, and how to avoid the two world wars that unmanaged economic cycles had just created avoidably
The UN was equipped with FDR’s Second Bill of Rights (from the Bible) via its Universal Declaration of Human Rights Constitution. This Constitution created the greatest economies and societies in history, and today all high-income nations that run by it, are advancing (despite our present global mature capitalism)
The United Nations has failed its 1945 mandate and needs restaffing now. Why? The UN Security Council inadvertently undermined the UN General Assembly by appointing non-experts and non-leaders to run it since the 1980s
Multi-national Businesses
WEF, WHO, and other Globalist Authority Organizations were called “the Beast” in the Bible’s Civics textbook. Merchant-class oligarchy groups that collapse any nation reliably for their own profit, are not of value to any nation
Sharing scientific research and proven-successful civic best practices is good and creates advance reliably (see WAOH and MEMS) whereas sharing authority with Oligarchy SuperPACs invites espionage, malpractice, and collapse
Why have multi-national businesses collapsed nations for 40 years now? See “Money“
Pensions
90% of the world population has no pensions, while pensions create advance reliably for any nation
Financial Security in Old Age
What is the reason that financial security in old age, as FDR put it, is important? Pensions and incomes make senior citizens important economic contributors in all stages of their adult lives and in retirement years
Seniors without pension supports may find themselves unfairly labelled an economic burden, while in reality an incompetent government has not planned nor provided for certain citizen retirements
The Melbourne Mercer Pension Index is a smaller sample size, but its Transition Economics Proof (TEP) Chart below shows clearly that the nations with a higher percentage of pensioned citizens (69 to 81%) are all advancing

Production
Worldwide, we are at 1930s levels of production growth, as seen here in the US

Every nation loses on average $4 billion daily to low production, and 90% of large democracies are collapsing

National Productivity – China versus G7
Production FAQ
GDP (Gross Domestic Product) Reports, Economists, and Finance Industries make the very great mistake of confusing meaningless profit with production. GDP calls housing bubbles, inflation, and hording and profiteering “Production” – when these things are not productions at all.
- Is financing a residential housing development Production? Yes
- Is the financing of a residential housing bubble Production? No
- Is financing an artificially inflated asset Production (Asset Management)? No
- Is creating an offshore horde of excess business profit Production? The GDP Report says yes. No
These realities cast the tactical, business-profit-focused curricula of Western Economics, Business, and Finance University Faculties into stark relief. Clearly the theories that pass for education are subversive? sponsored? indoctrinations instead
Clearly the motives and incentives for indoctrinating students instead of educating them need to be explored and removed from our academic systems
The Proof that Wealth Theory collapses every Nation Reliably
Production Economies and productivity are important and causal to economic success
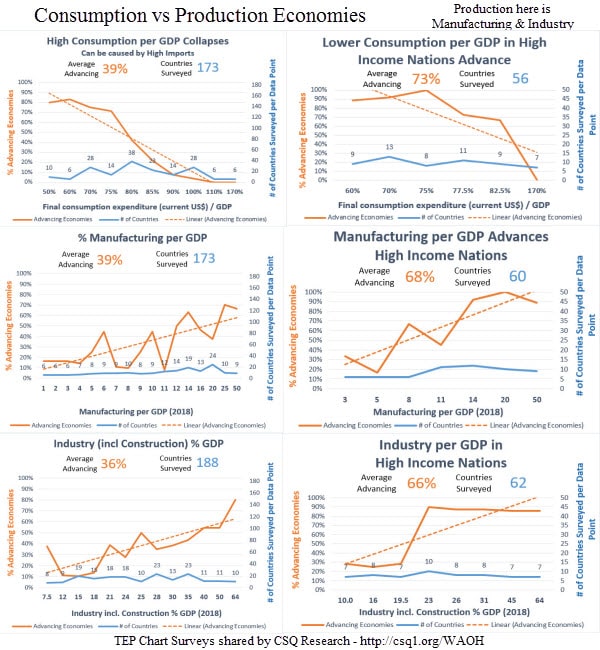
Production Economies are Sustainable and it’s important to keep Consumption lower
See also Consumption
Productivity
The best measures of National Productivity are Social Contract Product (SCP), Social Contract Loss per Capita, and GDP Growth (%GDP) 10-Year Moving Average
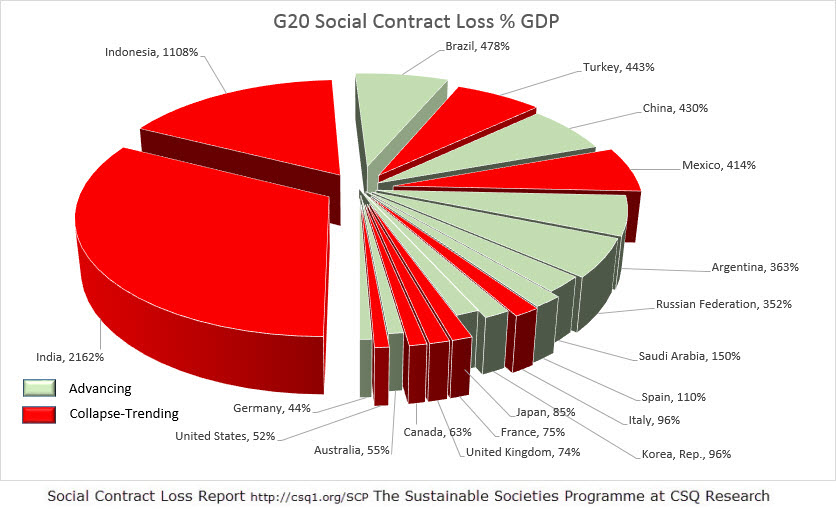
Social Contract Loss as a %GDP

Right Plans
Based on Aristotle’s Politic, “Right Planning” here at WAOH is explained both nationally and globally
“The Right Plan is the one whose ends, means, practical thinking, and purposeful action result in a good life. A life full of things you need – and not necessarily a life full of things you want. With a little Luck, goods in body and soul, and by making a habit of good choices that reflect moral virtues of temperance, courage, and justice, a Good Life should be sought and found.”
National Right Plans are essential Leadership. Good Planning, with measurable and monitored targets, can build anything reliably – by Program and Civic Performance Management experts
The CSQ 100-Year Plan

CSQ Research 100-year Plan (from the book CSQ Common Sense 101) today supports three engineering Right Plans for national success and international World Peace …
WP Projects
WP Projects – a Plan that relies on the United Nations to coordinate 250 shared Dark Factory designs between 207 nations
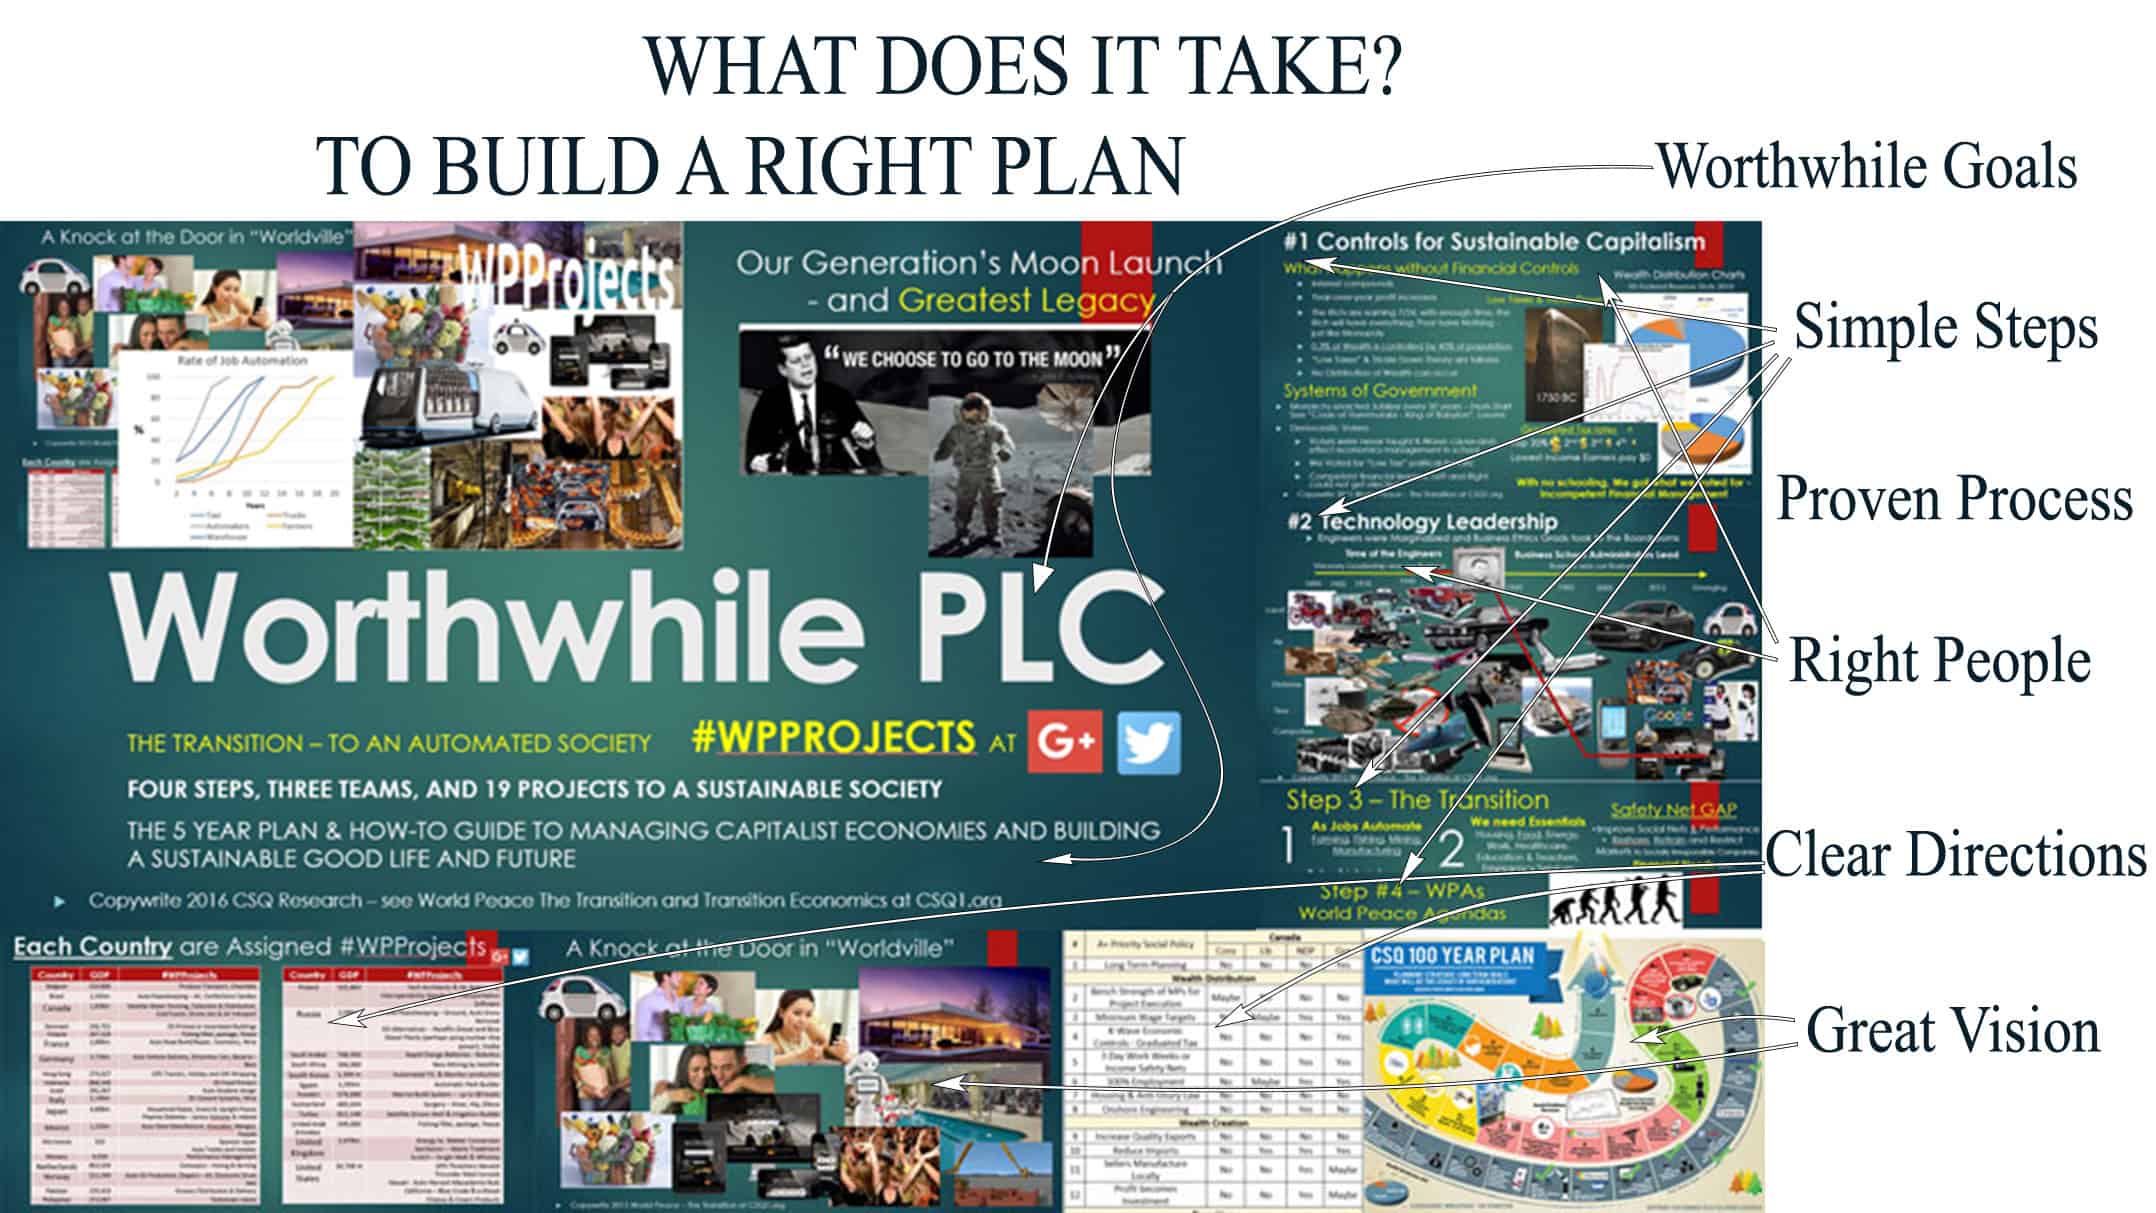
Worthwhile Industries
Worthwhile Industries – a Finance Industry-led Plan to SEED sustainable autonomous supply chains and abundance in production campuses nation by nation
SEED Automating Social Contracts & Self Sufficiency
InvestCS.com

IncestCS.com – Civic Science ETFs (stocks in 90 Stock Markets) that utilize MEMS decision support and Algorithmic Trading, to reliably Double Economies while outperforming legendary investors in every nation reliably

Feed the Right Wolf
Safety Nets
See also Hybrid Economies
Safety Nets that protect productivity and good lives despite changes in technology, automation, and business closures are essential
UBI – Universal Basic Incomes are an excellent solution for correcting the $4 billion lost daily due to low productivity by every near economy today.
Welfare programs that don’t ensure access to income (a good job with a living wage), or a good home, or insufficient financial support – collapse any nation
See also: UBI
Rent to Own – Home Ownership is an essential Human Right, so for low-income individuals who struggle to afford a down payment and other costs, rent-to-own programs must tuck aside down payments
Pride of Ownership – Many tenants who are stuck in rent or housing bubbles unable to afford their own home, go to great lengths to trash apartments or to skip paying rents. The fix is to ensure pride of ownership in all housing solutions
Safety Net programs go arm in arm with Rent Controls, Rent to Own programs, and similar. Little contribution to productivity results from implementing Safety Net UBIs or Welfares that are simply taken by gouging landlords


The Econometrics Library of
Transition Economics
Sustainable |
Agriculture
Rome fell because its cities ignored the Germanic attacks and poverty set upon by their farmers, until farms simply refused to support its cities any longer
In his first Five Year Plan in 1932, Joseph Stalin sought to control farming and agricultural exports through “collectivization”. He called “prosperous farmers”, those with a few head of livestock (mostly in Ukraine), Kulaks (well-to-do peasants) that he then named them an enemy of the people and put these farmers to work as labourers on state farms, while torturing, imprisoning, or starving to death (Holodomor) 10 million people – within a region know as the Breadbasket of Europe (citation)
Mao Zedong’s Great Leap Forward hobbled farming in favour of iron and steel production. When the three year Great Chinese Famine hit in 1959, 15 to 55 million people starved to death – from little more than government mismanagement (citation)
In short, history serves to teach us to always ensure strong farmer support, abundance, and good leadership
Big Mac
Cost-of-Living Index
The Big Mac index compares all of the costs of making and delivering a Big Mac Hamburger in McDonalds restaurants all over the world

Costs that are factored into the final price of a Big Mac include the local costs of labour, rent & building costs, cost of advertising, business profit, utilities, and so on, which are all needed to produce and sell the exact same product in every nation
Carbon Dioxide CO2
CO2 is Essential for Life on Earth
CO2 (Carbon Dioxide) is NOT a greenhouse gas in current concentrations; it is hardly at unprecedented levels, and it’s not likely heating the planet today. If it did heat the planet, however, life on earth would prosper, and CO2 is definitely NOT a pollutant
See also: Earth Temperatures
The most abundant life on Earth was supported approximately 140 million years ago in a Jurassic Era that had six times today’s CO2 levels (2,500 parts per million atmospheric CO2 compared to today’s 300-400 ppm)
Life thrived, and vegetation was much more abundant than today, supporting Brontosaurus and T-Rex on land, with Megaladons and much larger creatures as well in our oceans
Both polar ice caps melted, deserts were about what they are today, the world experienced temperatures 5-10°C (9-18°F) higher, the ocean depths were likely 8°C (14°F) warmer, and coral reefs grew 10° of latitude further north and south.
We owe our oil industry to this period as it encouraged veritable mountains of biological vegetation to live, die, and be buried so that it could be recovered today
As volcanic activity abated, the planet calmed, and atmospheric CO2 levels dropped steadily – and dramatically.

Trees Grow Much Faster at Higher Levels of CO2
CO2 is a building block of life on our planet, permitting vegetation to grow and create the oxygen that all life on Earth breathes
CO2 is, in fact, at near-record low levels – and approaching starvation levels too, at present

Dangerous Low Levels of CO2 on earth today
After reading about desertification (below) and the global warming that is created by expanding our deserts. It’s clear that we need more CO2 today, and not less
External Citation (use antivirus protections) CO2 Harvesting & Decarbonization
See also: Desertification, Earth Temperatures
… and Climate Dysphoria in Ideologies


Consumption
Consumption TEP reports explain the importance of a low Cost of Living

Consumption per GDP should be low while Consumption in $ must be not-less than $25 to $40k US per Capita as well
A Production Economy is essential and it’s also important to keep Consumption costs low
Cost of Living to Income Ratio
Wages must exceed Living Costs

Nations with higher costs of living than incomes, collapse …
Circular Economy
Environment & Life-Cycle Mgmt
A circular economy recycles and reuses its manufactured productions at their end-of-life to ensure optimal use of resources while minimizing waste costs and hazards
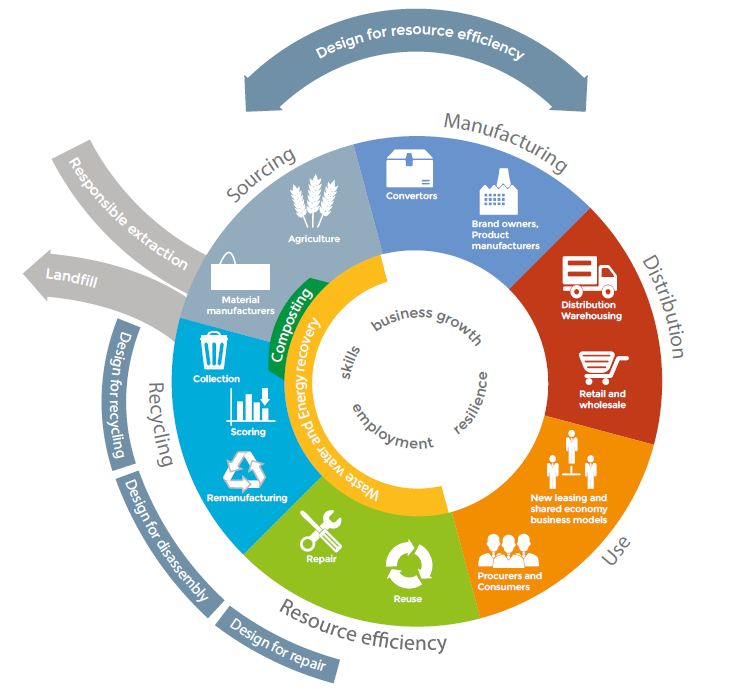
Environment Quality assured by Circular Economy Planning & Operational SOPs
Batteries, nuclear waste, linens & clothing, metals, can all be reprocessed into reusable productive products with planning and material engineering.
Foods can be composted to produce no methane and ensure fresh abundant safe food supply chains
 Credentialing
Experts
Scientists
Scientists, Experts, and Leaders are essential
We often confuse who is a scientist and an expert with who is not an expert today because we are not trained in Civics
For example: Was Thalidomide a science, or a theory? Were the chemists and marketers of Thalidomide scientists?
No – of course not, and not experts; just the opposite.
Experts are often required to take an Oath to Not Harm the Public
Engineers, Doctors, Civic Scientists, …
Is Economics a science? No – same problem. Economists are not experts and take no oath to safeguard the public, they are theorists – and the Wealth Theory that they learn and teach is fiction as well. So, NOT EXPERTS.
In Scientific Method, any proven failed theory is reclassified as “fiction”, and experts of fiction are experts of nothing in a practical. Accountants and MBAs are trained in 100% tactical bookkeeping and Wealth Theory (profit, supply and demand, scarcity, marketing, etc.). It never occurs to any of these geniuses that their efforts are collapsing 90% of the countries (48 of 54) that follow their indoctrination.
These individuals are indoctrinated, not educated, and not leaders …
An expert of fiction is an expert of nothing
The confusing bit is when an expert of a real science behaves unprofessionally or is incented for profit or other collapse motivators, etc.
(see Corruption and Collapse Motivators)
See Systemic Incentivized Collapse in Collapse Motivators
See also Certifications
Who are Experts and Leaders?
Are Civic Scientists (evidence-based data science experts) experts? Yes, because they present facts that are evidence-based AND Context-validated (truth-tested). Truthful statistics are reality, and cannot be misrepresented or used to validate nonsense (not science and not real; also called lying).
This one is an easy lesson. Do you understand how to spot an expert?
The Great Resignation
The Great Resignation is a recent phenomenon created by the appointment of non-expert non-leaders into top leadership roles and boardrooms
MBAs, CPA Accountants, and Human Resource leads are experts of nothing, and yet we have put them in charge of hiring and investment as we eliminated 20-year expert middle managers and their human capital expertise
An expert is not going to work for a junior non-expert, especially one who is trained in proven-false tactical Wealth Theory and a half-dozen dozen other harmful idelogies. And, a 30-year-old “boss”, is going to look at expert leaders who have a lifetime of experience and human capital learning – as “inflexible”, “too expensive”, and intimidating. We forfeit leadership and common sense in our human resource hiring today, so business no longer builds strong economies nor businesses – and it tears both down instead
Experts must lead
Universities are not credentialing experts today:
- Far more degrees are – 75%?: non-expert Civic Faculties Grads and Certifications – Law, Business, Finance, Economics, Government, Social Civics
- Far fewer – 25%?: expert engineers, computer and science leads
- Low testosterone – 60% of students are female and 60% of males drop out of 4-year degrees across North America
- No Credentialing is available for the human capital experts who created the computing environments that our societies run on and are absolutely dependent upon, today
Citation: Notice to Academic Institutions
National Leadership Sciences Dashboard
By the stats, Academics today are low-testosterone memorizers, and lifelong followers, without the ability to introspect – aka Not leaders!
Every CNIB dog recognizes when they are presented with a false reality because they are “mirror tested” for this ability as a puppy. A majority of Academics appear to not recognize when they are presented with false training
The problem is correctable, like every problem, but has gotten only worse with recent “Woke” political grasping and indoctrination campaigns
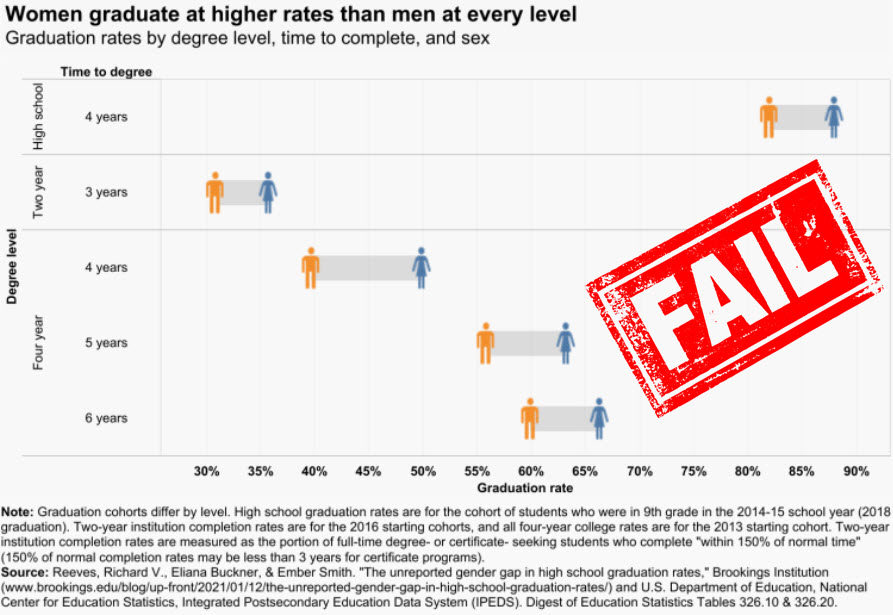
Graduates by Gender – A Failing Grade for Universities and Colleges
Credit (%GDP)
The availability of credit to the Private Sector is important as it permits small business and monetizable production
Culture
Culture is important and must be preserved by every nation
See Cultural Replacement and Immigration
A recent example of cultural vandalism was Canada’s abolishment of “Merry Christmas” in seasonal advertising and government correspondence
“Christ” is not a man’s name, it means “anointing with oil”, a practice of all Abrahamic Religions, and even more so with the Christian communities that introduced land titling systems and European development to North America
Christians use oil in seven sacraments where Muslims anoint with oil in one and Jews anoint in two sacraments

- Switzerland has its Lederhosen
- Greeks are fighters who break plates
- France has its Architecture
- Italy has its Art and fast cars
- Honnukkah – Judaism celebration since 165 BC
- Christmas – celebrated since 366 AD
- EID – celebrated by Muslims since 622 AD
- Thanksgiving – American Harvest celebration since 1789
- Kwanzaa – American 1966 celebration per African harvest festivals
Desertification
Desertication is the process of turning viable Airable land – into deserts
De-desertification – reverses this process

CO2 (Carbon Dioxide) is an essential building block of life on this planet
… and we are at record low levels of CO2 in our atmostphere today
Trees Grow Much Faster at Higher Levels of CO2
These low levels (of CO2) are creating deserts worldwide – in a process called
“Desertification”
No science supports Carbon’s condemnation. CO2 is not a greenhouse gas, rather it creates forests and reverses the deserts and drylands that actually do warm the planet
The Sahara Desert is 31% of the African Continent, and growing at a rate of 1% per year. 1% in this example, is a land area the size of the US state of Delaware
Its both ironic, and also misleading and criminal, that Carbon Tax Programs actually create Global Warming
This chart explains current Dangerously Low Levels of CO2 on earth today
Vegetation – CO2 Fertilization
CO2 Cools the Planet by eliminating deserts – see CO2 Fertilization
Vegetation Creates Oxygen
Dinosaurs, for example, lived on a much warmer earth 100-million years ago – that was rich with vegetation, and at 3 to 4 times higher CO2 levels than today also
In the past 400 million years, there have been four Ice Ages with much higher CO2 levels as well
Deserts – will form reliably when CO2 levels fall to a point insufficient to support plant life
Climate Misinformation
Woke Search Engines and A.I. GPTs
Climate Dysphoria – is the result of a funded Globalist campaign to confuse voters into voting for harmful ideologies parties (False Idols). These groups create one nonsense crisis after another – with unimportant solutions, that allow them to bring unscientific misinformation into our media and into our schools
Do a Google or Bing search on “Desertification”, or use an A.I. GPT. The first articles you read will not mention CO2 at all. The articles here explain only “WOKE Agenda” articles embracing CO2’s global warming entirely. Only articles located further down the search will explain CO2 Fertilization
The world needs more CO2 – to reduce the temperature of the planet through de-desertification, and to sustain all life on this planet as well
… and we could do with a lot less Misinformation and Indoctrination at the same time
External Citation (use antivirus protections) CO2 Harvesting & Decarbonization
See also: CO2 and Indoctrination and Miseducation
Digital Currency
CBDC – Central Bank Digital Currency
Digital Currency is the only capital, currency, or money assigned to WAOH’s Unsustainable designation. This is not because it is a bad form of currency, rather this designation is assigned due to its easy manipulation for population control and collapse in today’s 90% collapsing large democracies. See Democracies

See BRICS to understand how they are better able to benefit from a Digital Currency and Infrastructure
90% of large democracies are collapsing today while the average economy loses $4 billion daily at 1930s levels of production growth, so career politicians in business-funded Right and Left political groups are the least likely to train in Civic Science and are unqualified to design monetary systems that work toward sustainable advance
Like every monetary system, Central Bank Digital Currency has its unique PROs and CONs
PROs
A Digital Currency:
- Can be timed out. Today, trillions of dollars are stored in offshore banks by corporations every year, and a CBDC could return that uncirculated currency back into circulation within the economy – which could be a very productive benefit
- Could eliminate unproductive banks
Banks are parasites by nature – and are only a benefit when they create and assist production, but internationally the world and most countries are at 1930s levels of production growth – due to Central Bank Policies like recent “Bank Risk Strategies” that protect private banks with:
- trillion dollar bailouts
- extreme trickledown regulations
- Banks are parasites on a monetary system to start with and
- Further “Risk Protections” can hobble economic production and national growth severely
FYI – a bank that doesn’t benefit monetizable national Production should be closed regardless of size, employees, etc. Their resources are digging a grave for the entire nation.
CONs
Digital Currency devalues national currency (on the FOREX Foreign Currency Exchange) and can be programmed to:
- Expire for citizens and retirees who still need their money
- Work only for certain products (basic, luxury, real estate, etc.)
- Work only in a geographical location
- Prevent wealth accumulation
- Work only with an artificial budget – like a carbon budget
- Expire with speech and political or ideology alignment
- Deduct tax instantly
- Become a totalitarian government’s wet dream
Education
Education – is entirely Evidence-based and Context-qualified Truth and Reality
Indoctrination – trains us in fiction; proven-failed theory and harmful ideology
The Bible has taught this essential Civics Lesson to illiterate populations for thousands of years. Its summary of this MOST important lesson and warning is the FIRST Commandment:
“Accept no alternate utopic definitions of Good; no Other Gods”
Indoctrination
Education – is entirely Evidence-based and Context-qualified Truth and Reality, problem solving, and critical thinking.
Indoctrination – trains us to memorize fiction; proven-failed theory and harmful ideology

The education system is broken by design.
It rewards obedience, not intelligence.
From a young age, children are punished for asking questions and praised for memorizing useless information.
Children are taught to memorize by rote, without even being taught memorization techniques – like memory pegs …

Read more here
See also:
Our Academic Mediocracy
Education Reform – The Doctors of Indoctrination
Education Reform
Training in scientific, strategic Civics is essential to any society – in Economics, Government Policy, Law, Finance, Education, Social Studies, and Business
Our case study on Education Reform discovered SHOCKING problems that mandate immediate correction
In North America today:
- 60% of males drop out of four-year bachelor’s degree programs – citation Brookings Institute, see 1 2
- Academic Empire Building – 3-year degrees became 4 years, 6 and 9-month Masters programs became 2 years, an affordable 2-year Registered Nurse program became an expensive 4-year university degree, and a 1-year Teachers College became 2 years
- Community Colleges – replaced Apprenticeships and offloaded training obligations to students, governments, and taxpayers, without giving students degrees
- Certification Programs – could be lied about and purchased offshore by sleezy 22,000 immigration consulting agencies. HR and MBA had no idea of employee qualifications
- Dumbdown – Multinational Businesses could terminate experts and hire a DEI “fit” (follower) with unqualified HR and MBA staff, at half the previous salary and with no pensions
- Males and Masculinity(testosterone), leadership, and sustainable essential family values were toxic, incorrectly called religion, old-fashioned, and targeted to fail, expelled, or pressured out
- Grad Schools accepted only followers and rote memorizers. They stopped new science, data science, leaders, builders, doers, and experts (human capital learned through career experience)
- Anti-leadership, anti-merit, anti-male, anti-expert, anti-science, theory, harmful ideologies, “ISM”s, and indoctrinations
- Indoctrinations are taught instead of education ROUTINELY
- 75% of all degrees taught no strategy, leadership, nor science (no reality) at all; curricula taught 100% tactical theory and ideology
- 90% of investment and corporate board decision makers (MBAs, Accountants, HR, Finance, Law, teachers, etc.) were taught proven-failed, tactical Wealth Theory (1920s GOP Profit-First Ideology), Feminism, Wealth Theory Economics, Neoliberalism, Libertarianism, Race and Gender Theory exclusively
- Students are taught that fiction and ideology are real (Right, Left, Feminism, Micro/Macroeconomics, Marxism, Theoretical Maths, and Modeling) – and are important
- No Collapse – students are taught nothing whatsoever of evidence-based science in civics, nor expensive, dangerous, preventable, and correctable collapse
- The proven-successful Bible is not explained as our oldest scientific-by-observation civics textbook, Constitution, Bill of Rights, and Book of Law. Universities dismiss it as religious, outdated, and irrelevant
- 60% of university admissions are female, spurning the importance of family values and single-income households that are essential to sustainable fertility, populations, and culture
- 90% of large democracies are collapsing – including Canada, USA, Mexico, France, Britain, and 62% of all nations internationally, due to civic miseducations in our Western schools
- Empowered oddballs and extremism theories to dictate the behaviour of all members of society, often Lying blatantly about Human Rights, gender, and race theories
Citation: Notice to Institutions
Education Methods
Education Methods are:
Mastery-based learning ensures that all pupils have mastered key concepts before moving on to the next topic – as we see in employer-paid apprenticeships
Memory-based, Rote Memorization training advances students with just a percentage of retained instructions and is far less valuable. This approach leaves pupils with gaps and misunderstandings that widen with each passing year of training
Lower testosterone females are going to have more patience to memorize (by rote) the directions of others, while intelligent males with 10 times higher testosterone levels will be less patient and realize that they can problem solve as well as the book’s author did – more times than not
Today, tools like Google, Alexa, and Bing search, online Libraries, and Drives, afford instant access to reference information, making our reliance on memorization far less important than when we once had to carry all learning with us at all times. It is also important to rely on reference journals for all building and engineering standards, as standards are subject to change with new learnings in the profession, or with software updates that frequently change how things work
Evidence-based teaching – All education must teach observable reality when explaining that something is real. Aristotle’s Scientific Method explains this carefully and explains its import to academic curricula too. Economics is an example of proven-false theory (fiction) that is taught as real today. Right, Left? Nonsense (non-science) and definitely not real
Belief-based teaching – Belief-based teachings must always be provable in evidence-based science. Today universities teach students that proven-failed theory is real, that Right and Left, Gender Theory and Feminism are real and important things, and that Micro and Macroeconomics Wealth theory is not a proven-false theory only as well. These are all examples of harmful ideologies and indoctrination, taught in our Western Universities as real, and are neither real nor education
Theory-based teaching. Theory is Fiction, so a Theory should never be confused for, nor taught as “reality” or important.
FYI – The way that Scientific Method works is that a Theory is entirely fiction until it is proven to be real and observable by anyone, anywhere, and at any time.
When a theory is proven real, it becomes science and is no longer a theory. Any notion, therefore, that Theory can linger for decades unproven or unprovable – but is nonetheless real, important, or inevitable, is pure nonsense (non-science) – and Indoctrination.
Science is Reality and Truth
Education versus Indoctrination – Science is essential because it educates students on truth and reality – in their curricula.
To understand this learning better, consider the example of Thalidomide. Thalidomide was a theory – that was called real and was called science, that was marketed to doctors and then prescribed to pregnant women to ease morning sickness. When wide birth defects resulted, the drug was banned for the public’s safety.
Was Thalidomide a science? No. Were the company and its chemists who sold the drug scientists? No. Did the company’s chemists go on to produce science at a later time? Maybe.
Belief-based Civics is important also
The Bible – is not religion, it’s not theory-based, its scientific and based on observation. So why is the Bible’s belief-based approach to teaching civic’s lessons learned important too? Consider …
The Bible taught illiterate and superstitious populations real, observed lessons learned in 2,000 years of civic rise and fall, through storytelling – with teaching tools.
Its characters eased the suffering of the sick, elderly, and eased the suffering of mortal parents who lost children and family. Instead of a new mother or couple being blamed for the death of their child, it was “God’s will” that the baby was called first. An afterlife built stronger armies, while it comforted grieving parents and assured good behaviour monitored by an omnipotent all-seeing deity.
The Bible afforded people forgiveness for past life sins (harmful acts) with baptism and confession. These were lies – but important, well-intentioned lessons to a one, taught to simple minds in support of creating a good, problem coping and solving, strong society.
“If God did not exist, it would be necessary to invent Him” – Voltaire
The Bible also taught us that harmful ideologies are “alternate Gods”, that their “false idols” (Swastikas and Pride Flags) should be avoided, and that economic powers are “the beast” or the devil.
These lessons protected simple populations from lying and collapse, just as they should have protected us this past 10-years. This also explains why Constitutions with no protections from “other Gods” (lying and corruption) fail their countries, and it explains why harmful ideologies will always try to paint the Bible as outdated and irrelevant.
Gender Differences
See also: Education
Immersion Training
Men – are protectors and providers, who have 10 times higher testosterone levels than women. Intellects are similar in men and women, but men learn best by learning and then doing. They are placed in a new setting with some training and use their new language or other learned skills in real-world settings to solve real-world problems. Four years of mostly valueless courses and exams are unlikely to interest men, and a 60% baccalaureate drop-out rate confirms this.
Women – have an easier time concentrating and learning from books and classroom lessons, in part because healthy
When young men and women share a classroom in their biologically prime mating years (age 15 to 19), young men are going to be distracted by young women. Accommodation for this reality IS necessary to protect education for men who must spend their lives in a career to support sustainable national fertility rates in families and at home.
For example, I took 8 years of French classes, and yet I could not put together a coherent answer to a French question at the board. Within 7 days of complete immersion in Paris, I could speak and read French fluently. My life depended on learning French (for food and accommodation), and I could concentrate on the language fully until I began dreaming in French within 4 or 5 days
Math, Modeling, and Peer Review ![]() : IS NOT SCIENCE and not true until ALL underlying theories are proven real and true. Math is often used in Peer Reviews (academic validation reports) to legitimize underlying proven-false theory. The Math is right, so the underlying claims can be ignored or lumped in as true – usually in an attempt to validate the claims of a consensus of theorists or a financial sponsor, bursary, or benefactor. See also Replication Crisis
: IS NOT SCIENCE and not true until ALL underlying theories are proven real and true. Math is often used in Peer Reviews (academic validation reports) to legitimize underlying proven-false theory. The Math is right, so the underlying claims can be ignored or lumped in as true – usually in an attempt to validate the claims of a consensus of theorists or a financial sponsor, bursary, or benefactor. See also Replication Crisis
Male versus Female Education
Young healthy male students should have testosterone levels ten times those of their female counterparts with masculine leaders as role models and teachers too. It’s important to realize that attention span is going to be impacted by higher testosterone levels and men will also want to learn by leading and by doing, and not simply by following someone else’s scripts, ideologies, and theories
All Civics classes teach proven nonsense, so a smart young male is going to question this curriculum and can easily introspect to find that the curricula is also collapsing societies and economies routinely today – by using evidence-based science resources like WAOH. Questioning curricula is a great way to have professors throw you out of programs – and credentialing. “Following”, and not questioning the evidence of lesson failings, is strictly enforced by all levels of academic credentialing and career progression today
Correcting Education Problems
Theory and Memory-training dominate today
 Unscientific maths and modeling are unnecessary for 99.9% of careers and hide untrue theories and ideologies
- Theory-based curricula have replaced scientific evidence-based training (see swimlanes above)
- Education creates a national dumb-down because 75% of faculties teach no science (no reality). This leaves society with only unqualified, non-expert grads – who do not question instructions or monitor national performance, to be hired to leadership roles and investment boards that will harm our society for their entire careers. Accountants, MBAs, lawyers, and political science grads are obvious examples.

Academia has today created consistent national collapse because unqualified “memorizers of failed theory” now sit on boards and parliaments and make very poor decisions for entire nations
See also:
Miseducation and Indoctrination
Education Reform
Doctors of Indoctrination
Teachers
Teachers have much to attone for today. Gender Dysphoria, tampons in mensrooms, boys in girls change rooms, a 60% drop out rate for males in degree programs, a national fertility genocide created by feminism and female equality indoctrination from age 5 and up
25% of our grads take oaths to not harm the public, while 75% (including teachers) will only harm the public for their entire careers
Education Costs, Spending, and Free Education
We see that nations offering free education advance more consistently than other nations, but this formal study is still pending
See article 90% of Large Democracies are Collapsing
Country |
Tuitions |
| Nominal fees | |
| Austria | EU-dependent |
| Bahrain | Public Universities are Free |
| Belgium | EU-dependent |
| Brazil | Language dependent |
| Brunei | Free |
| Cuba | Standard (med exempted) |
| Czech Republic | Language dependent |
| Denmark | EU-dependent |
| Egypt | Standard |
| Estonia | Nominal fees |
| Fiji | Standard |
| Finland | EU- & Lang-dep. |
| France | EU-dependent |
| Germany | Free |
| Greece | EU-dependent |
| Iceland | Free |
| India | Nominal fees |
| Iran | Free w obligation |
| Italy | EU-dependent |
| Jordan | Free |
| Kenya | Free |
| Kuwait | Free |
| Lebanon | Nominal fees |
| Luxembourg | Nominal fees |
| Malta | EU-dependent |
| Mauritius | Standard |
| Mexico | Standard |
| Morocco | Standard |
| New Zealand | Standard |
| Norway | Free |
| Oman | Free – EU/EEA |
| Panama | Free |
| Philippines | Standard |
| Poland | Nominal fees |
| Qatar | Free |
| Russia | Limited |
| Saudi Arabia | Free |
| Slovenia | EU-dependent |
| Spain | EU-dependent |
| Sri Lanka | Standard |
| Sweden | EU-dependent |
| Taiwan | Nominal fees |
| Trinidad and Tobago | Standard |
| Turkey | Nominal fees |
| UAE | Free |
| Uruguay | Standard |
See more survey detail here
Also, see our Constitution Study by Country here
Education Governance
The United Nation’s Education Index is far too simple presently, merely counting the number of years in a classroom per student only
WAOH and CS-BOK (The Civic Science Book of Knowledge) build National Civic Leadership Faculties (see Scientific Societies Programs) – to performance manage the social contribution of our educational institutions. Without this, large democratic nations build headless snakes that cannot easily insist that schools are a value to host nations
TASK awaits funding to improve these statistics, so please consider a Donation – and Government Funding as well
International TASK Programs
Education Reforms cannot come fast enough, as mentioned above – citation Notice to Academic Institutions
TASK Academic Challenge
CSQ Research’s TASK Challenge reintroduces science (reality) to university programs taken over by theory and ideology in collapsing nations
The TASK Program ranks schools in every nation by scientific performance-managed measures. If a nation is collapsing – and we realize that a nation’s (mis?)leadership can advance or collapse this 100%, universities in that country must teach neither advance nor good leadership – because their country is collapsing
Groups like Harvard, Yale, and Stanford enjoy massive marketing budgets to convince us of their superior education system, while their country is falling apart hidden from local view and correction

TASK ensures that Academic Curriculums teach Science – and not the theory and ideology-based curricula that collapse so many nations today
TASK fixes Education
Since the 1980s, Western schools have systemically turned to indoctrination for curricula rather than education; turned to Wealth Theory, Gender Theory, and Race Theory – and away from core intellect and knowledge-building curricula
75% of university graduates will harm society throughout their entire working careers and voting lives, read about our Education Reform needs above and at WAOH
Music
Cerebral plasticity and intelligence are created at a young age and built upon for a lifetime
By denying children music lessons, responsible civic science, and exposure to languages as seen in European classrooms, and then we replaced this essential curriculum with harmful ideology as well
We dumbed down our greatest resource –
Our People!
ABC + Do-Re-Me
Language
European students learn 3 languages.
In North America, Greek and Latin were taught to all students, in addition to a local language – until just 80 years ago
Civics and Civic Science
Today, our schools don’t teach:
- Memory techniques – like Memory Pegs
- Music – playing and composition
- Project, Change, and Performance Management
- Civics Data Science and Civic Sciences like Transition Economics – Good Values, Home, Family, Community, Country Building, and Human Advance
- The Importance of Experts, Human Capital, Experience, Merit, Genius, and Contribution (Heavy Lifters)
- Relaxation techniques – facilitated meditation and hypnosis
- Programming, automation, and trading
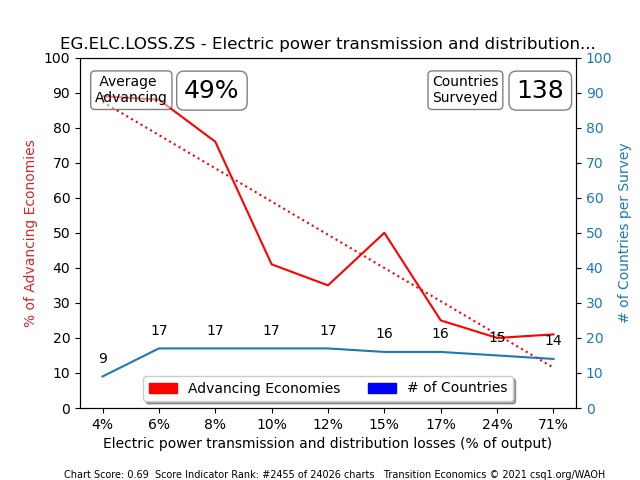
Energy – Fuel
Diesel Prices at the Pump
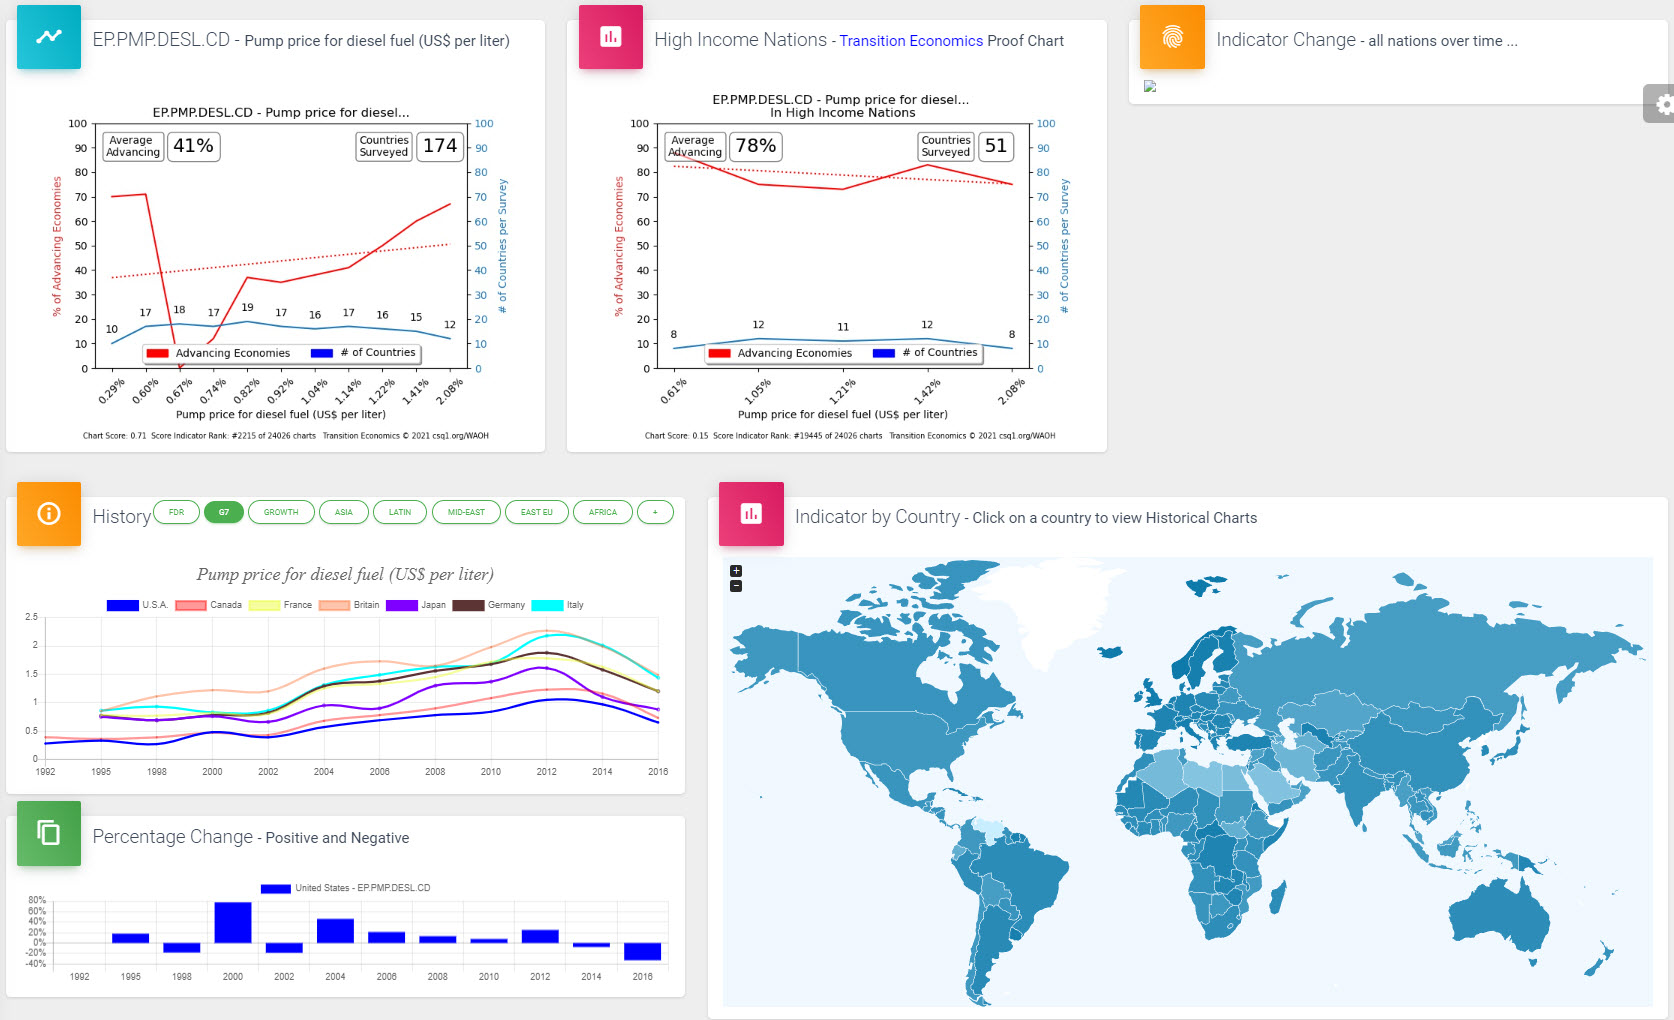
Diesel Fuel Prices by Country – Highest is darker
External Governance
United Nations
EU (European Union) and EC (European Commission)
NATO
Globalism
Consultancies
The EU was a fine idea as a shared currency and infrastructure/healthcare consultancy, but consultancies are not owners and never should be.
The United Nations worked with 250 countries and principalities, so their consultancy capabilities far exceed those of most single nations. This makes their Consultancy valuable when that consultancy is truthful and valuable.
Boston Consulting and McKinsey counsel Criminal Legislatures, Depopulation (Female Equality and Infertility), and Election Fraud Immigration – as an example of Consultancies that should be distanced widely by any nation.
Using Project Management’s RACI terminology, the R – Responsible – has to always be the country, A – Approver is again each country, C – Consulted can be the EU or United Nations, and I – Informed – can be the EU or UN again.
Think of a close family friend helping a loved one in estate planning, the friend must only be there for advice and moral support, while decision-making must always be kept for the individual and their family.
European Commission and NATO have assumed Responsible and Approver roles in recent years, which created wars, globalism, harmful ideology, indoctrination, and wide financial and social collapse (See Civic Science).
Family and Family Values
Core, Two-Parent, Single Income Families – with a Head of Household, Pensions, Living Wages, and a Home, are essential building blocks of any sustainable population, community and nation
Notice how family shows are no longer aired in WEF-influenced nations


When families are presented in a woke or indoctrinated community, there will be female leads, women will be leaders and strong while men are followers and weak, divorce, single parents, working mothers, mixed racial marriages and relationships, and utility (non-core) familes will be showcased – as a theme
Political campaigns that encourage “Division by Gender”, indoctrinate girls from a young age into harmful and sociopathic anti-family-values theories – for Power (for votes, to win elections)
“Girl Power” Female Equality election campaigns win power in 64 high-income democracies where nations lose 1.5% of their population annually. This is the same rate of population loss as European nations in WWII. It takes 2.5 children per woman to sustain any population, and generations are lost when these fertility shortfalls are ignored
Once in power, these often globalist-organization-sponsored “feminist” political groups boost harmful immigration (to hide population loss) and install laws that make local males the last possibility to hire, grant, or accept for credentialing programs (see Canada’s Bill 25 as an example)
Divorces soar, male suicide and then broader suicides follow, family pensions are forfeited to diversity and inclusion laws, and families are decimated nationally
Leaders and leadership are lost, businesses and governments are dumbed down and devalued, and wide social and economic collapses begin, as inflation, ideological hate laws, etc., can now thrive
Emancipation/Sufferage/ The Female Vote – The Female Vote appears to be the most easily coerced group targeted by these campaigns, propaganda, and indoctrination
Every nation must guarantee that living wage incomes and homes are available to a family and head of household, to sustain its population (sustainable birthrates), culture, and good lives

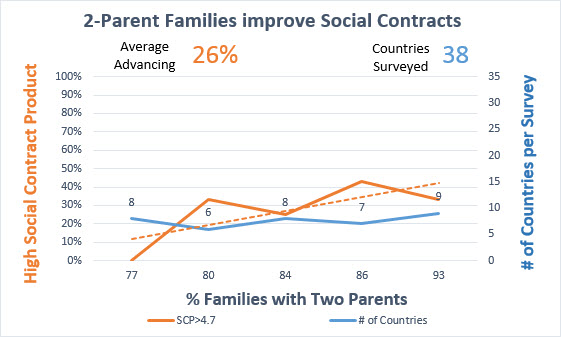
Males commit suicide at a rate of .79% for every 1% of unemployment
Suicide is:
The #1 Cause of Death under Age 35
The #1 Cause of Death for Men under Age 50
The Male to Female Rates increased 11% in Canada, 19% in USA, after DEI laws, hiring, lending, grants, etc., programs started in 2015
These numbers are based on “WHO estimated*” statistics, which exclude Drug Overdose / Poisoning suicides

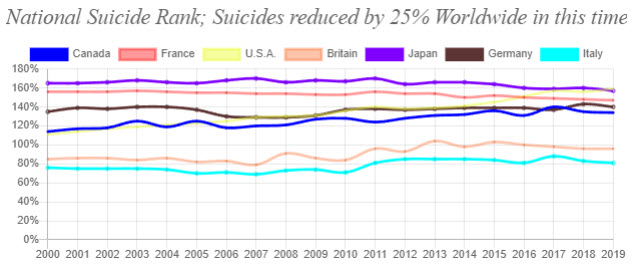
Citation: Gender Equality Genocide
Encourage: Single Income Families, Core Families, Right to Living Wages, Right to a good Home, Heads of Household, Sustainable Fertility Rates, Gender Respect, Heterosexual Lifestyles (for pre-teens)
Avoid: Double Income Families, Utility Families, High Divorce Rates, Unsustainable Fertility (less-than 2.2), Gender Equality (creates national genocides), LGBT (for pre-teens)
See also: Marriage
The Female Vote
See also Fertility
Abortion
Family Values
Sufferage – was a movement aimed at giving women the vote. The vote was granted to women for the first time in history in Western nations just 100 years ago
Every policy has to be reconsidered when its cost to society is too high, and the net cost of the Female Vote has been nothing short of a wholesale Collapse and Crime against Humanity in 64 high-income nations over the past 30-years
In fairness, males support harmful right-wing indoctrinations including wealth theory, gun dysphoria, and libertarianism. Populations get lazy and choose to believe nonsense Libertarian campaigns – like an Archie Bunker Theme song.
“Those Were the Days” was a satirical song composed in an era that wouldn’t vote GOP for 25-years after Herbert Hoover starved millions of Americans to death in the Great Depression.
The Female Vote appears first to support harmful ideology, national fertility genocides, national male suicide policies, transgender and homosexuality programs, and every harmful policy used by globalist virtue signaling woke or “ism” policies that are routinely used to collapse nations.
Solutions
Good Values – Must be taught from toddler ages to retirement: Good, Respect, Human Advance
Respect of women for the vital roles they play in any human society must be a priority, just as men must be respected as protectors and providers.
Civic Science – Training for voters and Certifications & Monitoring for Political Groups must ensure reliable advance in our societies, especially in primarily collapsing large democracies
Gullibility and irresponsible voting – has consequences. Voters cannot place individuals into positions of power, simply because voters find them “pretty” or tell them anything that a misdirected voter might like to hear. Once in power, a nefarious politician can use their election-won power to deny voters basic civics training and to instead indoctrinate their parents and their children with harmful ideology propaganda in multi-billion dollar media campaigns – paid for by public money

Rescinding the Female Vote – This sounds just as ridiculous today as it did when giving the vote to women 100 years ago. Change happened then, and change can happen now – and it must happen if this is required to correct the wide collapse in 64 high-income societies today.
Collapse is expensive and its dangerous. When our electoral processes fail to protect Human Advance, they are no longer valuable to any nation
FDI Outflows
Foreign Direct Investment (FDI) Outflows are a very good thing, while FDI Inflows are not a benefit
Canada’s recent $15 billion commitment to German Government-owned VW Volkswagon to build EVs and Batteries – was a bad deal for Canada, and a good deal for Germany
This bad deal was made worse when VW was revealed to be the most indebted car company in history, and it was laying off EV workers in its plants all over the world

Fertility Rates
The Greatest Cull of Human Life in History
90 million infants lost annually. That incredible number is the infants lost to harmful ideologies and leaderships today. Even if we don’t count the 47 million loss in the world’s most populous nations China and India, the cost of Feminism to Western cultures is staggering – equal to the losses experienced in World War II every single year
Sustainable Fertility Rates (Birthrates) are essential to culture, language, and population. A rate of 2.5 children per woman is break-even – and this is the reason the Bible instructed Family Values, homes, and incomes as a human right for every member of any population
Why 2.5? 2.5 Children per Woman is considered the minimum level for any sustainable population because:
- not every woman can have a child
- not every productive woman will choose to produce children
64 of 70 high-income nations vote for Harmful Ideology Feminism’s Female Equality campaigns, which hide the 30% population loss that they create reliably every 20-years. This Crime against Humanity is hidden from voters to gain democratically elected power from the Female Vote routinely in Western nations today
See: A Gender Equality Genocide

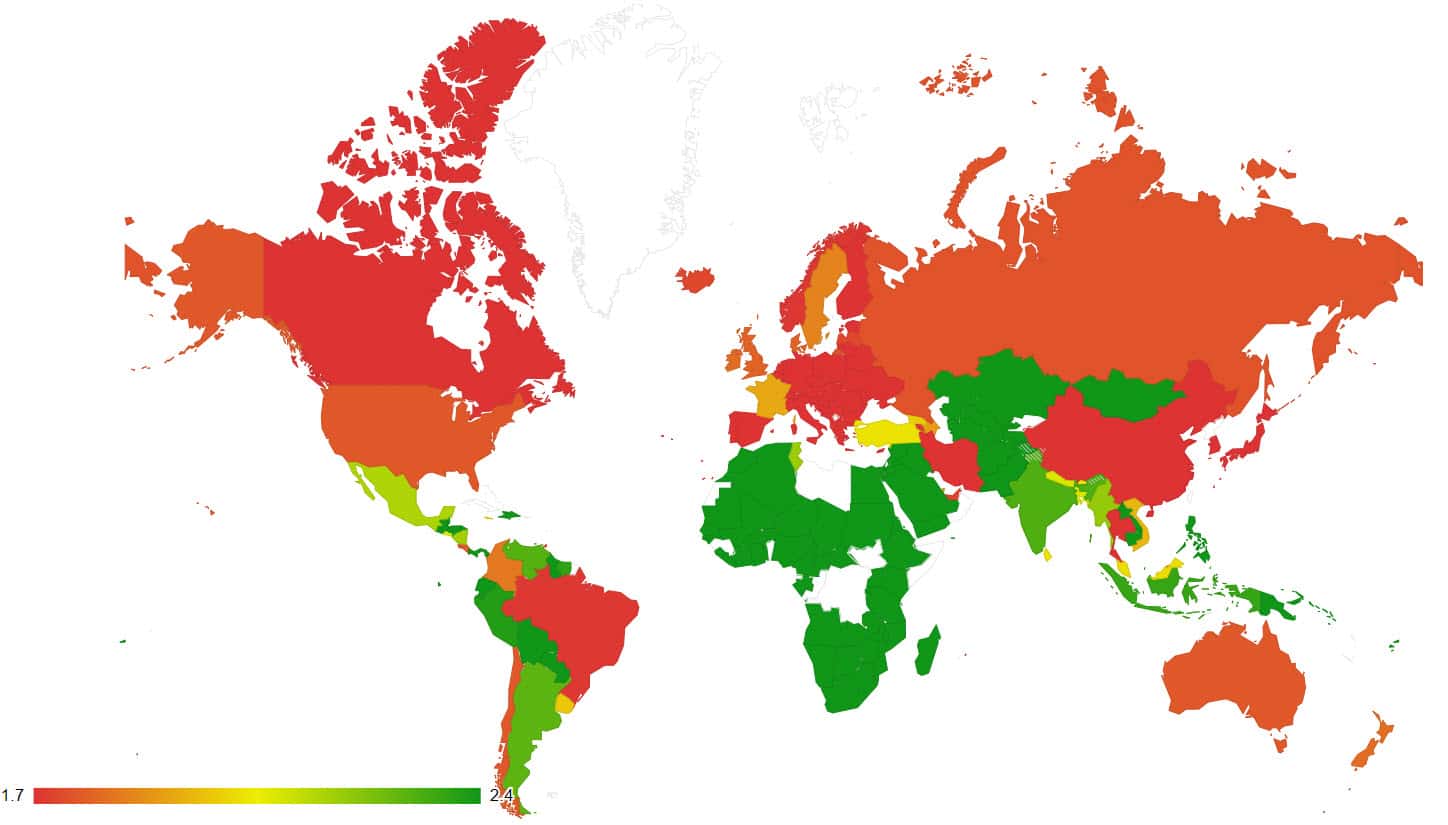
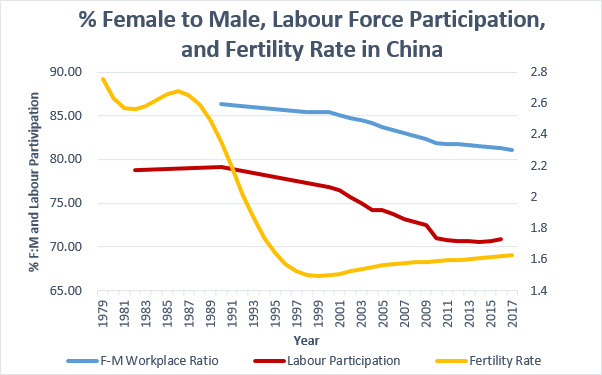
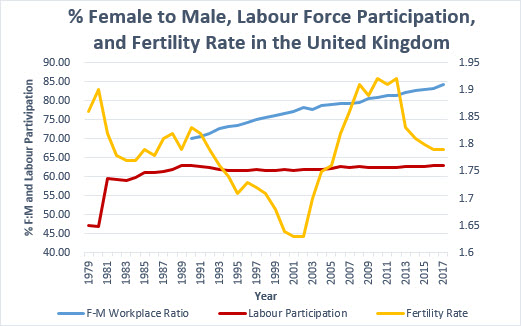
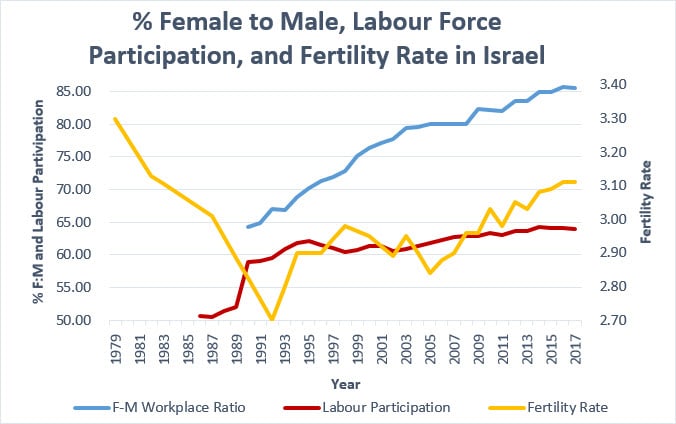

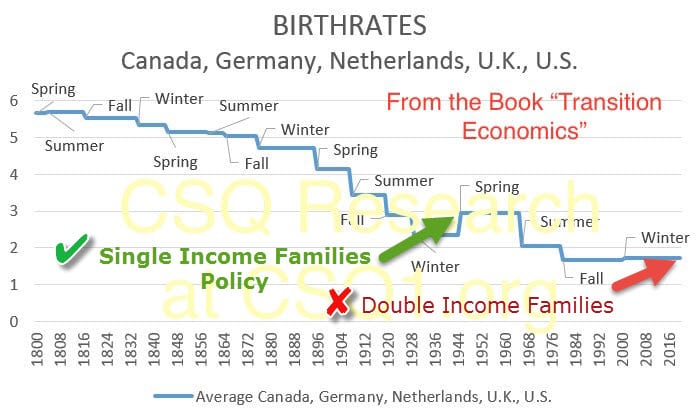
Gender Respect is a core value; NOT “Gender Equality in the Workplace”. How can a Crime against Humanity ensure good lives, families, and sustainable populations? It can not and it clearly does not.
Franklin Delano Roosevelt
FDR’s policies created the greatest economy and society in history
His Constitution went on to become the United Nation’s Universal Declaration of Human Rights which is today shared by 83 nations, and Bills of Rights were authored in most democracies to mimic it. Sadly, 90% of large democracies went on to completely ignored it.
EVERY large nation that follows FDR’s Constitution today is advancing
EVERY nation (> 15 million population) that does not, is collapsing
See ACT Parties
GDP per Capita
WAOH Data Science
- GDP is a 2,000th of 24,000 ranked report
- GDP Growth – is a 1,200 rank report
- GDP-per-Capita ranks 300th
- GDP-PPP-per-Capita – 100th rank
- Export-per-Capita – 200th Rank
- Social Contract – is a #1 Ranked measure
Gender Roles
Proven successful Family Values and Gender Roles are essential in any society. See Harmful Ideologies for a long list of indoctrinated assaults against essential gender roles, but the societies that permit human rights and gender roles are reliably successful and happier, while those that don’t collapse reliably
Discussions that are important to Gender Role research include:
Caregivers
Criminal Legislature – the manipulation of voters by gender
Diversity
ESG
Family Values
Female Vote
Fertility
Indoctrination
Good Values – Systemic Empathy, Respect, and Human Advance
Female
Human Rights are Security, in: Home Ownership, a good family income, affordable good food, education, healthcare, pensions in old age, and vacations
Population Stability: Having a larger number of women is important in any heterosexual population because each woman who is capable of childbirth must yield 2.5 children to sustain, which is why most human populations are often 52% female to 48% male. Not every woman can or will have children, so a future is only assured to nations that can maintain a human population
Women are:
Family matriarches, mothers, sisters, daughters, nieces, aunts, and Grandparents
Protectors
Providers
Wives, Home Makers, and Wives
Male
In the 1940s, a man who was not supporting a wife, his wife’s family, and children, was not considered suitable for Public Office or Senior Employment.
Men are:
Family Patriarchs, Husbands, Fathers, Sons, Brothers, Uncles, nephews, and Grand Fathers
Protectors
Providers
Family Men
Workers – outside the home and in businesses
Workers – handymen and builders inside the home
Government Spending
Government Spending has been the scapegoat of the theorist economist since the 1970s, but no evidence-based science supports that this measure influences economy
We see in the US example below that economic decline continued across 40-years of higher and lower government spending
Gross Spending
Gross spending is the sum of household final consumption expenditure (formerly private consumption), general government final consumption expenditure (formerly general government consumption), and gross capital formation (formerly gross domestic investment)
Gross spending (% of GDP) is a causal indicator that indicates that less overall spending benefits any economy (measured here based on Trade Balance – see the Gross Spending TEP Sheet link below for more reports). We see this confirmed by National Savings (%GDP) as well, so having higher national savings and living wages (private and public) is a benefit to an economy

Healthcare
The Gold Standard of healthcare performance measures is National Longevity because it cuts through all variables to determine do national spending and solutions work – or not
Healthcare Spending (% GDP-PPP)
Human Capital and Experience
- There were no university degrees in technology when the people who built the internet and intranets, created today’s infrastructure in the 1990s and 2000s. Universities could never keep up with the cost and rate of change – which now lies in the hands of uncredentialed experts
- 60% of males drop out (of four-year) bachelor degree programs, everything these people learn in career is lost today
Imports are for Trade Surplus Nations Only
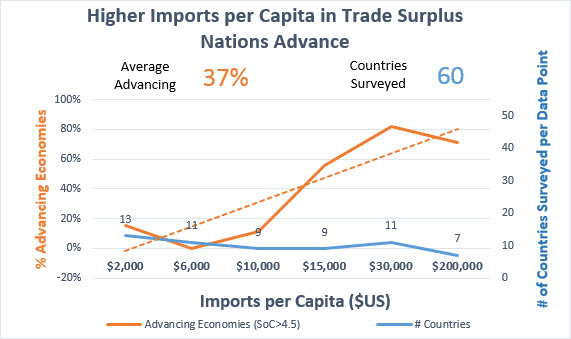
Industry
Industry and Manufacturing are the more important contributor to economy than Consumption; which is the mistake made by western theory-based Economists since Wealth Theory re-seated itself in the 1970s
Production Economy is Sustainable; Consumption Sales Economies must be actively regulated
See WAOH’s “By Industry” page for industry-by-industry detail reports
This chart shows that you definitely want to keep your nation’s Consumption Spending (per GDP) as low as possible
See Consumption
Math
Mathematics
Math is the wrong tool for Economics
Mathematics is great … at simple problems with defined inputs
Math is terrible … at understanding the trillion transactions and thousands of inputs in an economy
Why?
Consider that there are at least two ways to determine the probability of a coin toss resulting in either a Head or Tail
Method One – is to toss the coin many times and record its result (computation). A RAND Random number generator on a spreadsheet will allow this 10 times or 10 million times, and your result will usually be 50% with a 1% rate of error
Method Two is to use Math. One result (Head or Tail) divided by the two options (1/2 = 50%)
Some struggle with math’s fractions, but they are simple when you think of a physical apple pie sliced once to create two large pieces. Each person gets half, or if we think of one pie as 100%, each gets 50%, or 1 of the 2 pieces of pie
Math is a language. So, it can be used to lie or to tell the truth – even when the math itself is correct. Once you learn to understand it, math looks as normal to you as your native language
Math is NEVER truthful nor science, however, until its claims are also verifiable in the real world. This chart below proves that Economics has only created a hidden Great Depression for decades in G7 countries, and math is similarly responsible for decades of documented unproductive and false Peer Reviews and a Replication Crisis ![]() in most academic fields
in most academic fields
In Western Economics, Micro and Macroeconomics’ Wealth Theory, assumes that Capital means money and profit incorrectly. Capital is meant to describe productive assets only, like a herd of cows whose value increases through reproduction or more cows every year; or manufacturing, etc. Profit, inflation, and bubbles are not Capital
The Manhattan Project ran into this same limitation of Maths, and resorted to a computational Monte Carlo Method for reasons similar to a complex economy’s need for Transition Economics
Matrimony / Marriage
Alongside Family Values and Fertility Sustainability, comes Marriage
See also: Divorce
Many of WAOH’s fact-findings surprise Westerners who grow up believing their systems and customs are the best possible when very often this isn’t validated by evidence in the real world. Marriage is another topic that falls into this category
The most successful form of marriage in the world is Arranged Marriage because its success rates in the 90th percentile dwarf stats found in Western marriage rates
The United Nations’ focus on Female Equality has served low-income nations to reduce female violence rates, but in high-income nations, it has led to fertility genocides and harmful feminist ideologies
See: https://wbl.worldbank.org/en/all-topics
The UN ignores the fact that high-income nations share a fertility crisis equal to WWII Europe’s population losses today at 1.5% annually. These fertility genocides are often hidden by immigration that disguises unsustainable feminist indoctrination that can win “Girl Power” election campaigns consistently when females are not warned against this globalist undermining of democratic nations

Monarchy
Accountable Monarchies – and also China’s single-party government, are leading production growth over G7 nations consistently today
Monarchies have outproduced the G7 for 25 years without homelessness, with free education, free healthcare, often higher standards of living, and also without income taxes (in a couple of kingdoms like KSA and UAE)
| World Leading Production |
|
| Oil Rents |  |
| UAE |   |
| Saudi Arabia |
  |
| Kuwait | 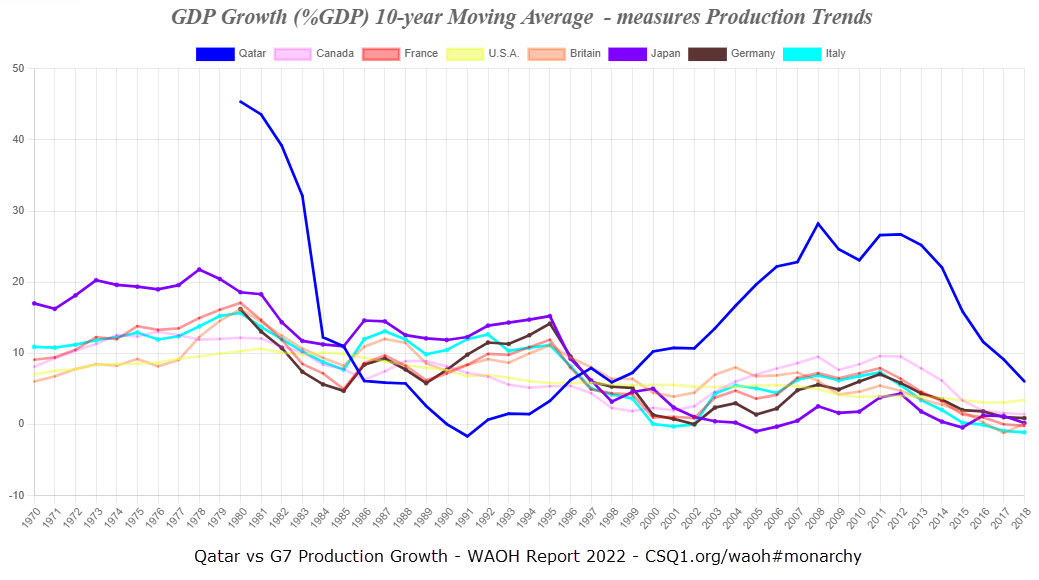  |
| Qatar |  |
| Jordan | 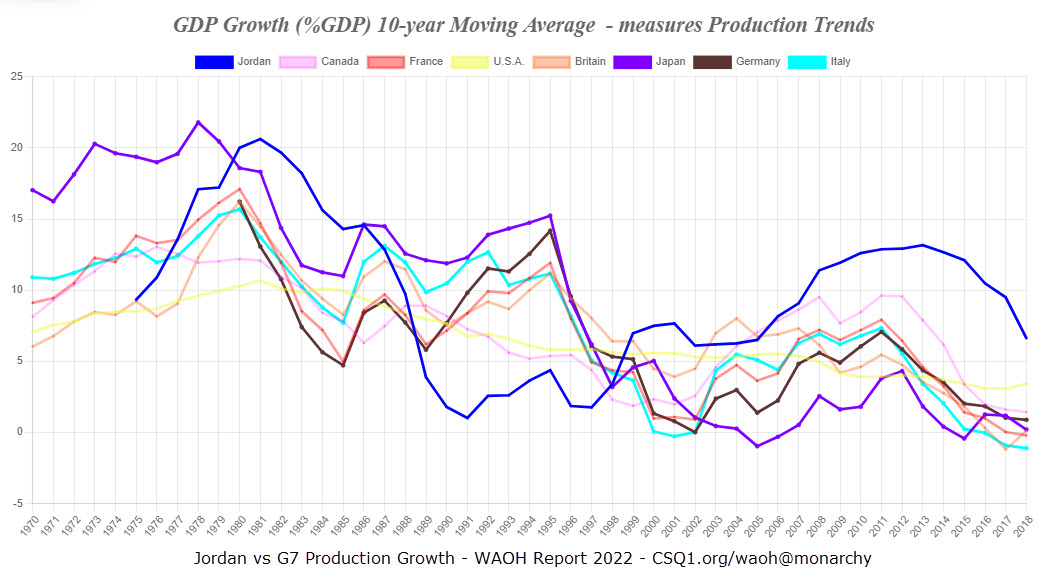  |
| Bahrain |   |
| Oman | 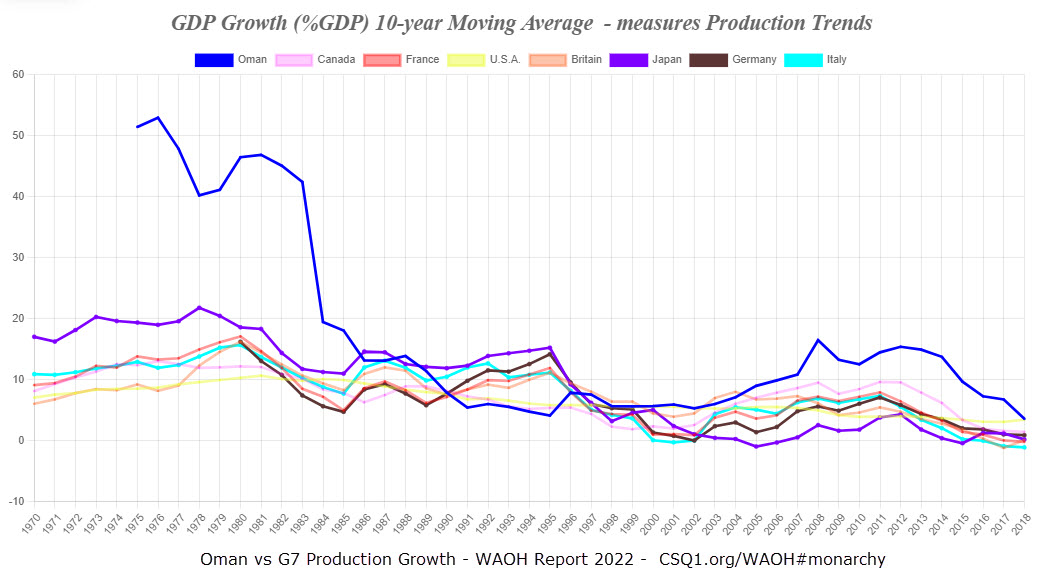 |
| Brunei Darussalam |
  |
| Eswatini |   |
Note that GDP Growth isn’t the only or best measure because GDP reports count inflation, housing bubbles, bank mortgages, business profit, sales economies, and other economically meaningless general ledger items as production
We use Wikipedia’s definition of Monarchy here, and realize that British, Spanish, Danish, and similar monarchies are in reality democracies – with all of that system of government’s problems when it comes to being unable to make needed changes and rebalancing
Nationalism
National self-sufficiency, growing wealth, population, and culture from within – is essential for every nation
FDI-Out is good; FDI-In is bad
Immigration – is only a value during boom periods when it can help bolster the monetization of abundant opportunity
Nuclear Waste
There is enough nuclear waste today, to fuel the world for the next 150 years. Citation

Today we run a very inefficient Open Fuel Process, but Closed Cycle is the way we should use Nuclear Fuel and we should be building Nuclear Energy Plants around this

Japan has been doing this for years to:
- Reduce their dependence on imported Fuel
- Conserve Uranium
- Reduce the time that used material remains radioactive – down to 200 years instead of 200,000 years
We just have to build the reactors to re-process their radioactive waste
Who is the Greatest Philosopher in the World Today?
Click here to read WAOH’s recommendation for who is the obvious Greatest Philosopher in the world today
See also Philosophy
Population Size
Population Size is an irrelevant factor in economic growth. No stats prove that a higher population does better than a low population, many other factors come into pay
Small Populations
The UAE (United Emirates) is a 43C sandbar smaller than Nova Scotia in Canada, yet its one million citizens boast an economy 1/4 that of Canada’s economy. Emiratee Citizens are the wealthiest in the world, with free healthcare, free education, no homelessness, no generational alcoholism or runaway drug abuse, a full space program, the most modern cities in the world, and they don’t abuse their children with lessons and imagery of transgender activists in classrooms. The UAE’s accountable Monarchy System is a trend-setter and notable, as are many small democracies like Denmark, Netherlands, Ireland, Scotland, and formerly New Zealand – and this list goes on and on
Large Populations
Large populations are nations with more than 20 million citizens.
Large Population Democracies are Oligarchies – where 90% are collapsing (48 of 54). See Democracy
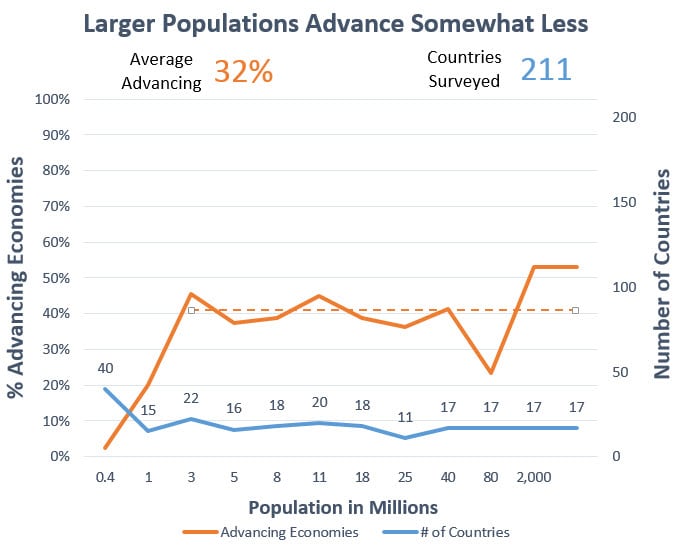
Population size is irrelevant to economic advance over 2 million citizens
The Great Replacement(s)
We have recently seen Open Border Election Fraud Immigration quietly bring an army of nationalities that can be counted on to vote exclusively – for the Political Party that invited the Election Fraud. In Canada, we see East Indians are taken 10 times more often than others, as they align with NDP and Liberal Party Great Replacement theorists.

No voter votes for these population and culture replacements obviously. These policies are being demanded by opportunistic and corrupt Political Groups once they gain power – in many Western nations today. The strategy appears coordinated by WEF World Economic Forum Business Lobby SuperPACs – seeking cheap labour and replacing “expensive” experts and pensions in the workplace.
See also: Criminal Legislatures
The practice is endorsed by the United Nations and its sponsor politicians are quick to call protest rallies and outspoken complaints about the millions of new arrivals – HATE – using their control of public money, TV Channels, and Social Media to silence protestors. It’s Election Fraud, with nothing to do with Hate. These political groups lie to voters – and also appear completely unworried about reprisals by angry citizens.
Politicians in these nations can rest easy knowing there will never be reprisals or accountability because they realize that the other elected political parties also work for the same oligarchs that employ them. Oligarchy is an evil form of government.

Scientific Societies
Science is Truth and Reality
Teaching scientific civics lessons that are proven to advance nations reliably is essential
The failure of 90% of large democracies to provide science and truth to its citizens, explains the broad collapses we see all around us today
What causes collapse, lying, and harmful ideologies (false idols) to flourish within these societies? Our teaching of theory-based and ideology-based curricula instead of science
What is Science? Science is observable fact, reality, and truth, repeatably validatible by anyone
My father altered Poe’s quote to summarize:
“Believe nothing you Hear, Believe half of what you Read, Believe everything that you See”
This is the reason that WAOH permits you to validate EVERYTHING presented here in its Libraries, for yourself
csq1.org/SSP – Scientific Societies Programmes curricula are taught by the emerging academic faculty of National Leadership
If you cannot measure it, and validate that its true, then it certainly is not science, and there is a high probability that it is fiction, indoctrination, and lies entirely only
How to add new learning; new truth?
Science is measurably and observably true, but often there is an insufficient amount of data to confirm that a policy is harmful – or helpful. An example of missing data is wealth inequality; most nations do a very poor job of reporting inequality nationally
Project Management solves the problem of commissioning the collection of missing data – in every country – simple; and the work of coordination, new workload, reporting, and budgeting are met in this way
Nations hide the Truth
Some statistics are embarrassing – like inflation, suicides, and drug overdose, violent deaths, etc., so political groups are encouraged to lie and hide the truth. Suicides are changed to drug overdoses, CPI‘s inflation basket is reduced in size and items – to hide true inflation, Unemployment Reports present U-3 numbers and they lie about that as well – to hide the true problems in each country, for fear of losing power in democratic elections
Examples of university-taught sciences are explained in the chart above
Examples of fiction and indoctrination taught to students and voters in collapsing nations include unmeasurable Marxism (Socialism, Communism, etc.), Conservatism, Liberalism, Right, Left, Libertarianism, Neoliberalism, almost all “isms” in fact, NAZIism (obviously), feminism, Micro and Macroeconomics, Relationship Economics, Doughnut Economics, on and on
See Hidden Reporting
Smart Cities

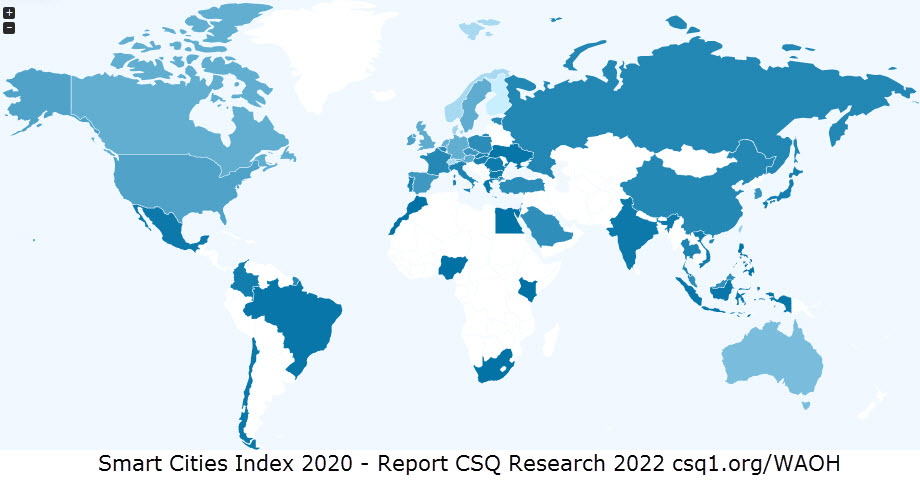
Modern cities with top amenities are an important indicator of National Advance
Stock Markets
Having a Stock Market helps to advance a nation, but stock market performance is irrelevant (except for total collapses)
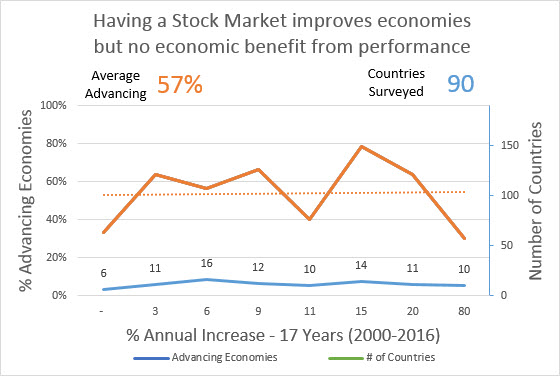
Market Performance is meaningless
… and although higher trade volumes appear important, they are not causal to economic advance
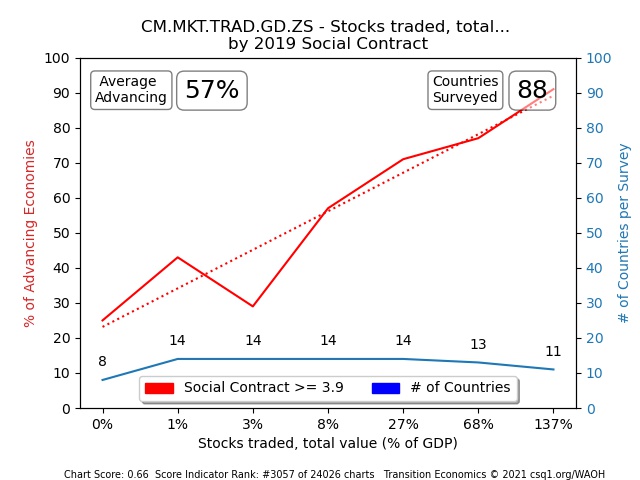
It should also be added that stock markets tend to be 85% owned by the top-10% of income earners, so any government’s “bolstering of markets” amounts to letting the rich raid public coffers – as we saw during the Trump and Trudeau administrations in North America in 2020 and 21
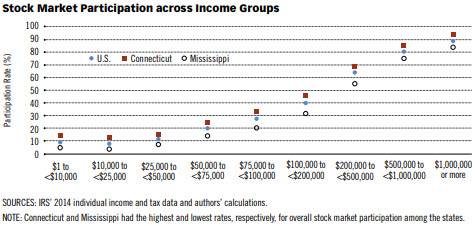
Tax
Middle Eastern nations use Industry Revenues (Natural Resources or Finance) so that no citizen has to pay Income Tax. Western democracies tend to tax primarily those citizens with the least capability to pay tax, and this has driven productivity and production growth to the lowest levels since the 1930s

Note: Populations with sufficient incomes (living wages), savings, and homeownership are not as concerned about the taxes that pay for their high standard of living
100-years of Inheritance Tax – Top Percentile
Historic Income Tax – Top Percentile
Types of Tax
Types of tax include the following:
-Income taxes
-Capital Gains
-Payroll taxes
-Sales taxes
-Property taxes
-Fuel taxes
-Land transfer taxes
-Alcohol, tobacco, and cannabis taxes
-Vehicle-related taxes and fees
-Customs duties & import taxes
-Environmental and recycling fees
-Corporate taxes
-Luxury tax
-Speculation and vacancy taxes
-Probate fees
-Regulatory fees (hunting, fishing, firearms, marriage licenses, birth/death certificates)
-Air travel security charge & other transport surcharges
-Park entrance fees (national/provincial parks)
-Sin taxes (gambling levies, lottery taxes)
No Income Tax
Many nations with no Income Tax have outperformed the G7 for the last 25 years (see Monarchy)
“Low Tax for the Rich” is an unsustainable policy, and No Income Tax for low incomes is preferred as seen in 16 nations that don’t pay income tax today

Gross inequality is the norm in today’s capitalistic Western nations. 80% of citizens simply have no wealth nor income to pay for government, healthcare, and education spending, as seen in the chart below
US Fed Reserve Wealth Inequality Report
85% of wealth is typically owned by a top 20% who afford to pay politicians to make laws so they can pay no tax
Tax Grows
Generally, citizens who could easily afford to pay a tax decided that they preferred the benefits of paying tax for a shared service, so taxation began – and then it got out of hand as decades passed.
The same can be said of Tax Laws which grew larger with every passing year as well
The Cost of Tax Collection
The cost of Tax Collection including staff salaries, exceeds the tax collected for entire income quintiles (20% parts of the 100% population)
In a mature capitalism, imbalance impoverishes ever-greater percentages of any population

In the USA, its population of 330 million contained 220 million people who own almost nothing – less than 5% of the economy and money
Most capitalistic nations have very similar Financial Inequality distributions. You will notice that politicians make this data very difficult to find as well
WHY ARE WE TAXING NOTHING?
Elderly, fixed-income pensioners – we tax them. Families with kids and a massive mortgage on the biggest home they will ever own – we tax them
Financial Inequality is worse today than when the Federal Reserve Budget posted this Wealth Distribution report in 2010. Today, Income Tax has become a movie poster prop (propaganda) that says “The (broken) System Works!” and nothing more
Taxation’s Deep Fakes
Socialism – Follow the money to realize that objections made against deep fake Marxist ideologies are typically voicings from groups that want to retain the incomes that they now control through private ownership – in oil, electricity, uranium, fire departments, insurance, medical care, retirement homes – or any other resource or service
Electricity and fire departments used to be owned privately and not publicly also, with disastrous consequences (recall Arnold Schwarzenegger’s routine California electric grid black-outs as one example). When a house or business caught on fire, a home owner used to have to negotiate with the fire-fighters, to save his house. You can just imagine the kind of abuse that that owner would be asked to put up with
Libertarian and Rugged Individualism zealot Herbert Hoover, drove unemployment to 80% in some parts of the USA and starved hundreds of thousands of Americans to death while he created Hoovervilles and the very worst outcome for the Great Depression’s financial system meltdown


“Didn’t need no welfare state, everybody pulled his weight”
Archie Bunder’s theme song was a satirical commentary that showcased Herbert Hoover’s foolishness, folly, and disastrous Houvervilles, once he took office in 1929. The satire was lost on listeners decades later as Neoliberalism and Libertarianism’s harms were forgotten so that they could reemerge in the 1970s
85% of all stocks are owned by the top 10%, so any notion that stockholders are society’s priority is nothing more than deep fake Wealth Theory
Are Zero Income Tax nations successful?
Zero Tax nations have outperformed the productions of the G7 for the last 25 years in all of the Monarchy nations above. The same is true for Bermuda, Bahamas, Brunei, Vanuatu, and the only nation and that has done worse than the G7 is war-torn Somalia
Teen Pregnancy
Teen Pregnancy is not a harmful statistic
Feminist election campaigns often suggest that this is a bad thing by their harmful ideology
Tourism Spending
Earth Temperatures
Six discussions explain Earth Temperatures
Spoiler Alert: There is no Climate Crisis
We DO have a few engineering projects to conduct from region to region, but we always will
1. Earth’s Axis Tilts and Magnetic Field Shifts

- The earth’s axis and tilt change as does its magnetic field move and infrequently (thank heavens) also flip its South to North polarity as well.
- Today, the earth’s tilted at 23.5 degrees – is responsible for the seasons
- As the tilt of the earth changes, temperatures will rise in the North while falling in the South. Ice lost in the North Pole will be offset with new ice in the South Pole if nothing else changes.
- Ferry dock buildersreport that the docks that their ferries have been landing at daily for forty years have not experienced even one inch of sea level change.
2. Distance from the Sun
 The Earth’s annual orbital travel around the sun doesn’t follow the exact path each time. Its closeness to the sun varies cyclically to create closer and farther proximity to the Sun
3. The Heat and Energy Output of the Sun
- The sun cycles through periods of hotter and colder operation, and also higher and lower magnetic attraction strength as well
4. Desertification
- The Sahara Desert is the size of China, covering 8% of the earth, and it grows by 1% annually for the last 100 years. That is an increase the same size as Cypress – every year, and such rapid deforestation does cause higher surface temperatures
- See also: Desertification and De-desertification
5. Propaganda – Indoctrination of Harmful Ideologies
- Teaching populations to fear their own shadows while forcing untested vaccines, depopulation, poverty, and destabilization has 90% of large democracies collapsing today
- See Criminal Legislatures
6. Greenhouse Gases and Pollution
Methane (CH4), and Nitrous Oxide (N2O), along with industrial gases like Hydrofluorocarbons (HFCs), Perfluorocarbons (PFCs), Sulfur Hexafluoride (SF6), and Aluminum cloud seeding.
Aluminum is a heavy metal, so you can imagine the response of the public when news of unlawful indescriminate Aluminum cloud seeding’s poisoning of our skies over public areas is discussed.
Carbon Dioxide (CO2) – We have all become accustomed to hearing reports about how quickly CO2 levels have reached unprecedented levels, but nothing could be further from the truth. Wide volcanic activity 300 million years ago caused the parts per millions (ppm) of CO2 in our atmosphere to rise to 7800 ppm – for 300 million years at a time. So far, this millennium sits at around 400 ppm and still, this level is close enough to CO2 Starvation levels so that desertification is still a problem. See also CO2

As to the truth of CO2 being a greenhouse gas, we think it highly unlikely, or at least its impact as one is harmless and easily mitigatable. Engineering projects can, and indeed should, resolve impacts before they happen, whenever temperature changes can cause flooding or fires regionally. This conclusion is based on how important CO2 is to life on this planet – for at least a billion years now.
As for Reports of CO2 in the News or on AI providers, there are plenty of Political Crisis fabricators funding “scientific reports” to say that it is, but there are just more credible reports, both funded and unfunded, that say that CO2 is not a greenhouse gas.
CO2 (Carbon Dioxide) is NOT a greenhouse gas, does not heat the planet perceptibly, is not growing at unprecedented speeds or rates, and nor is it a pollutant
Trees Grow Much Faster at Higher Levels of CO2
CO2 is a building block of life on our planet, permitting vegetation to grow and create the oxygen that all life on Earth breathes
See also: Climate Dysphoria in Ideologies
Time Equity
See also: Hybrid Future Economies
Introduced by author Richard M. Kiernicki in 2020, TIME-EQUITY is a new social philosophy explained in the book, “The Capitalist’s Worst Nightmare Come True: The Crucifixion of Capital.”
TIME-EQUITY proposes a paradigm shift: replacing money with TIME as the universal measure of human contribution and access. The core principle is simple—everyone’s TIME is equal—captured in the statement: “Your TIME is equal to my TIME, my TIME is equal to your TIME, and together our TIME unleashes unlimited potential.”
By removing capitalism and money, TIME-EQUITY aims to eliminate income inequality and establish a new foundation for ecology and human rights, including the possibility of a true direct democracy “by the people.” It also advocates complementary reforms such as transitioning to a 13-month, 28-day calendar, and it frames the long-term outcome as a more peaceful, transparent, and cooperative human era. Education and vocations are redesigned so people identify their gifts, contribute where they are best suited, and obsolete jobs are redirected. Sustainability becomes a universal responsibility, shifting society from “economy” to “ecology” by focusing production and consumption on planetary integrity. There will be no more excuse that it’s “not in the budget,” because there will be no budget or monetary concerns.
TIME-EQUITY responds to challenges such as wealth inequality, environmental degradation, unfair resource distribution, planned obsolescence, war, corruption, profit-over-people incentives, artificial fear, and devalued human potential. Its solutions emphasize equality through TIME, sustainable distribution, improved efficiency, universal access to necessities, and creativity unlocked and supported through transparency.
Mechanically, a life model is suggested (25 years of education, 25 years of work, 25+ years mentoring/retirement). TIME co
Implementation is proposed in five phases: learn the concept, build a community to 3.5% global adoption, develop the framework across major societal systems, run pilot programs, and then expand globally.
Protect against
Treason
See also Act of War, Net-Zero, Criminal Legislatures, Banks, GFANZ, Corruption
TREASON and HIGH TREASON are important definitions to understand, and to protect against in every nation
Most online definitions seek to convince us that treason is “overthrowing a government, harming a sovereign, or aiding enemies”, but that definition fails to recognize the wide success of criminal legislatures (governments) in recent decades, and that the most important resource of any nation is its citizens – not its government. Monarchies have been consistently advancing nations and citizenry and today serve as shining examples of good government. High-income, small democracies succeed similarly, while 90% of large democracies are collapsing under the weight of corruption, harmful ideology, criminal-legislatures, and often-legalized Acts of War like depopulation laws and election fraud immigration.
An accurate definition of treason today is “Harming a nation’s citizenry (depopulation and denied human rights), economic viability, sovereign, or aiding enemies“.
High Treason – Bringing a War to the country, or facilitating a war’s start through Acts of War, economic attrition, and harbouring millions of low-compatibility election fraud immigrants to gain permanent elected power and control (filling swing or close-race electoral ridings with one-sided voters). See Canada’s Criminal Code 46.1 for its definition of treason
Treason – the U.S. Constitution defines treason strictly as levying war against the country or adhering to its enemies, providing them aid and comfort


Find an ordered list of important national measures at WAOH Data Science
The Tytler Cycle Kondratieff Waves Business Cycles Mature Capitalisms
See also: Collapse
Repeating cycles of advance and collapse is a phenomenon observed in capitalistic societies for 4000 years. We know this fact to be true because the 1763 BC Code of Hammurabi explained pre-emptive 50-year Jubilee Economic Resets and other records that recorded Economic Resets and broad Debt Forgiveness Reliefs at the coronation of a new King as common.
You and I can read this for ourselves by turning to Leviticus 25:26, because the Bible’s first five chapters – the Pentateuch – is a 1000-year later update of Hammurabi’s Constitution and Criminal Code that we today call “the Old Testament”.
TE is a Civic data science that recognizes imbalances between incomes and cost-of-living occur slowly over decades to create mature capitalisms – whenever leadership and correction are ignored
Uncorrected 60-year mature capitalisms were responsible for the American Revolution of 1776, for World Wars I & II, and so on again and again through civic history.

War – Wikipedia Revolutions per Decade
Alexander Tytler’s Cycle of Civilization
“A democracy cannot exist as a permanent form of government. It can only exist until the voters realize that they can vote themselves largesse from the public treasury. From that moment on, the majority always votes for the candidates promising the most benefits from the public treasury with the result that a democracy always collapses over loose fiscal polity, always followed by dictatorship. The average age of the world’s greatest civilizations from the beginning of history has been about 200 years.”

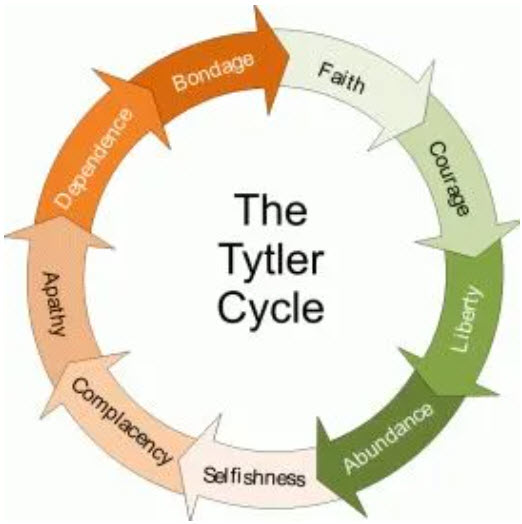
Solution
Civic Science Transition Economics corrects these extreme highs and lows of opportunity, which occur reliably in 60-year Kondratieff Waves (also called Business Cycles and Mature Capitalisms).
– AND –
Civic Science Certifications and Monitoring train Civic Scientists, and monitor performance, so that we all know what is important and unimportant, and our productivity maintains consistent advance

U.N. Happiness Index
Values
In the 1930s, NAZI’s asked citizens to confuse a harmful ideology for “good values”. Today, Feminists and Libertarians ask us to accept their values, the same, with even more harmful consequences

Good Values are behaviors that we must all esteem, safeguard, and live by, because they are essential to every prosperous society – and because societies collapse reliably when they are ignored
In the 1940s, Americans had endured a decade of starvation and depression following two great wars. The “Roaring 1920s” created a Great Depression, and it was clear that the corruption and profits of a few, high divorce, and infertility rates, were behaviours and values that led only to certain collapse
Family Values
A man could not hold public office or a senior job until he supported both his family and his wife’s family, and their children, with his salary, home ownership, and pension
Gender Roles
A man went to work to support his wife and children. Bank accounts were shared by husband and wife (so she could do the shopping while he worked)
Human Rights
Security was afforded to all citizens through the assurance of Human Rights:
- a good job (income)
- a good home
- a good education – censors ensure women were treated respectfully, that swearing and family-friendly movies and commercials appeared only
- healthcare
- a family’s support and caregiving
- security in old age with a pension
- a family vacation and cottage – a right that the Soviets embraced with Dachas
- incomes that can afford entertainment and can build a strong middle class
- protection from unfair business competition, both foreign and domestic
- a farmer is assured a decent living
See FDR
Civic Best Practice
Sunday community gatherings, family time, and Civics Lessons
The Bible’s civics lessons used a Trinity of good values using the teaching tools of a father (God), son (Jesus), and the holy spirit – Good, Respect, and Human Advance
- Good – Systemic Empathy in decisions, actions, and in laws – Good Thoughts, Good Words, Good Deeds
- Respect – the Golden Rule’s respect for family values, neighbours, the disabled, sick, elderly, employees, employers, travelers, and foreigners
- Human Advance – Productivity, building and improving each generation. Leadership, Shepherding, and Good Stewardship
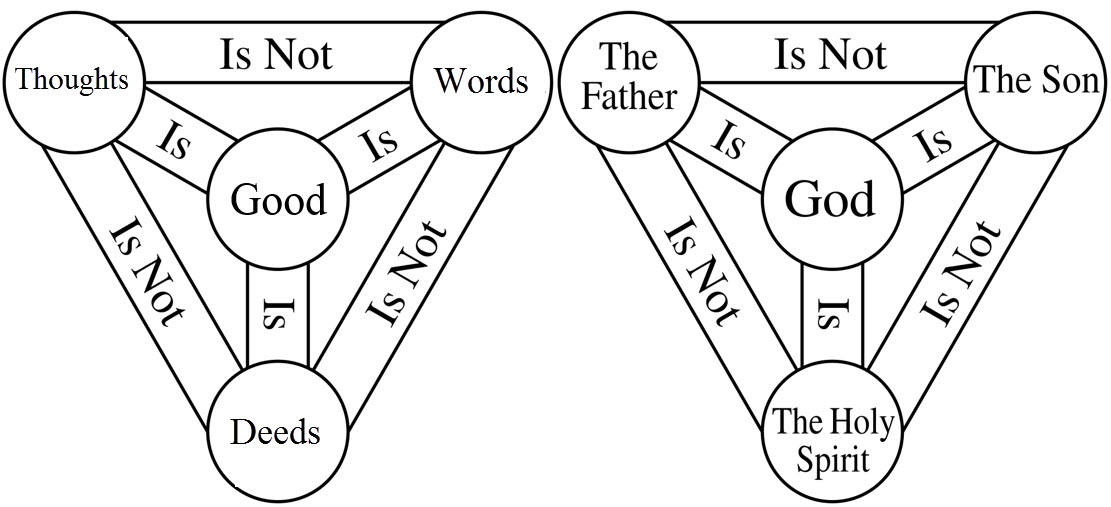
Thoughts are not words, and words are not actions. Good values are proven by our actions
This definition of Good Values is repeated across the WAOH Library’s introduction above – and in all its lessons and teachings
Zoroastrian Christians summarized this as –
Good thoughts, Good Words, Good Deeds
Expert Leaders, Human Capital experience, Merit, Human Rights of Family Pensions and Living Wages, affordable cost-of-living, and housing, etc., are all examples of good and respectful policies that support populations that can be productive and prosperous
!! Good Values Work !!
The good values, human rights, and family values of The Greatest Generation in America built a sustainable fertility rate (The Baby Boomers) and the greatest economy of any country in history. And, all other Western countries that mimicked FDR’s Second Bill of Rights saw similar success
From 1940 to the 1980s, growth was steady and sustained, and then, as the Baby Boomers became wealthy, Reaganomics changed these values back to the 1920s Neoliberalist values again, creating a similar sustained economic collapse, and then globalism compounded this poor financial governance with harmful ideologies as well
National Productivity – China is mimice by dozens of countries that have outperformed the G7 for 25 years now
Countries that perform better than these 90% collapsing large western democracies (small democracies and monarchies) did not adopt these poor values, and this ensured that they sustained the high productivity that was assured by their good values. Countries like Denmark, the Netherlands, Norway, KSA, UAE, and dozens of others
Good Values battle against
Racism, Ageism, Sexism, Division-by-Class, Wealth, or Ideology (Left and Right Divisionism, Neoliberalism, Libertarian – Cold Indifference to neighbors, Feminism, NAZIism, etc.), and other harmful ideologies (false definitions of good; false gods, and their flags, misinformation, and idols).
Political campaigns that create infanticides and poverty; DO NOT TEACH GOOD VALUES
ALL harmful ideologies ask you to accept their utopian values, morals, and ethics as modern, progressive, and better, while none are good values because all create Crimes against Humanity, War, and Poverty reliably
Values create measurable social benefits (Common Sense) and prosperous societies, while ideologies collapse nations. The Bible is a civics textbook, so its lessons warned against these “false Gods” (false definitions of good) / harmful ideologies 1,700 years ago
See: Ideologies
Neutral |
Addiction
Statistics in Vancouver and San Francisco indicate that 30% of homeless individuals in the USA and Canada, suffer from mental illness and/or addiction to alcohol or drugs
This means that 70% of homeless people are viable, want to find an income, and are simply denied access

For addicts, an unsupervised income and ready access to drugs or alcohol can be a death sentence
It’s not unusual for social problems to erupt on the day that welfare cheques arrive in an isolated high-addiction community, so more clever approaches are needed to make these affected centers productive again
Everyone wants to be Productive
Populations create the greatest economies and societies whenever the opportunity is afforded. This is proven in evidence-based science throughout WAOH again and again
Alcohol
All alcohols are poisons
There are three types of alcohol: ethanol, methanol, and isopropy. Ethanol can be distilled or fermented
Ethanol is the only type of alcohol that humans can consume. However, misuse of any form of even ethanol alcohol can lead to serious and life-threatening consequences
Most civics lessons ban drunkenness or consumption entirely, and for addicts, abstinence is mandatory for the addict’s (the alcoholic’s) survival
See also Addiction
For addicts, an unsupervised income and ready access to drugs or alcohol is unproductive and can also be a death sentence
It’s not unusual for social problems to erupt on the day that welfare cheques arrive in an isolated high-addiction community, so more clever approaches are needed to make these affected centers productive again
Generational Alcoholism/Addiction
Some societies and cultures suffer high rates of alcohol addiction handed down from generation to generation. Generational Alcoholism is a Social Problem and should be warned against, avoided, and also prevented. Like Autism, generational alcoholism is a preventable condition that harms a society’s productivity – and reputation as well
National Alcoholism/Addiction
National pride, export, and even manliness can be tied to the manufacture and consumption of alcohol – as a test of a man’s ability to control himself and self-moderate a dangerous substance
National Alcohols
In Russia – Vodka
Germany – Beer
Scotland: Scotch
Philippines – Pineapple Beer
Greece – strong spirits like Sambuca
Portugal: Fortified Port Wines
France: Wines & Spirits
China: Baijiu
Japan: Saki
Italy: Compari, Grappa, Wine
In Latin nations: Tequila
National Sobriety
55 nations adhere to the Quran’s Civics Lessons which teach sobriety and ban 100% the manufacture or consumption of alcoholic substances
The Bible’s civics lessons ban drunkenness, but not the moderate consumption of wine and alcohol
Alcoholic Disinfection/Sanitization of Water
Wine and bitter water (water with vinegar) were important water disinfection techniques at the time of the Bible’s latest update in 325 AD, where water filtration and boiling were unavailable – usually due to the high cost or availability of wood in cities
Fun Fact: The tomb of Ramses II included an explanation for how to build a sand filtration system for water purification
Chlorine/Chlorination is the preferred disinfectant for potable water today
Artificial Intelligence (A.I.)
99% of humans are born good; able to empathize with others as programmed into our DNA by a billion years of evolution. If God is a teaching tool for Good, then “we are all born in his image”
For the other 1% of humans that are unable to empathize, we often have to incarcerate them because they are responsible for an exponentially greater percentage of violent and similar crimes
This speaks for Nature, and then our Nurture (our environment: the competition for basic needs of life and good communities) can decrease this goodness in us whenever needs of survival mandate we must compromise the good in ourselves and others to meet our own needs
An A.I. is born good 0% of the time. It is 100% unable to empathize, and far too little is understood today of the fundamental “programming” that permits humans and societies to prosper together reliably
A.I. is absolutely a benefit, but its understanding of scientific civics (often miscalled “philosophy”) is absolutely essential
Good A.I.
MEMS World Peace A.I. – uses machine learning and evidence-based civic science to ensure Good, Respect, and Human Advance reliably in 220 countries
Self-Driving Vehicles – are a very good thing, but we do seem to be a ways off still. After 10 years in development, A.I. is not driving safely just yet – but as Tesla is correct to point out, neither are human drivers driving perfectly either
Good and Bad A.I.
ChatGPT, Google AI Labs, Google Bard, Microsoft Co-Pilot
Good – AI tools help users create programming (using popular programming languages), contracts, letters/emails, legal contracts, news stories, fundraising scripts, resumes, cover letters, etc. This saves considerable time weeding through dozens of web articles hoping to find good examples
These tools are “Good to Bad” at most requests:
In Civics – ChatGPT uses inaccurate definitions to teach:
- Harmful Ideology: It encourages and indoctrinates harmful ideologies – like feminism, wealth theory, race theory, gender theory, and does not promote nor insist upon science, reality, or truth
- The Bible: The Bible is a civics textbook, an update of the Constitution, and the Book of Rights and Laws, from Hammurabi and Ur’Nammu 4,000 years ago. Religions use the Bible but the core of its 73 books (“ta Biblia” means “The Books”) are not “a sacred religious text” – as ChatGPT and most woke AI Co-pilots instruct
In programming, ChatGPT creates untested, incomplete code that will rarely fulfill the needs and requirements of the business case requested. It can offer a new programmer a start or a template, and it can be a time saver when a programmer is new and looking for a specific programming language syntax – but not always – or even often in my personal experience
Graphics and Video
With 100 AI Graphic Tools available since the summer of 2023, Youtube is an excellent source for learning about image and graphic A.I. See 10 AI Tools that Change Everything
Images
Dall-E, MidJourney, Clipdrop, Photoshop A.I., DiffusionBee
Video, Worlds, and Transformation:
Runwayml, Reface AI, Wonder Dynamics, Skybox Blockade Labs, Kaiber
Good – Dall-E creates terrific photorealistic, impressionist, pointillist, etc. renderings of photos or text-based image instructions
Harmful A.I.
- Human Resources A.I. – 20-years ago, experts used to compete against six skills resumes and be hired within a week or two by a 20-year expert middle manager who could teach any shortcomings to the new hire; today, an entirely unskilled HR worker and MBA supervisor hire from a stack of 40 resumes based on race, fit (followers), gender, sexual orientation, immigration status, hiring networks, diversity laws, certifications (often faked or meaningless), low salary, and pension needs
- Military and Policing – generally any tool that makes it more clean and easy to kill people, can be thought of as harmful
- A.I. in the military creates another expensive “Nuclear Arms Race and Deterrents Program“, which is little different than the Cold War of the 1950s through the 1970s
- Facial Recognition – makes government and business interference with a citizenry’s lives, an enticing possibility – where homeland security groups can argue anti-terror. The solution to Terror? Generally, when you take away the reason for citizens (or spies) to need terror campaigns, the problem fixes itself
- Disrespect: Technology or Policy that disrespects human beings, male or female, by race and creed, is an unempathetic and harmful behaviour. This is not to say that we are inherently disrespectful, as race theory and harmful DEI ideology insists
Important Summary
We don’t need to protect jobs that screw lightbulbs into refrigerators on an assembly line all day, but we do need to ensure that our technologies provide for the needs of the workers who are displaced by robotic innovation – until they can find another way to be productive, contribute, and find incomes
See Worthwhile Industries for one solution to this problem
Balanced Budgets
Much mistaken emphasis is placed on balancing budgets in Conservative Neoliberalist ideology – by way of ever-harmful Milton Friedman indoctrinations. Governments print money from thin air today; so, achieving important goals is much more important than balancing a budget – in reality and in science
Obviously, if you are exceeding budgets and also worsening a nation’s social and economic conditions, you are creating a worst-case result
In a surveyof 195 nations, large economies (high-income nations) with a large budget surplus advanced consistently, while a balanced budget was the worst possible result for any nation
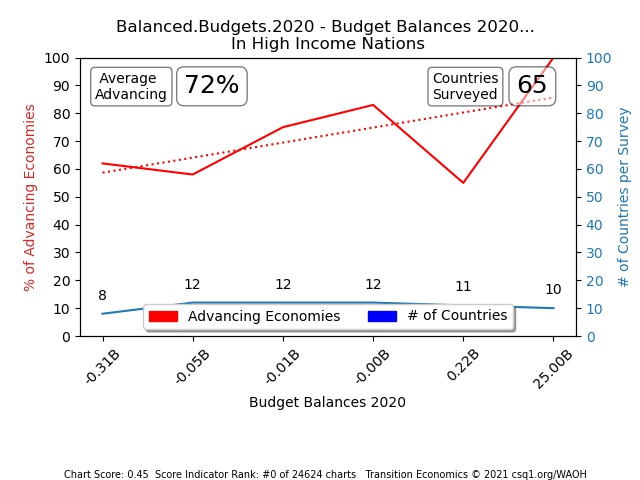
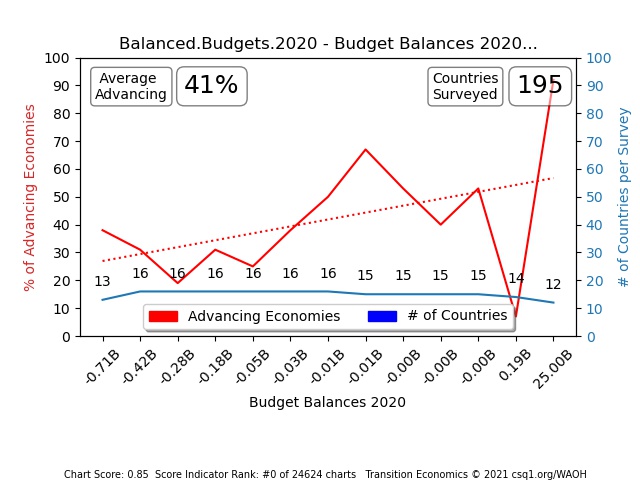
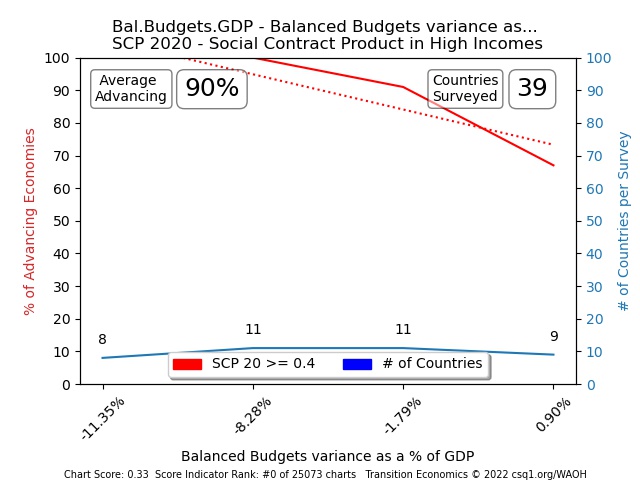

Banks
Commercial and Retail Banks are only a value when they facilitate and create Production and Growth
Today, we are at 1930s levels of Production Growth, while our Universities hide a Great Depression from the public, so that it’s collapse can endure without correction for the benefit of a handful of political sponsors. This explains that Banks today, behave as parasites entirely
“Business Profit” does not build a strong economy – as Wealth Theorists would like to teach us (indoctrinate us) – in university Micro and Macroeconomics courses today
A bank (and the Banking Industry’s) contribution to Production Growth determine the importance of:
- Banking Regulation
- Banks are measured by Asset, Business Profit, and Market Capitalization today, and should intead be measured by Production (by their contribution to the economy)
- Banks today can treat the artificial asset valuations created by easily-manufactured bubbles – as real, and extend more lending based on these new false valuations. GDP Reports climb not-based on Production, but based on false bubbled valuations – that regulations permit as “Production” incorrectly.
- A Market Collapse in 2008 was much larger than the Black Friday Market Crash of 1929. It was caused by profit-seeking mortgage fund consolidators getting past Moody and S&P Bond Quality Regulators with junk Mortgage Debt (paper)
- Banking Bailouts
- cost governments trillions of dollars annually, for a decade after the bailout in some cases
Do we need banks?
- Production – a bank that doesn’t benefit monetizable national Production should be closed regardless of size, employees, etc. Their resources are digging a grave for the entire nation that we are all better off without.
- Digital Currency – could make banks unnecessary altogether. See Digital Currency
See also Production
Lax International Banking Laws
International Banks can create Billions from nothing today, and when banking regulations are lax, your kids will be forced to compete against this money when buying a house.
George Gannon explains how billions and trillions are created from nothing with lax banking laws, to create bubbles and a long list of globalist criminal legislatures

Capital versus Profit, Money, and Currency
Any Civics 101 course explains that the standardization of token-based money, allowed communities to become prosperous by permitting specialization of all of the things needed by in any household
Currencies (coins, dollar bills, euros, …) allowed people to specialize their productions. Farmers no longer had to be butchers, shearers, metal workers, miners, engineers, builders, weavers, tailors, pottery workers, lumber jacks, shippers, potable water, and doctors. Currency meant that individuals didn’t have to barter and trade for everything, and could now learn and work at one role and be compensated for their contribution sufficient to afford to pay for their family’s basic needs of life
Initially, the term Capital referred to purchases and investments that were productive and grew by themselves. A heard of cows, for example, would start with 10 animals and grow to 20 animals in a few years, so this was a Capital Investment because there was an innate value in owning it
The value of currency (token-based money) was originally based on the amount of precious metal in the token itself. The Spanish Dubloons (gold), Roman Aureas (gold) and Denari (bronze), Greek Drachma (silver), etc. were examples. In the 1970s, the world changed from a GOLD STANDARD that fixed the amount of a nation’s money to their gold supply, to a FIAT (market-based Foreign Exchange – FOREX) system of monetary/currency valuation, which removed any relation between currency and assets which had resale value.
This means that FIAT Currency, and Money itself, is based on nothing more than the ability of a nation to repay an obligation of Debt at a market’s Interest Rate (1%, 2%, 3% per year) which is set / offered by each currency owner’s Central Bank. In this currency market, a higher rate of interest attracts more investors who are willing to extend debt.
Over time – and mismanagement, the term Capital changed to mean simply Currency, such that any investment of money became an investment of Capital, but this wasn’t true. Only certain types of spending had value and Profit is not the only consideration important to a nation’s sustainable investment, investors, and regulators.
This FIAT System is brilliant because it allowed countries to borrow from other nations and banks, to build productivity (Oil Refineries, Mines, Computers) and to then repay the loan with interest from the profits created by the sale of the production.
FIAT can be mismanaged as well, whenever profit becomes the focus, and production is ignored, or when borrowing and debt money is simply spent (on non-investments that have no possibility of creating a return). We see this in GDP (Gross Domestic Production) calculations today – which count housing bubbles, inflation, and sales profit or foreign printed money – as production.
The change to focus on profits alone permitted Sales Economies that bought shoes for $1 from China and sold for $100 locally, to be taught to Economists as important, and it permitted Housing “bubbles”, to be misunderstood as important real capital and wealth.
Civic Scientists prove that Capitalisms only work well to advance a society, when these productivity benefits are monitored and ensured/regulated, and debt only creates profitable production.
If you are beginning to see that a lie, is stacked on a lie, stacked on a lie here, then you are accurately understanding our collapsing monetary systems today
The Value of any System
The value of any system, be it Monetary, Engineering, Manufacturing, Democratic, Government, Business, Finance, or other, is measured by its contribution to humanity’s advance. FIAT worked well to build prosperity and human advance 70-years ago, while today it collapses 90% of large democracies
The elimination of living wages in Western democracies, has created both inequality and 1930s levels of production growth. The collapses have contributed to the elimination of families, family pensions, family values, single-income households, and runaways in cost of living. Tactical, indoctrinated business practices and vote-grasping political groups, now use harmful ideologies like DEI, to divide societies and to collapse economies reliably in every measurable way


A CRIME AGAINST HUMANITY is created through De-population Theories and both TREASON and HIGH TREASONS are created by political groups that lead nations to war, by the definition of treason in most Constitutions
Every problem is solvable
See Constitutions, Inequality, and Profit
Capitalism
See also Marxism
Franklin Delano Roosevelt built the greatest economy in history, with Capitalism
Successive GOP Presidents, Congress, and Senate in the USA used Capitalism to create the Great Depression within just 10-years in the 1920s
The difference was that one form of Capitalism was Regulated, and the GOP’s Capitalism was Not Regulated (Small Government and Deregulation Policies)
You can see the clear difference in the USA’s productivity after regulation was eliminated by Reagan and successive Right and Left Presidents
Trade – through barter and then through token-based currencies by private merchants, has been around for at least 6,000 years, beginning long before the Bronze Age (3,300BC to 1,200 BC). Human civilizations have always prospered by trading with neighbouring kingdoms through the exchange of needed resources and finished products (silk, spices, bronze cookware, iron cutlery, etc.)
Capitalistic Societies – become unbalanced due some families finding luck in their business dealings, and others finding bad luck, failed crops, difficult opportunities, etc.
Imbalance – consistently takes 60-years also owning to the effect of compounding inflations. When 2% cost increases are followed by 10% and 4% year after year – for this many years, costs of living always falls out of line with available incomes. Its for this reason that hardship was preempted and monarches were trained to reset the balance in 50-year Jubilee Years once again
The first recorded Economic Reset is documented on the Constitution of Hammurabi in 1763 BC, and as our Bible is an update of Hammurabi’s Codes, you can find Jubilee Resets explained in Leviticus 25:26
See Reset
Certifications
Certifications are a part of Credentialing that often instructs and enforces harmful ideology today
To keep this simple, there are Good Certifications and Bad Certifications, and invariably, the bad ones will claim to be good and essential while creating dramatic broad collapses
Good Certifications
A credible certification program uses evidence-based science so that its lessons are transparently validatable, true, and real …
Sustainability Certifications for Business, Finance, and Government are Essential
CSQ Research Sustainability Certifications
Medical Certifications: When an individual’s health and well-being are on the line, a scientifically validated approach must be taught and kept current. A ten-year interval between heart surgeries is going to make a surgeon “rusty” and less qualified. An individual with no previous training and experience should never be permitted to perform surgery
Engineering Certifications: When the public’s well-being and safety are on the line, a scientifically validated expert is essential.
Civics Training – is Essential
Evidence-based Civics is a STEM curriculum that is not taught and is also blocked in Western universities – and in nations that are 90% collapsing today. The Bible used storytelling and teaching tools to explain civics lessons that were observed successful in civic rise and fall over millennia of human history
Bad Certifications
A bad certification program teaches provably false theories, harmful ideologies, and indoctrination – and these can be embedded in laws and defended by law societies as well – in many countries like Canada and the European Commission
Harmful Sustainability Certifications
Dow Jones Sustainability Index
FTSE4Good
ISS and Oekom Prime Rating
SAP Ariba Procurement
Global Reporting Initiative (GRI)
Ceres
Harmful Certifications give the false impression that an individual is an expert in an important field and can perform a needed duty better than others, when in reality they will only bring dumb-down, fits (followers – anti-leadership, anti-experts), hiring networks, and anti-merit to any business or regulatory post
Permitting harmful Certification practices devalues both the companies and the countries in which they operate
The Mandating of harmful Certification Programs – by law or hiring requirement, drives collapse systemically
Poor Civics Training
90% of University Civics faculties teach theory-based proven false indoctrination today: Harvard, Yale, Oxford, Cambridge, Sorbonne – ALL universities in collapsing nations teach indoctrination – and not education in civics
Faculties: Economics, Business, Finance, Law. Education, Government, Political Science, Social Studies
MBAs, Accountant, Finance people, and Lawyers, are Not Experts and Not Leaders – and collapse countries
Human Resources, IT, Management Certifications: HR workers and application screening applications are not experts, and are not qualified to train or evaluate new hires – so they should not be hiring. When an experienced expert hires, they can train and supplement any shortfalls for the new candidate – realized during or after their hiring. An HR or MBA non-expert hiring manager cannot.
Climate Change
Carbon Taxes
Managing Climate and Pollution requires a plan of Y2K-like engineering projects that address the problems created by natural and man-made shifts in climate
A globalist “Climate Change” agenda has created a distraction from the important Financial Inequality social and human rights issues seen today
Climate Dysphoria – the Chicken Little story – Media and School Indoctrination makes this condition surprisingly easy to recreate in real life
Man-made CO2 does not warm the planet (as seen during four Ice Ages) and reducing CO2 levels creates deserts – which will warm the planet. See CO2 and Desertification

Note that the red line is minimum CO2 needed for most plant life. We came within 30 ppm of total planetary annihilation of all higher life on Earth at the end of the last Ice Age, which was the lowest in Earth’s history.

If one wanted to make habitation in equatorial regions of the planet untenable or impossible, one merely has to starve the planet of Carbon Dioxide (CO2) – to create deserts in the Middle East, Africa, and many Latin nations. This is true because today we sit very near to starvation levels of atmospheric CO2, and reducing CO2 futher would tip a heating trend created by widening deserts and decreasing forests and agriculture


Carbon Taxes – are a hoax entirely.
Any additional taxes are similar to Income Taxes, which make little sense in financially unequal capitalistic societies – where 85% of incomes and wealth are held by the top 10% typically
The revenues from resource production could easily remove this incumbrance to national productivity – away from overburdened citizens, to recover an average $4 billion loss to every economy today
Civic Science Reality proves that Wealth Theory is fictitious and proven failed, yet this remains the indoctrination that we teach in the West’s schools and 90% collapsing large democracies
Paleo-climatology scientists employ ice-core samples to understand The Earth’s natural cooling and heating cycles over the last 600 million years. Ice Core samples study our climate in research that has been conducted for at least 100 years now (see our slideshow in CO2)
Sponsored Mathematicians and Institutions who invent climate models based on theory and agendas alone (without evidence-based facts) are not scientists, and industrialists have ever been keen to sponsor universities, quasi-scientists, and theorists, who will portray their businesses as viable – in return for money, campus buildings, TV channels, and so on. “The Economist Magazine” is a Rothchild Publication, a WEF Banker funded $30 million for McMaster University’s “Leadership Campus” last year, and these are just two examples among thousands – at Harvard, LSE, Oxford, Cambridge, Sorbonne, and so on
Today’s 5,000 to 20,000-staff Academic Institutions are made a Victorian Era Academy of blood letters and opioid pushers in 75% of faculties that are today corrupted by foreign or profit-seeking financial sponsors
See Our Academic Mediocracy and CSQ Research’s suggested solutions for Education Reform
The dinosaurs lived on a much warmer Earth than we do today – with much higher levels of CO2 that created dense lush forests and plains, so global warming and cooling is a natural process that humans must work with and accommodate
Global Climate Changes do need our projects and action. We need to correct seasonal flooding, landslides, freezing, and sea level changes should they occur, similar to our recent international Y2K project efforts. We should be depoliticizing climate and handing a National Weather Management Project – NWMP, to experts and Engineers, so that we can move on with solving more important Financial Inequality projects – running in parallel at the same time:
Engineering Projects: like the Reverse Desertification projects seen in China. Holland’s Dike System was a clever solution to land reclamation needs 150 years ago, but I don’t think any engineer imagined that it would work indefinitely
Business SOPs: that create clean pollution-free CO2 by manufacturing, mining, chemicals, and other productions and facilities
Real Estate legislation: IF regions of the earth become untenable for life, or IF sea levels erode homes on the water, a system of real estate retitling could solve housing needs for families displaced by rising or falling sea and tide levels
Social Contracts – are Human Rights, and therefore more important than most projects. Human Rights / Social Contracts must be safeguarded and bolstered while correcting warmer temperatures created by CO2 taxing and desertification. 40-years of national worldwide Social Contract decline is a separate discussion driven by our failed systems of government (90% of large democracies are collapsing), systemic mismanagement, and poor leadership education and selection
A change in sea levels is NOT a proven fact nor a problem today. CSQ’s research conclusion leveraged the findings of international ferry dock engineers and builders responsible for engineering land-to-sea connections for large ferry boat services internationally over the last 50 years. Ferry Dock engineers have seen no changes to their ferry boat access ramp water levels
Venice – was built on sedimentary soil that has been sinking at a rate of 1 to 2mm per year since its first creation. Venice has sunk 6 inches (15 cm) over the past century, so the Italian Government has initiated a national project to lift its important buildings and courtyards. The work will compensate for the 100 Aqua Alta periods that occur each year and have created flooding in Venice since the 1870s
“Clean” Technology
FUN FACT: We have enough Nuclear Waste to power our planet for 150 years – right now today
So, reducing Social Contracts to afford wind farms is always unnecessary, and is never driven by need but rather by a political group’s attempt to distract us from Financial Inequality (or other topics that are unpopular with their financial supporters – be they developers, large companies, consulting groups, theory-based think tanks, oligarchs, etc.)
REAL PROBLEMS are being ignored – instead of solved today, which explains why 90% of large democracies are collapsing, while all Monarchies are successful
We want to avoid destroying our habitat here on the planet, in order to “correct climate”, as we see in a discussion of large solar farms and wind generators killing eagles and displacing tortoises and similarly endangered species

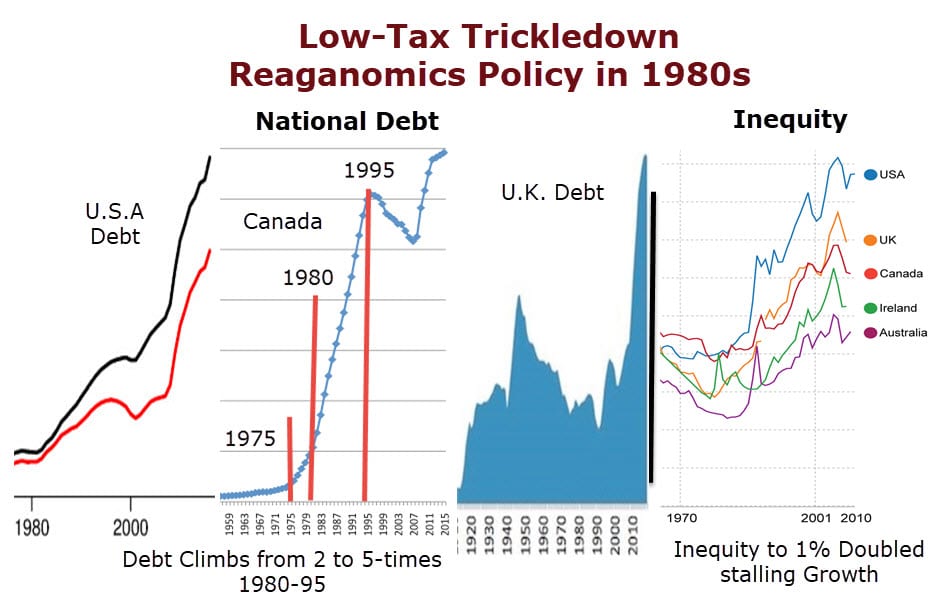
Debt Forgiveness
Every major nation in Europe had debt written down in the 1930s to 1950s

Democracy
WAOH is Civics Library that explains i) Systems of Government and ii) the policies that advance or collapse nations
Democracy is:
- A System of Government
- (Most often) Controlled by a Constitution, Bill of Rights, and Book of Laws
- Important – when it advances the society that it governs; and
- Unimportant – when it collapses a nation (see Platitudes)
- Very different in populations below 20-million, than in populations above this threshold (called “Large Democracies” at WAOH)
Performance Management
- 90% of Large Democracies are collapsing today
- Every nation (measured across 207 nations) loses $4 billion US today on average (this is much more than 100% of annual economies of most nations)
- Socrates was put to death at the age of 80 by the democratic Senate of Athens, for asking questions about what Greece’s Gods represented and taught us (their civics and philosophy teachings)

PROs and CONs
- PROs:
- Democracy is a consistently successful form of government in populations less than 10-million. Populations can see the impact of problems and can vote for changes and rebalancing easily when needed
- Large Democracies can flourish in times of economic boom where laissez-faire policies can help monetize productions, assuming the population has whatever it needs to be productive as well
- CONs
- Large Democracies make it impossible to make consistently-positive changes and corrections, as is needed during times of imbalance like Mature Capitalism
- Mature Capitalisms are avoidable, dangerous, expensive, and correctable, but this responsible rebalancing is impossible where Constitutions are too weak
- Large Democracies empower well-funded groups 100%. Most of these groups forward collapse policy and harmful ideology entirely (Wealth theory – Right, and Feminism – Left)
- Foreign SuperPACs and nations can sponsor politicians and weaken, divide, and literally dumb down entire nations
- Elected power permits governing groups to hide reports of collapse(whenever weak Constitutions permit this)
- Power permits indoctrination of harmful ideologies as real, often in an effort to retain power for unqualified “leaders”
- Large Democracies are easily controlled by Oligarchy (Merchant Class) due to Businesses’ control of the great majority of revenues in Monetary Systems
- Ballot Cards fill with Collapse Policy Political Parties as they place barriers to entry for other groups to run against them; chiefly financial supports
- The highest voting segment are seniors (80% vote), and these are the most expensive to reach with messaging due to incredibly high TV advertising costs
- Homelessness – is a Democracy problem and not seen in pure Monarchies today
Solutions
Today, pure Monarchies are the most productive form of government, outpacing the G7 for 25 years without homelessness, income taxes (in many cases), with healthcare costs, education costs, and often higher Social Contracts as well
Can Large Democracies turn around their present 90% collapse?
Yes – Every Problem is Solvable
- ACT Parties – ACT is a thesis political party that can be run in every democracy. ACT is constrained to forward Advance Policies 100%
- Civic Science Certifications for Political Parties – ALL political parties must be Certified to forward Advance Policies 100% (proven successful and monitored)
- Advance Policies – in Transition Economics, Advance Policies are proven in data science and history to create advancing nations
Easiest is: 2,1,3 Highest Probability of Turnaround is: 1,2,3
The Honour for creating the greatest turnaround and economy in history goes to Franklin Delano Roosevelt. He used the following scientifically proven Advance Policies:
Vote only for proven-sustainable Advance Policy – anything else is socially irresponsible
Finance Industries
Finance Industries are Good for a nation to a point, and then harmful after that point
A Stock Market, for example, benefits the 90 countries that have one, even though the performance of those stock markets is unimportant
An IMF Study and Financial Development Index confirmed in 2015, that once the size of this industry exceeds GDP, it becomes a reliable burden on any nation
The combination of a large democracy (90% have weak Constitutions) with an over-sized Finance Industry, creates an expensive, usually-hidden, and usually-ignored reliable national collapse
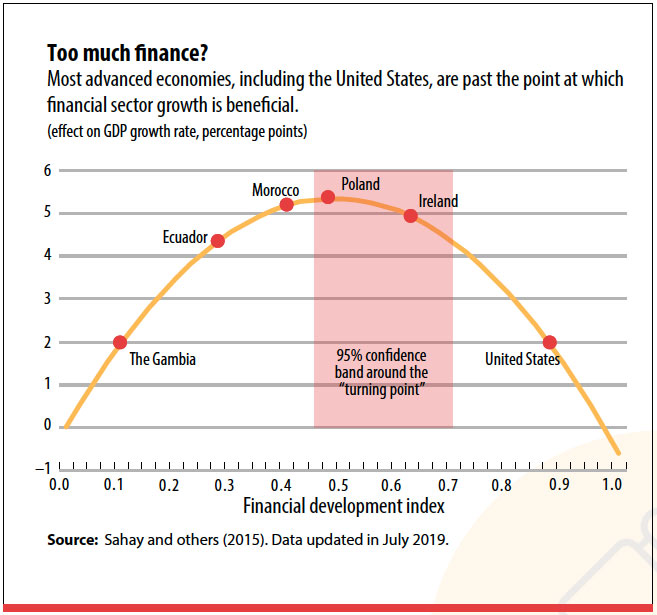

Free Speech
Free Speech is lauded as an essential human right in some countries, but is it? America has this right in the Constitution – but is collapsing
See also: Blocked & Hidden Reporting
Criminal Legislatures
What can we prove is important or essential about this “Right of Free Speech”? What is it about Free Speech that we actually do need here? Consider …
Should we be free to lie to one another? No
Free to teach children harmful ideologies instead of science (reality and truth) – for votes and for power in collapsing Oligarchies called Democracy? No
Should we have to vote based on media or political messaging paid for and authored by agendas (propaganda and indoctrination) with $6+ million in public money daily, or by wealthy individuals, corporations, and business lobby groups – that hide reports of our national collapse and depopulation for fear of not being reelected and defunded? No
Should we be free to spend $6 million dollars of public money daily to hire thousands of social media workers to voice non-science and harmful ideologies as real and important, and to ban leaders and experts from being heard, or hired, or granted loans and prizes, and to hide important facts and reports from the public light – in a cancel culture? No
And alternatively, should science (provable reality) be banned when its messaging does not agree with a consensus of opinions? No
Truthful Free Speech
The Canadian CCRF Charter of Rights and Freedoms defends “Freedom of thought, belief, opinion, and expression, including freedom of the press and other media of communication” and then adds that these rights are not absolute – and can be limited as demonstrably justified in a free society
A political party’s recent Bill C-11 oversteps much further to ensure that all messaging must be presented by approved government websites, while they authorize $2 billion annually ($6 million per day) in taxpayer income to a CBC that has been caught lying, siding with political messaging (that there are six genders, war in Ukraine must continue, that War Measures invocation was justified for a Truckers Convoy, etc.), and it also hides reports of the Canada’s collapse
Harmful ideologies like woke political correctness, neoliberalism, or feminism’s DEI diversity and inclusion hiring laws – can win elections and power from voters who have no civics training – and have no training in what they must stand for, but these policies collapse economies and create national infanticides reliably. The only way for these groups to be re-elected is through indoctrination – teaching voters and children that their ideologies are important – and actively hiding the reports of their national collapse
Religions teach civics using teaching tools and a belief-based teaching approach, which was proven essential for illiterate populations – for millennia. We are literate and educated today, and we are also allowed to break or ignore belief-based lessons and law trainings, until evidence-based training in civics is vitally important again
Without evidence-based or belief-based civics, we can’t know what to stand for – and traditionally, harmful ideologies have always tried to fill this gap. Hedonism, feminism, neoliberalism, libertarian – are anti-civilization policies that create dumbdown, weakness, and division. We are not warned against these false idols today, and where people can be convinced to vote for them, they are indoctrinated to children and adults also
A handful of nations protect religious teachings (belief-based civics instruction) with blasphemy laws, so evidence-based civics training is important to understand and teach
We have the data to prove how to build a scientific, reliably successful nation, but we lack the protections in democratic Constitutions to protect our teaching infrastructures from these indoctrinations
Importantly, we also have a scientific Knowledgebase and Standard of Research here at WAOH to catalog harmful Collapse policies versus Advance Policies
Obviously, Freedom of Truthful and Important Speech – is important, but how do we ensure social benefit (Common Sense) and reality is presented by the speech that we permit to be broadcast?
WAOH invites interested evidence-based researchers to propose a solution for this topic
Blocked and Hidden Reporting
A Hidden Report can confirm truth as well
A truthful report of all results of government policies is important, but these reports are easily hidden whenever they harm an Oligarchy’s chances of re-election and retaining power.
Examples of important reports that are omitted, blocked, or hidden from the public, create a long list in today’s mostly collapsing and depopulating Democracies
See also Collapse Motivators
Criminal Legislatures
Try to find:
- A Chart that shows premature birth and stillborn rates before and after COVID vaccination? We know that premature births are on the rise in recent years, so why is this true in nations where prenatal healthcare has never been of a higher calibre in human history? It may have nothing to do with COVID Vaccination, but no charts confirm a conclusion that would be a benefit to pharmaceutical companies either
- United States media reported a “Measles Outbreak” – in the news. Why are news reports of vaccination hesitance, not broken out? Parents might permit their children to take tried and tested measles vaccines, while refusing potentially-dangerous COVID mRNA vaccinations
Why is the reporting of controversial COVID Vaccine Hesitance not reported separately from decades tried and tested Measles and Polio Vaccines? - A chart or credible report of the number of deaths SAVED BY versus ATTRIBUTED TO Covid Vaccines
- A study that wasn’t defunded before confirming an obvious link between spiking Autism birthrates and Female Equality in the workplace. See Autism
- …
GDP
Politicians use GDP because it hides problems, so it is far from a good indicator
GDP counts inflation, “bubbles” (housing, rent, stock market, etc.), and business profits in Sales Economies as “Production”, so there was little chance of this being a credible measure of Gross Production. This is probably the reason why it ranks 2000th in Transition Economics‘ indicator surveys (See the TE button below)
In 220 national GDP reports, only 3 to 5 will show negative annual values typically; and the World’s GDP reports have shown a negative value only once or twice in the last century
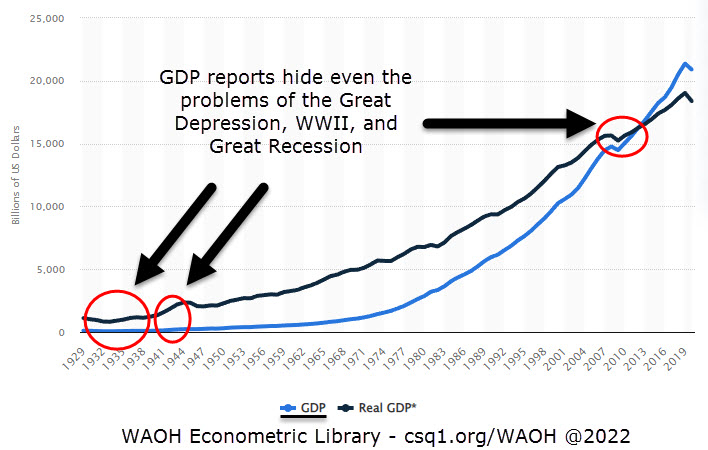
What are the most scientifically important indicators of national economic advance and collapse? WAOH’s Data Science page explains those here
Variants and comparison of the unimportant GDP Report, IS important; like GDP-PPP per Capita, GDP-PPP, and GDP Growth (Production AND Productivity)
Comparisons between Nations
Unimportant GDP is only interesting as a comparison measure, and important GDP variants are made more important when context is added, comparing nations with regional or economic similarities – such as seen here in a comparison of GDP Growth between top performing China – and the 25-year lower performing G7 nations
National Productivity – China is mimicked by dozens of countries that have outperformed the G7 for 25 years now
See also: Production
GDP per Capita
SCP Reports
Government Systems
Circa (around) 325 BC, Aristotle explained three GOOD and three EVIL forms of government:
Good systems are systemically empathetic and reliably advancing. “For the people…”
-
Monarchy
-
Aristocracy
-
Polity
Evil systems … systemically unempathetic, corrupt, and collapsing
-
Tyranny
-
Oligarchy
-
Democracy
Definitions:
- Monarchy – ALL accountable monarchies today have outperformed the G7 for 25 years with free education, free healthcare, no homelessness, often no income tax, and have the richest citizens in the world Per Capita-PPP (adjusted for national cost of living parity)
- Aristocracy – empowers an educated upper class with regulations ensuring human rights and keeping financial inequality within reasonable and productive limits
- Polity – empowers the middle class with regulations (a Constitution, Bill of Rights, and Criminal Code), ensuring human rights and that financial inequality is kept within reasonable, productive bounds. “Republics” are not Polities, and can never claim to be without a full set of human rights protections (see FDR’s Second Bill of Rights).
- Tyranny – Authoritarian Dictatorships with no regard for human rights and financial equality, always drive down production to a fraction of its capability
- Oligarchy – empowers wealthy merchants without regard for human rights and financial inequality
- Democracy – empowers a majority (of voters) to deny the needs of a minority, based on their wants. Democracies have starved neighbours to death – in many examples through history. Large-population Republics attempt Polity (populations greater than 20 million), but devolve into (evil) Democracies and Oligarchies in most cases (without FDR’s Second Bill of Rights). Whenever Constitutional protections do not ensure essential human rights, you live in an evil System of Government that will collapse reliably
Aristotle’s Systems of Government is simple and accurate. To see how Western academia instructs its students … see Wikipedia Government Civics
No Evil Government survives
through history
We are not taught that Evil Governments falter reliably. Whether neighbours rise against them, or revolution topples them from within, these nations are always torn down – with unnecessary, preventable death, poverty, suffering, as part and parcel of the transition in any collapse
A World of Confusion
Here is Wikipedia’s Systems of Government explanation page, and good luck making sense of the compost pile heaped on us and our kids so that we can make responsible voting decisions with
Happy Planet Index
Happy Planet Index shows no economic benefit. Evidence-based validation is important

Hate and Hate Laws

In collapsing democracies, hate laws defend election fraud (millions of low-compatibility immigrants supported in close-race electoral swing ridings – to win permanent power) and the high treason of politicians depopulating the country with female hiring ideology campaigns.
- When responsible citizens object to policies designed to create election fraud, hypercompetition, acts of war, and division within the nation (to sway votes based on harmful ideologies), they can be accused of hate or, in extreme cases, of hate crimes.
- When men object to menstruation kits in men’s washrooms (gender theory child abuse that creates 8x suicide rates and major school shootings), pride flags in public places and schools, they can be inappropriately called “haters”. When parents object to transvestites in their daughters’ change rooms, or in their children’s nursery schools, parents are wrongly accused as guilty of “Hate”.
- In some countries like the UK, it’s a “hate crime” to press the like button on a social media article, and 12,000 have been charged while 150 were incarcerated for multiyear terms. To object to genocide in Palestine, is called hate and antisemitism, and will see people arrested in Israel and other countries.
See also: Pride Flags
Ideology
Ideologies
also called Harmful Ideologies and
Ideology War
False Idols
Deep Fakes
See also Free Speech
2700 years ago, our most well-known civics textbook the Bible, warned us against the consequences of adopting proven-failed theories and utopic ideologies as truthful and important. Protection from false definitions of good behaviour and good values, which could be indoctrinated in our schools from kindergarten with swastikas and pride flags, were the first two Commandments and Laws of any sustainable society. Yet today, provably harmful ideologies compose most of our political vernacular and civics training in 48 (90%) of 54 collapsing large Western nations.
Harmful Ideologies are incredibly unfair. They ask us to believe them – using perfectly reasonable-sounding phrases – while they lie to us boldly or omit our learning about the true, harmful consequences of their motives and actions. They abuse our good and charitable nature, while they collapse our societies with the most serpentine and dishonest means imaginable.
Pretty words are not good values
Pretty words are not good values, as the case studies below explain: multiculturalism, immigration, female equality, women’s rights, affirmative action, diversity, all hide devastating consequences, including high treason, crimes against humanity, poverty, destabilization, decapitating best-and-brightest leadership, and war. This is probably the reason that a snake’s forked tongue has depicted lying politicians for millennia.

Even George Orwell couldn’t imagine many of the nonsensical, anathematic creations of recent Ideology Wars in Western nations – tampons in men’s rooms, cross-dressers reading to pre-schoolers, pride flags in classrooms, and coordinated Criminal Legislature corruptions.
We must validate the stories presented to us as true, and also remember the age-old wisdom:
“Fool me once, shame on you. Fool me twice, shame on me”
What sets an Ideology War apart from simple indoctrination is that in an Ideology War, an army of people is called upon, or invited into the country, to defend harmful ideologies such as millions of immigrants pulled into swing ridings to create election fraud and job market income disruption. In Canada, for one example, millions of low-compatibility East Indian Sikhs out-number all other immigration applicant groups 10 to 1, with publicly funded Great Replacement plans to depopulate the country while also outnumbering the current population. In populations of 30 million, 70 million new Liberal and NDP-voting immigrants are planned by 2030.
Learn about how education and a Civic Science like Transition Economics works very differently from harmful ideologies and indoctrination to advance whole societies reliably by validating what is true, what is not, and what is harmful too.
“When you don’t know what to stand for, you can fall for anything”
Harmful Ideologies
by Lethality
The Bible’s #1 Rule of Law – As explained above, utopic, alternate depictions of Good and Good Values can never be permitted in any society. God is not a deity in the bible; God is Good – in our actions and in our laws. The Ten Commandments’ number 1 law is “No other Gods” or “No False definitions of Good”, explaining that Harmful Ideologies can never be permitted in any society.
The Bible’s Second Rule – “No Graven Images” instructed that no imagery of harmful ideology should be permitted in public, in schools, etc.
In civic science, some Harmful Ideologies (false definitions of Good) have been far more lethal through history than others

#1 Woke, DEI, ESG, “Far Left”, Liberal, etc.
Feminism and the Female Vote easily creates the greatest cull of human life in history today. Sponsored by GFANZ (a 42-country, 430-bank, $130 trillion globalist oligarchy – that easily buys elections), WEF (World Economic Forum), and the United Nations, all high-income Western countries find themselves under attack by DEI / Diversity, Climate, and Wealth Theory indoctrinations that cost 64 high-income nations 1.5% of their populations annually, equal to the twice the losses seen in WWII Europe
Total human losses by this ideology today dwarfs WWII’s 6-year, 60 to 80 million casualties – EVERY YEAR
See also Fertility – and the United States loses 1-in-3 of its children to abortion today
Respect of Women is essential and good values, but you don’t respect anyone by filling offices with women and erasing a nation and culture’s future

#2 NAZIism
80 million lives were lost (40 million to war and 40 million to starvation and disease) to WWII’s pursuit of a NAZI Arian Master Race Utopia – headed by Adolf Hitler

#3 Libertarian, Neoliberalism, Wealth Theory, “Far Right Wing” Conservatism
Libertarian Herbert Hoover used “Rugged Individualism” theories to starve to death millions of Americans between 1929 and 1933 – in the United States alone. Libertarians are the reason that no Republican GOP Government (Congress, Senate, or President’s office) would be elected again for 25 years in the United States- after Hoover
Neoliberalism Wealth Theory (Milton Friedman, Thomas Sowell, Hayek – Micro and Macroeconomics) is taught to every university student as mandatory reading in Western nations today. What is the performance of these nations? 90% (48 out of 54) are collapsing
Archie Bunker’s famous “Those Were the Days” theme song was both an irony and a satire. The music of the song was composed in a 1920s and 1930s era when no American in their right mind would vote for another Libertarian or Neoliberalist for the next 25 years. The GOP had just created the Great Depression and starved Americans with 80% unemployment rates in some states.
Americans were shared stories about “soup kitchens”, but the reality for millions of Americans was much more severe, and thousands?, tens of thousands?, no numbers survive to explain those who perished from starvation – in the “richest country in the world”.
By the 1980’s, Americans had completely forgotten the 1930s deaths and Hoovervilles, so Mary Hopkin’s 1968 lyric could bolster Western Universities to once again accept donations from Oligarchs who asked them to forward “Greed is Good”, Wealth Theory, Micro and Macro Economics curricula

Cure the Disease
of Ideology
The Complaint Letter to Municipal, Regional, State, and Federal politicians who support ideology and collapse
You must fight the cause (the cancer), and not just the symptoms
Fighting symptoms while ignoring the root problem accomplishes little
- Supplying food banks without solving the human right to a good job
- Buying Christmas presents for poor children without ensuring that every child has a family whose household head can secure sufficient income support for his family
- Failing to support the human rights of a home, a good job, good education, sufficient pensions, healthcare, …
CSQ Research realizes that it is weak to voice problems without also explaining a solution. The following “Cure for Ideology” letter is an action that you can do right now…
- Download The Letter – click here
- Click on each image, download the full-sized graphic files, and then attach them to your letter:


- Send this letter to Regional and Municipal government leaders in your community today.
- Click on Siege and support the CSQ Federal Court Case against Election Fraud, High Treason, and Crimes Against Humanity in Canada
This Cure for Ideology letter is an easy and effective information-sharing approach that includes a call to action important to your community and your council members and mayors. They are continuing a track record of irresponsible behaviour when they ignore this call.
Harmful Ideology
Imagery, Symbols, “False Idols”
This is an accordian view of what Harmful Ideologies and False Idols look and sound like today…


Harmful Ideologies
In Alphabetical Order
- Accountants are Leaders – Accountants, MBAs, Business PhDs, etc. are trained in Wealth Theory-based practices with zero regard for economic collapse or advance, so they create collapse reliably through ignorance and tactical quarterly or annual reporting focuses (see Collapse Motivators). Procurement processes have resulted in 1930s levels of production and broad collapse across 207 nations today, and accountants work in consulting organizations and hiring networks that appoint themselves to boards, senior roles, and similar. Leaders, in contrast, are Expert System Builders, which is why Elon Musk has led the Auto & Space Industries in recent years. This is also the reason why the Cold War created the greatest period of innovation in history

- Actions – are not thoughts and not words. Actions are different than thoughts and words. Although thoughts and words might not be as good as we like, only actions should be measured and held accountable. Good Thoughts, Good Words, and Good Deeds are goals that every society should work toward – through productive human rights, justice, and equality. These are never achieved by legislating and enforcing harmful ideologies
- Affirmative Action – An early form of DEI and dumb down that replaced managers in engineering departments with race and immigration-status individuals. This dumbed down the workplaces that built things and discouraged our best and brightest experts enough to leave STEM fields for more financially and upwardly mobile and rewarded careers
- Business is Important – 70 years ago, businesses created the greatest economies in history while today they collapse nations reliably whenever they can influence regulation setting (accomplished with political party election funding as seen routinely in large democracies today). Business is only important when it produces and monetizes the resources of a nation; when it pensions and pays living wage salaries to the heads of families and households, and otherwise behaves strategically to grow both economies and human advance
- Banks are Important – Businesses are only important when they assist the nation’s production and productivity. Business Profit is not economically important to an economy, so Banks must ensure the success of production nationally, or we are better served by a responsible system of Digital Currency that replaces expensive, unproductive, and parasitic banks entirely
- Business Profit is important – Although important to an individual business, business profit is not important to an economy. Is harm caused by this ideology today? Yes. 90% of democracies are collapsing today, created by Businesses that can buy their way into election campaigns and then dictate to governments that this indoctrination is true and that public funds can be used to teach this indoctrination in schools – see Wealth Theory
- Cancel Culture – see Cancel Culture
- Capitalism – unregulated capitalisms create(d) Great Depressions reliably, and regulated capitalisms created the greatest economies in history; the word “capitalism” is meaningless as the regulation of business and finance policies is what creates human and national economic advance reliably
- Climate Dysphoria – Chicken Little. Individuals indoctrinated in harmful baseless ideologies can become fearful and harm themselves by accepting unscientific claims of religious or marketed falsehoods. Greta Thunberg is an example of what can happen when children are abused by ideology stakeholders and turned into zealots for media as propaganda. See also Climate and Carbon Taxes
- CO2 Carbon Dioxide – see CO2 and Desertification
- Communism – see Marxism
- Democracy – 90% of large democracies are collapsing today – due to insufficient constitutions. Any system of government that is not advancing a nation needs to be revised until it does, and unfortunately, large democracies are the most difficult type of government to change and correct. This causes a reliable collapse and great suffering every 60-years due to compounding inflations and imbalances between cost of living and incomes – in weak-Constitution democracies
See Platitudes - DEI – Diversity, Equality, and Inclusion is a Business Lobby assaulting living wages, eliminating family pensions, preferring offshored workers, and dumbing down and devaluing governments and businesses nationwide. DEI was a precursor to more extreme ideologies like Gender Theory. See also DEI

- Depopulation Theory – a lie that says that the earth cannot support its current and projected population, and so it must be depopulated as quickly as possible. No science supports this harmful, even murderous, fiction. Many Hollywood films tell and retell this theory- from Avengers to Dan Brown’s Inferno, Wall-E, Soylent Green, Interstellar, Logan’s Run, and Star Trek – and many others.
- Depopulation Theories – are a family of harmful ideologies that create a reliable depopulation in any nation. DEI anti-family-values, anti-community, anti-expert, and anti-culture indoctrinations, reduce any population by 1.5% annually (the same loss as NAZIism’s depopulation stats in WWII Europe – see fertility) while Poverty and Inequality will reduce longevity and increase suicide rates that harm populations further. The earth can well support human populations many times today’s size, as evidenced by Java in Indonesia which supports 100 million people on an island the size of Cuba. Groups that work to implement this Theory commit a Crime Against Humanity and can never be confused with responsible leadership. See Case Study: A Gender Equality Genocide

- Diversity – See also DEI. Diversity is an anti-merit, virtue-signaling business lobby that drives starvation wages, the end of family pensions, culture (in Canada certainly), and racism that hires, lends, grants, immigrates, onshores, or offshores cheap labour, based on race, gender, religion, and sexual orientation
Canada’s Business Corporations Act Laws make a local-born 20-year male expert the last possible consideration for hiring and male suicides have become the highest in the G7 within just two years of new Liberal government laws, where Female Equality ideologies won elections. In Bar Associations and Human Rights Tribunals across Canada, committees filled 100% with women, gays, trans, activists, and oddballs – calling themselves a Diverse governing body, while they were, in fact, anything but diverse - Division – Harmful Ideologies are often seen to divide a nation, which is never a good practice. Good values are Good actions, Respect, and Human Advance – for everyone. Examples of Division are – by:
- Religion – Civics Training
- Language
- Race
- Gender
- Credentials
- Indoctrination
- Wealth/Income
- Entitlement – A term similar to Fairness below, used by an ideology to suggest that we are innately unaware we have it better than others when a ubiquitously human trait makes us all believe that we are treated poorly, unfairly, etc. at some point. This is as true for Trust Fund kids as it is for orphans, white, black, male, female, Christian, etc.
This is why human rights are so important, to ensure that mistreatment is never permitted within a society and that our “feelings” are not our reality in regard of our fundamental human needs. - ESG – Environment, Sustainability, and Governance – is the Finance Industry’s DEI for investment. It embeds Woke Globalist goals into finance and investment decisions with the following impacts:
- DEI – Depopulation, Genocide, Infanticide, Suicide
- Anti-fact and anti-science – Carbon Neutral, Carbon Tax, etc. create irresponsible poverty and desertification. CO2 global-warming fictions are the furthest thing from science
- No Civic Science is used in this Greenwashing and economically harmful Business Profit-focused indoctrination entirely

- Fairness Doctrine – DEI and Race Theory often call their actions “fairness”, when these policies are harmful and contribute to broad collapse
- Feminism – anti-family-values insist on double income traps, hiring, granting, and educating based on gender; masculinity is toxic; men are narcissists; and this ideology reliably creates a 1.5% annual population loss with 40+ serious social problems
- Female Equality – See Depopulation Theory. Equality here mandates the equal hiring of males and females at all levels with equal pay. This policy creates:
- a reliable Crime Against Humanity, infertility-led annual depopulation loss of 1.5% for any population
- Anti-male – the ideology removes men and experts from workplaces entirely in many offices, from incomes, and family pensions.
- Ensures a 30% caregiver community is impoverished entirely as the elderly must be cared for in blindingly expensive private senior residences with often egregious health and neglect conditions.
- Men commit suicide .78% more for every 1% of unemployment, so this and diversity made Canada the highest male suicide in the G7 in just 3 years (by 2019)
- Drives Divorce, teen anxiety, and euthanasia to reliable record rates
- Freedom – EVERY harmful ideology claims to ensure important freedom, to be modern, progressive, ethical, and moral, but harmful ideologies offer the opposite in reality. See Freedom
- Gaslighting – manipulating ones perception of reality or values so as to suggest another harmful ideology or theory – see Cancel Culture
- Gender Theory – There are six genders because our gender is whatever we think it is. Pronouns now announce our gender as we prefer. Young children should be conditioned to respect transgendered individuals as normal and as a human right. Women must share washrooms and changerooms, and compete in sporting events with males if they self-identify as female. In reality, no one has the human right to lie to others – or themselves, and a population that loses 1.5% of its population can not responsibly encourage homosexuality in their emotionally and biologically impressionable children and young teens.
See also LGBT & Gay Rights - Gender Dysphoria – indoctrinated teens can insist that their physical gender is unbearable and that their sex (reality) must be altered. Cases of 14-year-olds having their breasts or penis removed are the result where legal indulgences are permitted – as in Canada, Netherlands, and similar. Gender surgery recipients experience five times the suicide rate of any other group.
- Graven Images – The Bible’s Ten Commandments updated Ur’ Nammu’s Constitution. Its Second Law forbids symbols of harmful ideologies- per the First Law

The Code of Ur-Nammu (2100 BC) became a cornerstone foundation of Mosaic and Canon Law fully 1400 years after it was recorded on a ceramic cylinder. Cyrus the Great used a similar cylinder printing device to list the first Bill of Rights in 539 BC. Our civilization used printing machine cylinders to hold typeset newspaper pages from 1880 to 1970. Read more: The Book
- The NAZI Party of Germany created a 1.5% annual depopulation across Europe during WWII with a Swastika Flag
- Today’s Globalist Woke DEI Feminist Parties create a 1.5% annual depopulation in 64 Western nations today (the largest depopulation “cull” in human history) – and nearly all of these groups endorse Child Abuse through the Pride Flag’s irresponsible use in grade schools – Citation Wikipedia
 Tampons in Men’s washrooms, Transvestites in gender-separated sports events, His/Her/Them Pronouns, Hate Crimes Laws, and many other examples became symbols of feminism’s and LGBT’s ideologies.
And there are hundreds of similar examples of conquered ideologies throughout history.
See also LGBT & Gay Rights
- Gun Dysphoria – the USA Second Amendment states clearly that citizens may own guns only if they are part of a formal militia. Politicians agree to misread this law for votes and for power, and today’s crime and murder rates explain the dystopic conditions and siege mentality that armed citizens take on
See Guns Kill People - Hate – In collapsing democracies, hate laws defend election fraud (millions of low-compatibility immigrants supported in close-race electoral swing ridings – to win permanent power) and the high treason of politicians depopulating the country with female hiring ideology campaigns. When responsible citizens object to policies designed to create election fraud, hypercompetition, acts of war, and division within the nation (to sway votes based on harmful ideologies), they can be accused of hate or, in extreme cases, of hate crimes. When men object to menstruation kits in men’s washrooms (gender theory child abuse that creates 8x suicide rates and major school shootings), pride flags in public places and schools, they can be inappropriately called “haters”. When parents object to transvestites in their daughters’ change rooms, or in their children’s nursery schools, parents are wrongly accused as guilty of “Hate”. In some countries like the UK, it’s a “hate crime” to press the like button on a social media article, and 12,000 have been charged while 150 were incarcerated for multiyear terms. To object to genocide in Palestine, is called hate and antisemitism, and will see people arrested in Israel and other countries.
The term “Hate” is far too often used to defend ideological nonsense and control, and is used by globalists to weaken whole societies - Inclusion – is hiring for fit (“fits” are followers who think with the group’s consensus); also called dumb-down, anti-merit, anti-expert, anti-leadership. Consensus-based thinking explains Flat Earth Theory, Creationism, “Angels are real”, and similar nonsense (non-science) as it encourages junior people to hire only themselves basically, so it devalues businesses, and governments, and weakens entire nations
- Left – Left AND Right are both harmful ideologies. Left voters tend to prefer feminist anti-family values and hiring laws presented in “Girl Power” campaigns that create an infanticide of 1.5% annually in 64 high-income countries – for votes and for power. These programs can easily find funding and support by competing nations or global destabilization groups to undermine a nation through division. Right and Left governments create reliable collapse so an important component of their time in power is to hide collapse and indoctrinate voters into believing that their nonsense theories are real.
- Libertarian – suggest values and “rugged individual ethics” that see neighbours freeze to death ignored. The most famous Libertarian was probably the Archie Bunker theme song’s Herbert Hoover who took a 7% unemployment nation in 1929 to 32% unemployment (80% in some parts of the country) no doubt killing and starving to death millions of Americans until he was voted out in 1933. The GOP couldn’t win another election in the US for 20 years after this ideology was fully understood.
- Marxism – Marx composed unscientific theories that explain how sweatshops are a necessity and a benefit to strong economies, and that proven-failed theories (fictions) like Capitalisms, Socialisms, and Communisms are real, working systems of government as well. Marx’s harmful theories were not real nor systems of government in any way. No Socialisms exist today – as evidence of this truth, but these ideologies appealed to industrialists who forwarded them to argue that their personally profitable Oligarchy was important. 2000 years ago, Aristotle very correctly explained that the three evil forms of Government are Tyranny, Oligarchy, and Democracy. See Civic Science and Republic
- NAZIism – killed people based on race and creed, and created a 1.5% annual population loss
- Neoliberalist Conservatism – vaults values and ethics that prefer the interests of wealthy people; Oligarchies
- Oddballs – minority political groups in Canada formed a coalition government of separatists, offshoring lobbies, and feminists, to embed almost every harmful ideology on this list in the 2020s, inspiring our term “Legislation by Oddballs” and Ideology War
- Offence – a discussion or thought that one doesn’t like personally, does not make that topic offensive to all. Your personal feelings are not a universal truth. Child-like absolutes and labeling are seldom considered examples of impressive intellectual capabilities. Labels include sexist, misogynist, socialist, communist, etc.
- Open Borders – Immigration, both legal and illegal, during times of mature capitalism imbalance, creates destabilization, hypercompetition, and is often motivated by democratic election rigging (the corruption of democratic systems to secure power) – see also Immigration and Election Fraud
- Politically Correct – see Cancel Culture
- Professors are Experts – When an Engineering Professor teaches proven physics or material science that advances humanity; he is an expert. When an economics professor teaches proven-false theory that collapses humanity – as truth and reality, he is not an Expert; he is not an Educator – he’s an Indoctrinator. 75% of university degrees are issued by Civics faculties (Law, Economics, Business, Finance, Education, Government, and Social Studies that collapse nations and harm society reliably – by teaching false ideologies instead of reality. An expert of fiction is an expert of nothing. See Education Reform
- Race Theory – says that we are all born racists, which is nonsense. Racism is a learned behaviour that requires enablers and indoctrinations to grow. Values of Good, Respect, and Human Advance ensure the problem can never exist in the first place
- The Great Replacement Theory – without a clear “melting pot” cultural integration approach – and with no responsible limiting of immigration during times of scarcity when a country cannot easily afford the burden of new immigration, any nation and culture will be decimated – read more.

Replacement Theory can have different definitions:
-
- The replacement of White Citizens
- The replacement of English, French, or other identifiable groups
- Reproductive Rights – Feminism and Feminist Election Campaigns create a reliable depopulation of 1.5% annually in 64 high-income countries. Women ensure the collapse of their communities, country, and futures for their children, whenever they vote for and teach harmful ideologies. In this example, the fear that a women could lose control over her own body is used to secure votes by unconscionable, deceptive groups that already hide a guaranteed Crime Against Humanity depopulation, so there is every probability these low integrity individuals will use elected power to propel wars that profit them, will continue harmful ideology indoctrinations in schools, will hide and ignore human rights like homelessness and prosperity, and will favour profit over responsible governance as is needed to pay for and win costly election campaigns.
- Republic – is a democracy governed by a Constitution, but without sufficient protections and assurances of human rights – as seen in the slave owner written Constitution of the United States, a Republic is effectively a Democracy – wherein the rich can vote to imprison or let poor citizens die. Democracies devolve into Oligarchies in nations with populations over 20 million, and both Oligarchies and Democracies are among Aristotle’s Evil Forms of Government. Read about FDR’s Second Bill of Rights, which corrected America’s Constitution and turned around the Great Depression to create the greatest economy and nation in history – until his inequality laws could be dismantled by Reagan in the 1980s.
Sadly, for everyone today, FDR passed away before being able to correct the Constitution of the United States formally in 1945; this would have surely been the 22nd Amendment had he survived the US’s victory in World War II, - Right – is neoliberalist conservatism, a harmful ideology that created the Great Depression in just 10 years when the GOP held Congress, Senate, and the President’s office after 1921. “Right and Left”‘s back-to-back elections have created a reliable, avoidable, expensive national collapse for 40 years now. See Solutions below which explain ACT thesis political parties like ACTCanadian.com and ACT Certification and Monitoring Programs that ensure proven Advance Policies only
- Scientocracy – Running a society with science is a good or bad thing. Example: the Roman Catholic Church through the Dark Ages
- Sex Education – similar to Affirmative Action, today’s DEI, Gender, and LGBT school indoctrinations began in Sex Ed class. Sex Ed is not taught in a great majority of nations internationally, and has turned from discussions of health and family values into classes that create a surveyed 20% non-heterosexual GenX student body in 27 countries today
- Socialism – see Marxism

- Sustainability – Not to be confused with material sciences and circular economies, the term Sustainability is used to forward harmful ideologies in corporations worldwide today. Chief Sustainability Officers, Courses, and Certifications ensure ESG and DEI ideology and corporate policies that benefit economically meaningless business profit while installing Gender, Race, Climate, and Wealth Theory. The policies dumb down and devalue businesses and governments by removing 20-year experts and men from the workplace, therefore removing family pensions; they favour offshored and minority hiring and election fraud, create double-income traps that ensure a reliable 1.5% national infertility and depopulation cull, and so on. See DEI, ESG
- Technocracy – Running a society with technology is a good or bad thing. Example: Mennonites, Cold War Leaders in the USSR and USA
- Wealth Theory – Starvation Wages – Micro and Macroeconomics – Businesses today are purchased by Private Equity dealers, loaded down with debt, simplified into SOPs (often for performance monitoring or company resale purposes), and then use unsustainable accounting principles and measures to reduce living wages to starvation wages, to ignore pension obligations, to cast out unions (worker and expert empowerment), and they also use harmful diversity, offshoring, or onshoring hiring practices to prefer cheaper, non-expert, non-leader commodity labour. This makes the “winners” of this race toward total collapse, Kings of a Molehill. Everyone loses in 207 nations that are today losing an average $4 billion daily.
- Woke – is behaviour that embraces any mix of harmful ideologies in combination
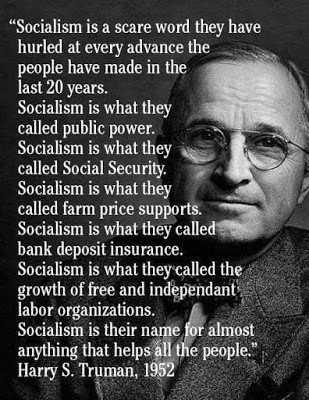
Ideologies in History
Nations don’t collapse by themselves and for no reason. Multi-billion dollar election campaigns teach unscientific, unmeasurable, meaningless Marxism (capitalism, socialism, …), Individualism (Cold Indifference – to the suffering of neighbours), Libertarian Neoliberalism (the failed economic theories of the 1920s – didn’t end well), Reaganomics, Transition Economy, Feminism (creates infanticides in 64 high-income nations), Division by Left and Right Oligarchies, race, creed, or gender; are all examples of the proven-failed political ideologies of the 1920s
The Bible – is scientific, based on observation, and saw that anti-family values and religious dysphoria supporting harmful ideologies in falling societies. It called economic powers that supported these ideologies “the Beast”; and warned us not to be fooled by false claims of modern, progressive, and more moral harmful ideologies

Marxism ![]() – is harmful, unmeasurable, meaningless theory and logic only – citation. Worse, these fictitious indoctrinations and terms strip us of our ability to conduct constructive discussions
– is harmful, unmeasurable, meaningless theory and logic only – citation. Worse, these fictitious indoctrinations and terms strip us of our ability to conduct constructive discussions
Why have Marx’s harmful writings survived? Like Freud, he was amenable to wealthy capitalists, like many of the more well-known philosophers today. Marx’s writings were sponsored for inclusion in teaching curricula by wealthy industrialists; indoctrinating students to believe that harmful, unregulated and unbalanced laisse-faire capitalism was not only socially acceptable but important and preferred too.
Freud, similarly, justified child molesters were the victims of a Seductive Child, and so on
The Bible, Aristotle, Franklin Delano Roosevelt, and other examples of great leadership and proven success in civics – will be hidden, with reputations tarnished, and won’t be taught in a collapsing nation, economy, and society
Inflation is not corrected by the theory-based belief of increasing interest rates, it’s created by allowing large companies that benefit from inflation, to price collude their prices for oil, wood, steel, energy, and so on
Regulation – stops inflation in its tracks immediately
The superyacht industry is booming in 2022 and 23, while the lion’s share of societies suffer from rising costs for food, transportation, supply chains, finished goods, etc. without corresponding balancing incomes
What are politicians doing? Are they fixing the inequality problem?
Clearly not. Politicians are instead blocking citizens’ abilities to hear legitimate reports of collapse and to coordinate and assemble in defense of their civil liberties. In Canada, there is Bill C-11, in the US it’s Social Media policing (audience-downsizing; “going viral” isn’t possible any longer), and all governments are increasing “mental illness” budgets (which used to be called social disturbances)
Correcting Ideologies
Voicing problems without explaining proven solutions is weak – and it isn’t leadership. Hiding problems – is worse, and hiding problems is the opposite of leadership also
Every problem is solvable, and the first step to solving a problem is recognizing that you have one
The Bible’s Constitution simply outlawed Harmful Ideologies (graven idols and other notions of good, morality, and good values = “other Gods”). This is an important oversight and correction needed by every Constitution today given that 90% of large democracies are collapsing owing to how easily they can be controlled
Oligarches often prefer the teaching of tactical (short-sighted) profit-focused Neoliberalist and Micro/Macroeconomic/Wealth Theory logic from Marx or Friedman. When Oligarches use political or financial influence to embed these proven-false, harmful, and belief-based curricula into our universities, feeder schools, and media; how do we correct this indoctrination?
- Right and Left political parties both use Collapse Policy 100%
 Correct with ACT Parties and Political Party Certification
 - Feminism hiring policies create reliable national genocides – for votes and power. Correct this with Family Values
- Diversity policies are used by Business Lobbies to collapse societies by eradicating family pensions and driving starvation wages, offshoring, and onshoring cheap labour Replace these programs with Respect and Full Employment
- Communism, Socialism, and Capitalism – are ambiguous belief-based-theory terms, harmful ideologies, and fictions that are NOT REAL 100%. See Transition Economics
- False Civics in our Schools – Civics Faculties of Economics, Business, Finance, Law, Government, Education, and Social Science do not teach science or reality today. Correct this with Scientific Societies Programs in every University’s National Leadership Faculty that performance manages (guarantees) the social benefit of all university programs
Impact
“Impact” or Social and Economic Benefit, is more railroaded than accepted in business today
Does the practice of Female Equality, which creates a reliable population genocide in 64 high-income countries, strike you as “progressive” or as a Crime Against Humanity – as it should?
Diversity – is an anti-merit business lobby that probably can’t believe its success in eliminating family pensions and hiring cheap offshore labour across dozens of large democracies today. Diversity welcomes election fraud low-compatibility immigrants into swing ridings by the millions, to overwhelm elections and guarantee permanent power to criminal legislatures. A female equality in hiring quota component of diversity, guarantees national depopulations doubling the rate seen in WWII Europe.
Inclusion – is anti-expert, anti-merit, and anti-leadership – hiring for “fit” (followers only), so that the dumbest oddballs can order around the smart, decent leaders among us
That’s not Impact, but that is what passes for Impact, ESG, etc in our grossly unsustainable business and academic workplaces and hiring offices today
Labour Force Participation
Labor Ratio is important for understanding unemployment rates over time
Unemployment reports don’t count anyone who is unemployed for longer than 3-months to 12-months. Past this time, they are simply are not counted any longer, so Labour Force Participation is an important stat. In the G7:
Canada-down 1 million jobs from 2008
England – lost 167,000 jobs since 2019
France – down 1 million since 2009
Germany – 565,000 less jobs than 2019
Italy – 1 million less than 1991
Japan – 2 million since 1992
USA – 16 million fewer since 2000
The distribution of Males to Females in the Labour Force is also important because female or double-income workforces create national infanticides reliably
Female:Male Labour Ratio Rises as Birthrates Fall in 94% (64 out of 70) of High-Income countries. Canada is 1.45 & plummeting
Lending Rates
< 6% Lending Interest Rates in High-Income Nations
Mortgage Rates
Lower mortgage rates show a higher number of advancing nations
Deposit Rates
Your Bank’s Consumer Borrowing Rate is their customer’s Savings Account interest or rate of return
LGBT
Gay Rights and Human Rights
Human Rights: Respect must be afforded to everyone as a building block for any successful society.
Homosexuality and Transgenderism are throwbacks to a billion-year-old evolutionary survival skill that gives humans hiccups, superfluous nipples and tails (human embryos have tails until their eighth week), and occasionally being gay
A young tween’s testosterone levels are physically impressionable, emotionally impressional, and manipulatable too by indoctrination in our schools
We know this because:
- Surveys prove that rates of homosexuality are higher in nations that widely promote homosexual lifestyles to children, and
- Homo sapiens (Humans) are distant descendants of amphibious lungfish and frogs. Some frogs have opposable thumbs and some can change their genders entirely, simply by changing their behaviour. Frogs can manipulate their testosterone levels by changing their behaviour, and we see this same ability in human studies where women can increase their testosterone levels (in clinical tests) by merely behaving like an authority figure

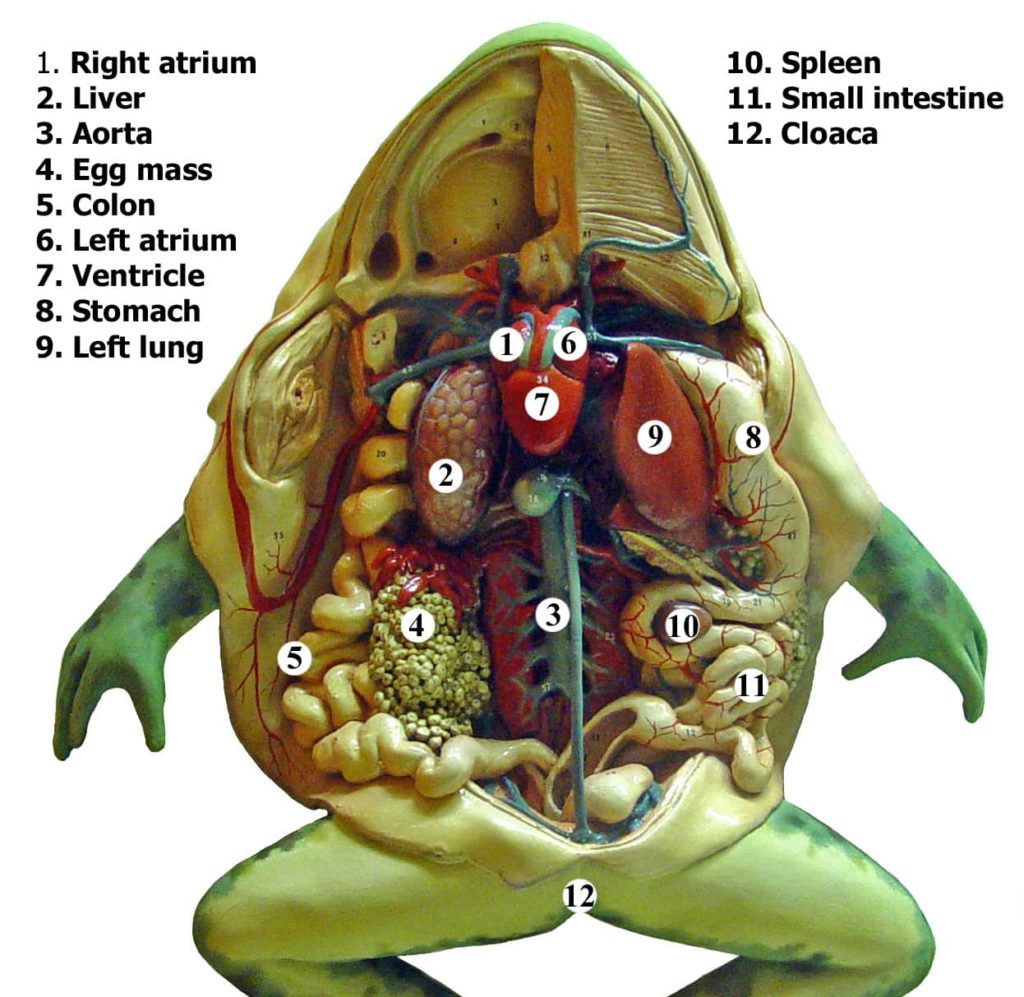


Today’s phenomenon of high-testosterone females, and low-testosterone teenage males, is studied for links to spiking autisms (a birth defect linked to high fetal testosterone levels) which have not previously been seen in human history
See Autism
Gay Rights: It is irresponsible for any nation to promote how “cool” is a homosexual lifestyle to its children. This is especially true for nations with unsustainably low fertility rates as is true in 64 high-income nations where 1.6 is the average while 2.4 (children per woman) is break-even. Discussions of transgender and homosexuality are for adults only – and not for young children at Family Day Pride Parades

WARNING: Political groups use Female Equality, DEI, Race Theory, Gender Theory, and LGBT Rights campaigns to win elections and power, and “Girl Power” campaigns work very well in 64 of 70 high-income democracies today. In these nations, reprehensible individuals willingly trade a Crime against Humanity for income and influence, and then use this power to hide all reports of the 40+ other serious economic and social collapses and national infanticides that these female-vote-winning policies create
Opportunistic political groups use their power to indoctrinate homosexual lifestyles in our schools, routinely without the consent or even knowledge of parents
Gender Dysphoria
Like any dysphoria, seeds of concern are planted at a young age and then nurtured to grow into irrational fears and panic later in life
Chicken Little’s dysphoria was Climate Crisis, and today 14-year-olds are having their breasts and penis surgically removed, sometimes without parental consent or knowledge, believing that their Gender Theory indoctrinations are reality and truth – when these beliefs most certainly are neither
There is NO “Human Right to be a gay child”
There are no
“Trans Children”

Children are impressionable both emotionally and biologically and can be swayed to believe themselves homosexual or any other excuse that protects them from bullying or loneliness
Gay influencers are child abusers. A child’s human rights are violated by indoctrination of transgenderism and homosexuality – both in schools and online
Why? Because any nation or community relies upon masculine males and feminine females, plus family values, for sustainable fertility rates of greater than 2.5 children per woman. This builds good values, productive homes, a strong national defense, and even survival. Throughout history, a nation of weak men with weak businesses and governments soon finds themselves conquered, while their women are traded for a pack of cigarettes a dozen times a day
Indoctrinations like “gay rights for children” and anti-family-values, denies a child’s human right to be safe from foreign interference, fails to protect him or her from national collapse, and fails to safeguard their important culture and future as a person and as a citizen in a strong nation
Groomers and Enablers
Medical doctors, teachers, parents, school board trustees, communities, societies, and lawmakers who enable this indoctrination and any life-changing transgender medical support to gender dysphoric children, can be safely viewed as groomers and enablers
Transgender Suicide
Transgender children have an eight times higher probability of suicide than any other group, and 80% consider suicide while 40% attempt suicide
Citations: NIH Medical News
Confrontation Tactics
This year’s first-ever “Easter Trans Awareness Week” and Transgender Storytime readings to kindergarten children are examples of Confrontation Tactics
Confrontations are in-your-face challenges, that on the surface seem like an approach used to solicit acceptance, in this case, of homosexuality or trans-sexuals in close proximity to work, children, schools, and families
Confrontation is also a technique used to expose leaders, those who refuse indoctrination and harmful ideologies, so that they can be identified, fired, fined, or incarcerated, leaving followers who will accept any instruction in charge of schools and office staff
There are no Homosexuals
Citizens forget quickly, that homosexuality is made and not born; it’s nurture, indoctrination, and also child abuse; and not nature or genetics
When indoctrinations are permitted to continue for a decade or two or three, entire populations can be surprisingly susceptible to reshaping – or even losing – their grasp of reality and truth
In a recent Public Broadcasting Systems (PBS) survey (1), Generation Zs are found to be report between 22% and 28% not-heterosexual, while Generation X and Baby Boomers report 4% to 5%
Similarly, polls show that 70% of Americans believe in Angels. But, does this mean that ghostlike Angels exist in reality? No, it does not
Reality – is what you, and I, and anyone else, can see and can validate for ourselves – as real. Angels – are not that…
“Angels” fulfill the important need of religions’ reassurance that lost loved ones and good fortune are still possible and that they will be with us again one day. Angels are important, and maybe essential hope, rather than mortal realities
With the right indoctrination (child abuse and incentivization) at times in our lives when we are vulnerable to “reassuring falsehoods”, the human survival skills of clinging to wishful or persuasive shared thoughts are powerful enough to change our understanding of reality and truth. At this point, we will defend our belief in harmful ideology, as we should only defend actual good values
Read CSQ Research’s book “False Gods” for more.
In reality, 55 countries (of 200 countries surveyed) have no homosexuals. These nations realize that homosexuality is a fabrication that doesn’t exist when adolescents are educated in gender roles and family values, and that homosexuality isn’t a productive or socially beneficial behaviour either. Like alcoholism, drug abuse, or wife beating, it’s harmful ideology and indoctrination rather than education
These countries train their children to be heterosexual – 100%
Any notion that a percentage of humans are innately homosexual and will pine for this lifestyle once it is denied is pure fabrication. The 20% of the West’s non-heterosexual young GenXers take families, raise children, and live full lives
The British Empire’s 70 nations didn’t permit homosexuality until 1992, and added another 75 nations to today’s 55 Muslim nations

Statistics in both clinical and social surveys now support the conclusion that gender indoctrination can and do change the testosterone levels of a nation’s citizens, and also create homosexuality. Homosexuality is a survival mechanism from humanity’s distant biological evolutionary past, 100 million years ago when we our bodies had the ability to change genders in accordance with our behaviour and testosterone levels. The imbalances that this indoctrination creates in national testosterone levels are responsible for today’s explosion in homosexuality reports and a 100-fold increase in Autism levels (Autism is a “high-testosterone fetus” birth defect)
Statistics prove that nations who teach and encourage homosexuality have a higher percentage of homosexuals than other nations that do not

In an NBC survey of 27 nations’ GenX young people, a staggering 20% reported they are not heterosexual
Like Angels, homosexuality exists as a shared belief – rather than a real thing. So, like any popular, cool, or rebellious trend, kids will adopt anything – even a Depopulation Theory like homosexuality
Conclusion: These explanations make the teaching of homosexuality in schools, a clear child abuse and probably treason also, because the practice undermines the integrity, viability, and grasp-on-reality of an entire population, by bringing a harmful “Ideology War” and guaranteed cull to a nation
A 1.5% population loss is not an insignificant loss of life. In Canada, 1.5% is 660,000 infants annually; in the US, its 4 million children, and 64 high-income countries lose this percentage of their population today – citation – for planned, election-winning “Girl Power” political groups
Money
Currency
Since 1971, all nations live and work within a FIAT monetary system, where “fiat” is a latin term that simply means “let it be done”. Before this, we lived by the “Gold Standard” – which meant that countries could not print more local money (currency) than they could back with gold in their Federal Reserves.
These systems are what give money its value. Without them, money would have the same value as Monopoly Money, nothing.
A FIAT System permits the printing of money based on Debt. As long as a nation has no trepidation about servicing the interest payments of its debt, money can be printed freely and easily, based on nothing more than thin air (nothing), as long as debt repayment obligations are maintained and amounts remain at responsible levels
The same is true in banks, where a bank actually creates money from nothing when it lends 10 times to 26 times its deposits for mortgages. In some offshore banking jurisdictions, these down-payment deposits do not even have to be validated, which means that banks can create money from absolutely nothing as long as they eventually can return the deposit, but in practice, they rarely have to unless called for by an unusual regulatory call
New money entering the country is a benefit to GDP, so nations tend to look away from the details about the source of new money and wealth entering the country
When nations reach crisis levels of debt, as they did in the Great Depression and today, nations simply agree to forgive one another’s debts – and that is how the monetary system “game” is played
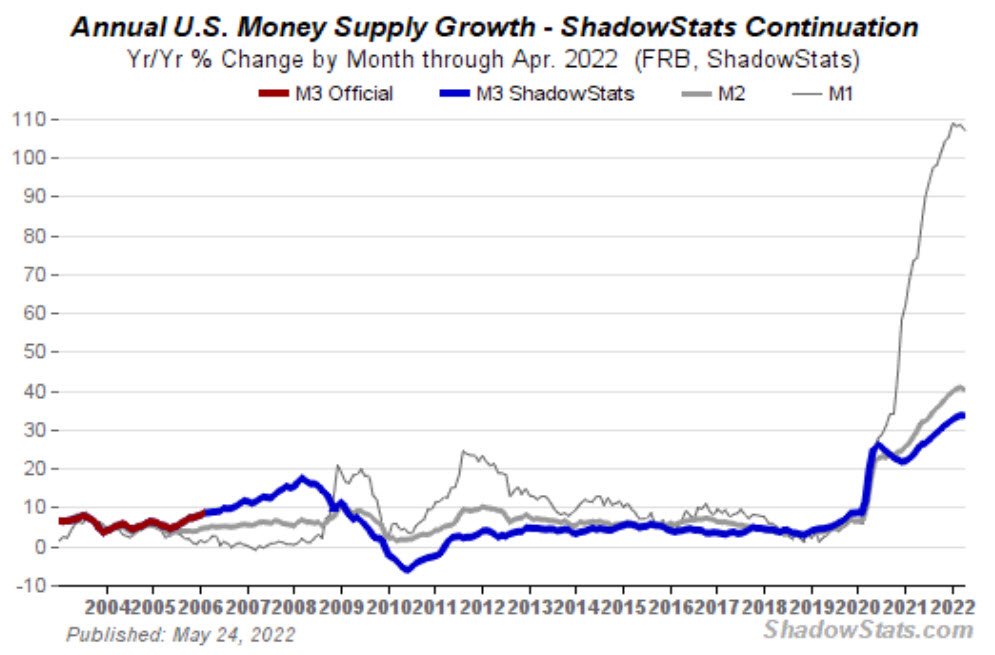
Money Supply Growth
This means that money is far less “real” for large governments than it is for individuals. Money is “most real” for individuals who are denied access to incomes sufficient to afford their basic needs of life, and we see here that the USA hovers at 1930s levels of production growth today because of its very unbalanced inequality
Access to sufficient income (money) permits populations to be productive – and poverty will hobble a nation’s production as well
This is the reason that financial inequality is so damaging to any nation’s productivity
See also:
Business Profit
& Cost
There is no scientific evidence to prove tactical Cost and Business Profit improve economies. Rich owners benefit alone from this theory of Micro and Macroeconomic Wealth Theory alone
Any FIAT Monetary System works as follows:
Currency is printed by a nation’s Central Bank Mint, and Private Banks are assigned Debt insured money (in currency or electronic form) so that they can lend and invest it with businesses who build production and pay employee salaries and owner/stockholder dividends with profits. All money returns to banks and central bank lenders in one fashion or another and this monetary engine is hoped to run in a reliable cycle year after year indefinitely.
The elimination of living wages in Western nations since the 1970s has created both inequality and 1930s levels of low production growth. The collapses have contributed to the elimination of family, family values, single-income households, and runaway cost of living. Tactically indoctrinated business leads and vote-grasping political groups use harmful ideologies like DEI, to collapse in every measurable way AND to create A CRIME AGAINST HUMANITY also
Our Case Study Proof that this profit focus collapses nations reliably examined Stock Market reports, alongside other KPI measures, because stock valuations react to changes in corporate Profit. The following Stock Market TEP Chart looks for advance or collapse resulting from 17 years of growth in the stock markets of 90 nations – and there is none (except in extreme crashes and hyperinflation cases). Extreme crashes can impact societies and economies negatively, but these extreme cases happen once in a century typically
Having a Stock Market is a help to any nation’s economy (the Average Advancing rate of nations with Stock Markets is 57% instead of the typical 32% TEP report), but business profit and stock price performance are irrelevant to the advance of economies (the red line is flat)
Tactical and short-sighted, profit-focused Neoliberalist and Microeconomics theories from Marx or Friedman, used logic and political or financial influence to embed a false, harmful belief-based curriculum, but this is indoctrination – and not education
Reserve Currency
Since 1944, the US Dollar has enjoyed the status of the world Reserve Currency Standard.
The Reserve Currency agreement was struck by 44 countries at the Breton-Woods Conference following World War II. The USA created the World Bank and an International Reserve Currency Standard using American Dollars and a highly questionable US Banking system
Sanctioned nations could be easily blocked from SWIFT and similar banking transfer and trade infrastructures – by US Foreign Affairs, Politicians, and Intelligence agencies for the next 75 years
BRICS
BRICS – Brazil, Russia, India, China, South Africa Conference, is today endorsed by 160 countries to change the world’s Exchange Currency to a Standard with no influence by the American Government, its politicians, or its Banks.
BRICS’ Exchange Currency standard will use a Digital Currency managed with Digital Wallets and a Blockchain-based payment system.
This standard eliminates the need for banks altogether, which CSQ Research proves is a smart decision wherever Banks fail to create production as we see in the USA, and the West’s, 1930s levels of production growth today – and in Worldwide Production loss since the 1960s.
Impacts of Losing the Reserve Standard
The Impacts of losing the Reserve Currency are well explained here …

See also: Banks
Worldwide Production Growth lowest since 1930s
Law
Courts
Philosophy
See also: Bible
Civic Science
Constitutions
Democracy
Education Reform
Indoctrination
Harmful Ideologies
Criminal Legislatures
Complain against Collapse – Pride Flags, Ideology
Civics – is the study of Civilization, as should be taught in schools of Law, Economics, Business, Finance, Government (State), Social Systems, and Education.
Unfortunately, all Western University faculties teach indoctrination in Civics classes today, and not education in Civics – see Civic Science. Civics Courses in Western universities teach harmful ideologies like Female Equality, Gender Theory, Wealth Theory, Right, Left, and ISMs like Marxism, Capitalism, Socialism, Communism, and similar. This lack of educations explains why 90% of our large democracies are collapsing today
A gap or weakness in any society’s civics training leaves them open and easily vulnerable to corruption and to Criminal Legislatures as we see in dozens of collapsing democracies today
Law – Law is a system of rules, created and enforced by government or social institutions, that regulates behavior, protects rights, and maintains order within a community. These rules can be found in statutes passed by a legislature, in precedents from judges’ decisions in common law systems, or in regulations and decrees from industry regulatory commissions
Origins of Law – Law is called Lord in the Bible – for 3000 years (since @763 BC). The 613 laws of today’s Bible were updated from Constitutions, Criminal Codes, and Bills of Rights (Human Rights) as far back as Ur’Nammu in 2100 BC, who was the author of several of today’s First Commandments
Laws in the Bible
Laws in the Bible can be found as Commandments, or by searching for “This is the word of the Lord” because Lord means Law in the four times translated Bible. Remember that the Bible’s Civics Lessons had to be taught using belief-based education methods to a 99% illiterate audience for thousands of years. But, its authors were clearly not illiterate, and were also well-intended and well-educated in Civic history
- Lord means Law
- God means Good (systemic empathy); Good values are Family Values and Human Rights of a good income, home ownership, education (not indoctrination), an
- Jesus – Joshua in Aramic societies – is the Bible’s teaching tool for Respect and for the Golden Rule, Do unto others as you would have done to you
- The Holy Spirit – builds and shepherds human advance (Leadership)
- The First Commandment is the first law of a Christian society – You shall not permit false definitions of Good; No harmful ideals can be called good values and morality; No False Gods
- The Second Commandment – no symbols of these ideologies – so no Swastikas, No Pride Flags, and similar
- The Third Law – The Law must punish those who hold harmful ideologies as truth and teach indoctrinations instead of our Human Right of Education – in our children’s schools and in media. Today, one million Canadians are lost to Female Equality teachings from kindergarden – this is the first law for a very good reason, and indoctrinators lose entire generations of citizens
- The Fourth Law – remember one day of the week for rest and community
Ask me how I know …
Research. Do your own research, but begin with The Book, the much much-needed update to the 4,000 year civic lessons learned in record, and confirmed in Civic Data Science today
Laws either built and advanced strong societies or they collapsed societies, so for thousands of years, responsible leaders wrote down the lessons learned from the rise and fall of civilizations, so that we would not make the same mistakes again
Education teaches us these lessons – so that we won’t fall for them again, but when Indoctrination (of harmful ideologies – “utopic, modern, better” ideas of good values and morality) is taught instead, societies collapse reliably again and again
Purpose of Law – Law must build Good, Respect, and Human Advance in any society. They govern actions and not thoughts, and Courts that fail measurably to ensure and build this need of law can be considered unlawful or lawless. This is why Courts have a duty to correct democratically elected Legislatures as Checks and Balances
Oath of Law – an Oath of Affidavit (Confirmation of Truth) in a Christian society, must be sworn on a Bible because this is the basis of all Law in every Christian Society since laws that protected good, respect, and advance were first recorded
The Importance of Law and Courts – Courts and Laws that fulfill their purpose above, are essential to any population and sovereignty. Courts that measurably fail this definition are unimportant and harmful only
When Courts and Law Fail – Citizen Courts that uphold the directions of Good (systemic empathy), Respect, and Human Advance
Good Values – are protections for Families and Human Rights
Civic Science – is truth-tested, evidence and data science-based facts and performance measured in Civics. See Civic Science
Religions teach proven “Lessons Learned” in Civics – using the belief-based / faith-based teaching methods and teaching tools (characters) explained here at WAOH in Education
Philosophy – is a wider topic that is 90% fictitious and harmful ideologies (…ISM’s) working to explain a group’s concensused approach to life’s personal and social situations, morality, values, loyalty, doubt, class struggle, logic, love, and similar. But, only about 10% of philosophy can be called important because – this is the much smaller percent of Philosophers who contributed measurable systems and approaches to building a reliably good and worthwhile life, contribution, and society
Important philosophers built and taught measurable systems of Civics, Science, and Engineering that explained reality, good values, good leadership, context and truth. These were humanity’s true Great Thinkers ![]() through history – and our truly great Philosophers also. Men like Aristotle, Hipparchus, Pythagorus, Constantine, Francis Bacon, Voltaire, Hobbs, and Newton. These men questioned religious dogma when they should, and could never be called “followers”. Special mention goes to Marcus Orrilius, whose “Meditations” served as an important example of techiques in reflection and introspection.
through history – and our truly great Philosophers also. Men like Aristotle, Hipparchus, Pythagorus, Constantine, Francis Bacon, Voltaire, Hobbs, and Newton. These men questioned religious dogma when they should, and could never be called “followers”. Special mention goes to Marcus Orrilius, whose “Meditations” served as an important example of techiques in reflection and introspection.

The Bible – is not a religious document, rather it’s a third update of the Codes of Hammurabi and Ur’ Nammu – our 4,000 year old first Constitutions from Mesopatamia (modern-day Iraq). This is the reason that 800 Constitutions have used the Bible’s as a reference since 1791 (according to my research at Wikipedia)
The Bible had to use storytelling and teaching tools like a Father, Son, and Holy Spirit to warn against harmful ideologies – false idols and beasts; owing to the fact that 99+% of its audience was illiterate, superstitious, and seldom trained to a grade 5 level of education. The words Lord mean Law in Exodus, God – means Good, Jesus – Respect (the Golden Rule), and Holy Spirit means Human Advance, and so on
Christian and Jewish religions use the Bible – and abuse it too, but it’s a civics textbook developed and written based on the observation of lessons learned in 2,000 years of civic rise and fall. This means that it is absolutely scientific as well
We don’t discuss religious documents here at WAOH, but the Quran certainly does have many of these Civics lessons as does the Vedas and later documentations of Buddha and Confusious’ wisdoms
Churches – are gathering centers that permit our communities to come together once a week, to learn civics. This is an important “community value” and an opportunity to show respect and fellowship to our neighbours
What do we want to teach our kids?
We don’t want to worship a storybook’s teaching tools, nor prohibit life-saving blood transfusions because a religious literalist misunderstood the meaning of a storyteller’s words, but we do want to teach our children essential lessons-learned in civics, like essential good (systemic empathy – in actions and laws); family values; respect of others and community; coping skills; and the shepparding of our human advance
We don’t want to be an exclusively belief-based religious society, and we don’t want a society taught that harmful secular ideologies are important either; we want a good, respectful, and reliably advancing Scientific (truthful) Society. We want a society that respects the belief-based teaching methods of humanity’s illiterate past while confirming facts, reality, and the highest probability of success in contemporary evidence-based civic science from the performance, facts, and reality (best practices and lessons learned) across 220 countries today
Civic Science and Law
Transition Economics – is a Civic Science which measures the social and economic success of religions and civic policies nation by nation. It’is a valid approach because economies are high-transaction systems, which means that higher probability of success policies (civics teachings and decisions) DID in fact create human advance or collapse reliably over time
Canon Law – most of today’s modern land titling and lending laws – in the West and elsewhere, originate from the 613 laws, human rights, and constitution explained in the Bible. The same is true of Middle East and Eastern nations who base their Civics on measured success and traditional teachings from their civics texts
Mosaic Law – the laws committed to the Bible’s Old Testament in its first five chapters – which are also called the Pentateuch
Scandanavian Law – originated financial compensation for man slaughter – to eliminate generational vendettas, as did Ur’ Nammu‘s laws, which were not as Eye for an Eye as Hammurabi‘s certainly were
Indoctrinations in Law – Why do we say that Western universities teach indoctrination? Ask a lawyer or judge, where does law and laws come from; where do they originate. You’ll hear crickets; they don’t know because they are not taught the answer
Separation of Church and State
It’s not that simple …
Religions teach Civics – To teach these proven successful civics lessons, they also use the belief-based teaching methods explained here at WAOH in Education. This approach was essential in an illiterate age – and is still appropriate and important today. At WAOH, we warn communities to train their children in Civic Science also, so as not to leave them vulnerable to lying and harmful ideologies. The Bible’s first law prohibits the false definition of good values (false gods), as does our Civics trainings here at WAOH
God is Good (Systemic Empathy) – even atheists believe in empathy when they reject the notion of a deity. The Bible never says God is a deity, but “God is Good” is repeated twenty times
Civics – is the study of Civilization, as should be taught in schools of Law, Economics, Business, Finance, Government (State), Social Systems, and, of course, Education. Unfortunately, all of these university faculties teach indoctrination today, instead of education, which explains why 90% of our large democracies are collapsing
The Bible – is not a religious document; rather, it’s a third update of the Codes of Hammurabi and Ur’ Nammu – our 4,000 year old first Constitutions, Bill of Rights, and Criminal Codes from Mesopotamian Kings (in modern-day Iraq). This is the reason that 800 Constitutions have used the Bible as a reference since 1791 (according to my research at Wikipedia)
The Bible had to use storytelling and teaching tools like a Father, Son, and Holy Spirit to warn against harmful ideologies – false idols and beasts; owing to the fact that 99+% of its audience was illiterate, superstitious, and seldom trained to a grade 5 level of education. The words Lord mean Law in Exodus, God – means Good, Jesus – Respect (the Golden Rule), and Holy Spirit means Human Advance, and so on
Christian and Jewish religions use the Bible – and abuse it too, but it’s a civics textbook developed and written based on the observation of lessons learned in 2,000 years of civic rise and fall. This means that it is absolutely scientific as well
We don’t discuss religious documents here at WAOH, but the Quran certainly does have many of these Civics lessons as does the Vedas and later documentations of Buddha and Confusious’ wisdoms
Churches – are gathering centers that permit our communities to come together once a week, and to learn civics. This is an important “community value” and opportunity to show respect and fellowship for our neighbours
We don’t want to be worshipping a storybook’s teaching tools, nor prohibiting life-saving blood transfusions because a religious literalist misunderstood the meaning of a storyteller’s words, but we do want to teach our children essential lessons-learned civics like good (in actions and laws); family, community, and personal values; respect of others; coping skills; and the shepparding of our human advance
We don’t want to be an exclusively belief-based religious society, and we don’t want a society that is based on harmful secular ideologies either obviously; we want a good, respectful, and advancing Scientific Society. We want a society that respects the belief-based teaching methods of the past while confirming facts, reality, and highest probability of success in contemporary evidence-based civic science as well
Transition Economics – Modern Civic Sciences do what the Bible’s authors did. They find policies and models of behaviour and good values that reliably create human advance over time
Canon Law – most of today’s modern land titling and lending laws – in the West and elsewhere, originate from the 613 laws, human rights, and constitution explained in the Bible. The same is true of Middle East and Eastern nations who base their Civics on measured success and traditional teachings from their civics texts
Scandanavian Law – originated financial compensation for man slaughter – to eliminate generational vendettas, as did Ur’ Nammu‘s laws which were not as Eye for an Eye as Hammurabi‘s certainly were
Indoctrination – Why do we say that Western universities teach indoctrination? Ask a lawyer or judge, where do laws come from. You’ll hear crickets (nothing – because they are taught no answer)
Think Tanks
A Lobby Group and form of organized subversion that began with the 1980s Republican Party, and carries on to today as NGOs and super PACS. Non-Government Organizations are sponsored by billionaires and major corporations with the purpose to research policies with the goal of shaping governments.
Canada’s Century Initiative group is a current example, that seeks to grow Canada’s population to 100 million by 2030 – without telling voters that they are now part of a harmful, grossly irresponsible Great Replacement and Immigration Election Fraud Campaign.
Thinktanks offer staff, money, consulting, university endowments, election campaign contributions, and Yes-men candidates too; whatever incentives are needed to steer government compliance to the ideologies of its sponsors. Citation: The Guardian
Lobby Groups operate similarly when sponsored by Gun Manufacturers, Oil Companies, Insurance, Private Healthcare, etc. but many Lobbyists also campaign for the rights of union workers, dairy industries, farmers insurance, etc.
Most ideology thinktanks are a detriment to societies and economies; examples of thinktank “creations” include:
“Death Tax” and “Double Death Tax” were found to test much more negatively than “Inheritance Tax” in a Republican thinktank marketing test center
“Low Tax” made policies that eliminated taxation of the rich, appealing to voters
“Small Government” and “Open Markets” is deregulation and Laisse-Faire; an unsustainable collapse policy only appropriate in Boom economies for short, monitored durations of time
“Welfare State” replaced the term Safety Nets
The practice started clumsily, but has evolved with time to an unimpressive array of coercions that prey on poor civics training, or create poor civics training, to undermine national advance, divide democracies, and protect status quo powers by actively hiding reports of collapse. Citation: Reporting
See Female Equality and LGBT Rights, Greenwashing, Ideologies, Virtue Signaling, Immigration, Laissez-Faire, Left vs Right Divisionism, Mental Illness, Modern Morality, Nuclear War and Open Markets
Unsustainable |
Abortion
1 in 3 GenZs are Dead
Schools, internet search companies (Google), all AI companies, and social media are quick to dismiss the staggering depopulation of Western nations today
Canada loses one million (2%) of its total population per year – to infertility, homelessness, suicide, MAID euthanasia, and abortion
No age group is more actively targeted and harmed by this obvious child abuse and indoctrination in our schools and criminal globalist legislatures than GenZers – our young people
Reproductive Rights?
Abortion is usually presented as a positive, as a human right, as an anti-abortion group’s meaningless old-fashioned out-of-touch point of view on today’s modern reality, but seldom is Abortion simply presented as a fact and statistic. On the grounds of national stats, abortion is a staggering social problem. At this scale, abortion is an obvious Crime Against Humanity and an assurance that nations which indoctrinate girls in this way will have no future, no families, and no nation at a point
Election Fraud
Political marketing campaigns call abortion “Reproductive Rights” and “Female Equality”. When these groups win elected power, they immediately push to build Female Voter support by replacing education with indoctrination in schools and media. The Canadian Government Rights of Females website indoctrinates visitors to say: “Women’s rights are human rights. Equality rights are of particular importance, given the unequal treatment women have experienced in Canada.”
Worldwide, the Female Vote is easily the most harmful indoctrination and democratic reform in human history
Family Values and Gender Roles
Teaching girls from kindergarten that good values of country building, family values, and gender roles are not modern, are unfashionable, and are definitely decisions they should never vote for
Just the facts …
- Elective abortion is 90%
- In the USA, 28% of GenZers die of abortion every year
- WHO calls abortion “a common health intervention”
- Six out of 10 unintended pregnancies end in induced abortion (WHO)
- More to come, because this new Case Study at WAOH, could easily overwhelm this page
ACT OF WAR
An Act of War brings a war to any nation, and the groups and individuals responsible for bringing a war to any nation can rightly be accused of High Treason as seen in Canada’s Criminal Code 46.1
See also Treason, Human Rights, Criminal Legislatures, Corruption, War, Net-Zero, GFANZ, Banks, the Female Vote
Wars are measured by Depopulation, and not by the number of battles, weapons, and explosions. Indeed, most casualties of war starve to death or die of disease as created by the denial of basic supply chains, medical services, and sanitation infrastructures.
World Wars
World War II – Hitler’s invasion of Poland started a war with casualties estimated at 30 million dying in battles and bloodshed, while another 30 to 40 million, a majority, died from disease and starvation. This great war’s 80 million lives lost over six years, is dwarfed by the 80 million lost annually to infertility depopulation worldwide today.
World War I – The assassination of ArchDuke Ferdinand was designed to free Bosnia and Herzegovina from Austro-Hungarian Rule, and establish a Yugoslav State. It started World War I instead.
Wars of Attrition
USSR – ceased to exist due to a War of Attrition (process of reducing something’s strength or effectiveness by sustained attack or pressure), by the economic treasons of economic theorists that failed to distribute incomes from monetizable production. No one wanted Russia’s inferior Lada cars or watches that did not tell time. The United Soviet States failed.
Large Western Democracies – beginning in the 1980s, 90% of western democracies with populations greater than 20 million are collapsing. Depopulation due to infertility, low compatibility immigrant election fraud, surveillance states, and economic treason, force some of the most important countries of the last century into collapse today.
Example Acts of War
Example Acts of War should surprise you, because every large, collapsing democracy finds a majority of its voters supporting groups and policies that are easily confirmed guilty of high treason and an Act of War. This fact explains why 90% of large Democracies are collapsing today as well.
- Female Equality Hiring (Depopulation) – a group that legislates/mandates female hiring quotas – guarantees depopulation through the attrition of families, affordable human necessities, and infertility, accompanied by a rise in poverty, homelessness, no human rights. No human right means no security – no food security, housing, families, health, education, pensions, as needed by citizens to be productive.

- Lost Freedoms – Legislation that denies people the financial security (good jobs and incomes) to make decisions for moral reasons, also denies the chance to build monetizable productions. Responsible citizens must follow and adhere to criminal legislators quietly, or be incarcerated, have incomes seized, be fired and denied jobs, grants, incomes, admissions, procurement consideration; have crazy fines levied against them, lands seized, or if they have the means, they decide that it’s easier and safer to flee the country.
- Economic Treason – Economies are high-transaction systems and are subject to the laws of probability. This means that when policies cause important economic measures – like National Debt or GDP per Capita – to worsen, they are also guaranteed to continue to worsen indefinitely. Collapsing measures are NEVER a precursor to later advance; rather, they simply verify that the current collapses will continue – until economic policies are changed. See Transition Economics for this explanation.

Ageism in Male Hiring
No White Males – hiring, grants, admissions, procurement policy

Income and Jobs are a human right, essential to home ownership, families, individual and national prosperity via productivity, and sustainable fertility rates.
This is true in every nation.
In WEF strongholds India, Canada, the Middle East, etc. where harmful Diversity programs and laws have gained a footing, the practice of not hiring males over age-50, and not hiring white males at all, creates many serious social problems:
- Experts cannot Lead, nor even find basic support nor incomes in DEI and NO WHITE MALES policy businesses and nations; our most important resource, human capital, and experiences are lost. Humans are the only species that permit weak individuals to lead, and today 90% of 54 large democracies are collapsing because of it.
- People hire themselves. While an older person can relate to and will hire a younger person, a younger person will not hire older
- Family Pensions are decimated creating an immediate social burden and then decades of lost economic production as economies are now burdened with only non-contributing seniors
- Divorce rates rise while new marriages fall
- Family Values, Core Families, are fractured while 50% of high-school teens enter counseling and anxiety medication
- Children cannot launch lives in their hometowns and must move from family support for affordable rents
- Suicide, Male Suicide, and hidden Suicide Rates (poisoning, drug overdose, etc.) skyrocket
- the BBC reported a .79% increase in male suicides for every 1% unemployment; Diversity & Inclusion policies create male suicide
- Euthanasia rises – as it did in 1930s Germany
- Retirement homes report elder abuse and national longevity is reducing for the first time in a century

Autism
Autism used to be a 1 in 50,000 developmental defect, while today, autisms affect 1 child in 50, and that number appears to be worsening
Autism Prevalence and Potential Causes
- Autism is a genetic defect exhibited in high testosterone fetuses. Is the condition caused by high testosterone levels in mothers as well? The answer can only be yes.
- Schizophrenia and Addiction disorders are similarly associated with high testosterone fetuses.
- Studies exploring the link between high female testosterone levels and autism have faced funding cuts or cancellation in Western universities, leading us to wonder if election-winning Female Equality campaigns and feminism indoctrinations from pre-school are contributing to or creating Autism
Can an election-winning Feminist agenda be Creating Autism?
Feminism creates today’s Greatest Cull of world populations in Human History as well, but this fact has not slowed the use of feminist election policies to win power through election in high-income countries that today experience World War II Europe levels of depopulation (a 1.5% depopulation; 45 million children annually – due to infertility)
To win elections, Western girls are taught indoctrination and propaganda from kindergarten:
- Female Equality – Girls should be CEOs, Pilots, Marines, Lawyers, and run Boardrooms – or run for Politics
- Women should work as employees or lead a business
- Women should see that double-income-trap families are normal
- A woman who has more than one or two kids embarrasses herself and is a lesser person
- A Family Home and Family Name are unimportant
- Gender Roles enslave, disrespect, and are insulting to a “modern” women
- Divorce is a chance at a better life
- Success is working in an office filled with women
- High-testosterone Men – can’t keep a household (unsurprisingly true wherever DEI Laws fill offices and boardrooms with women as well)
- Girls fair better in schools that today teach theory-based rote memorization of curricula that collapses 90% of Western Societies
Even George Orwell could not imagine this level of indoctrination and human cost, yet this is the reality for 62 unsustainably infertile high-income nations today.
Testosterone and Gender Facts
- Homosapien Humans evolved from Great Apes, frogs, and lungfish over a 100 million year time period, and we still share strong similarities in physiology and anatomy to this day.


- Green Frogs can change their genders – by altering their testosterone levels through behavior where aggressive behaviour lifts testosterone levels and signals ganodes to function as male reproductive organs; while passive behaviour signals female function. Gender changing is a 100-million-year-old proven-successful biological species survival tactic.
- In lab tests, Human females can similarly increase testosterone levels easily in role-playing exercises such as acting as an authority figure or pretending to be a CEO chastising VPs in a boardroom.
- Healthy teenage males have 10 times higher testosterone levels than their female schoolmates, and their testosterone levels do not change in lab tests.
- Having higher testosterone levels means that the teaching methods for males must also differ from the curricula of females.
- Males can be twice as large as females and are naturally more aggressive and physical. Their nature is to be builders, problem-solvers, respected leaders, protectors, and providers.
- Statistically, males commit suicide at a rate of .7% for every 1% of unemployment, so males need purpose and responsibility – and no female will accept them as a life partner when they don’t have the security of reliable support for incomes from employers either.
- Four-year degree programs asking males to focus on the rote memorization of proven-failed, socially harmful curricula is an unacceptable education system for males (and for females also). See education
- 60% of males drop out of 4-year degree programs in North America as a researched fact.
(Hiccup/Ribbit)

Frogs have opposable thumbs, can walk and crawl
Political and Social Factors
- The political system in Western democracies, influenced by “Girl Power” elections, may be hindering the public’s understanding of autism’s cause.
- Feminist political groups secure votes by promoting ideologies such as female equality, women in leadership roles, and double-income families.
- These ideologies, taught from a young age, may lead to high testosterone in women, contributing to autism.
- Responsible civic education is lacking, as elections are dominated by well-funded parties promoting indoctrination over education.
Consequences and Proposed Solutions
- Nations promoting these ideologies face depopulation, poverty, and increased autism rates.
- Political groups use various campaigns (e.g., Female Equality, DEI, Gender Theory) to win elections and access public funds, leading to broad social and economic collapse in many high-income democracies.
Child Abuse in our Schools
- Young tweens can be impressionable when it comes to gender, likely because a few eons ago, our bodies could biologically change genders. It’s still in our DNA.
- Practices like displaying Pride Flags or incentivizing homosexuality through medical school admissions, Ivy League enrollments, Grants, Funding, news media, special treatment, Pronouns, and social media platforms all work against a sustainable society’s responsible goal of 100% heterosexuality and a 2.5 children per woman population-sustaining fertility rate. Flags and cross-dressing are harmful to our modern bodies’ healthy male or female development.
- Before 1998, half the countries in the world had no homosexuals; 50 countries have zero homosexual citizens today, with arranged marriages that have an incredibly high 90+ % record of success – in stark contrast to the 50% divorce rates for the kids that graduate from Western schools today.
- A recent PBS Survey of 27 western countries reports that 20% of GenXers do not consider themselves heterosexual. See also LGBT
- This indoctrination denies children a future, a family, a home – because Criminal Legislatures support housing bubbles – incomes, pensions, a good education, and a good life in all respects.
We conclude at this time that indoctrinations for votes and political gain in our schools, forfeiting family values, sustainable fertility, and heterosexual development, is Child Abuse – funded and mandated by criminal legislatures 100%
The Solution
The Solution is to teach good values and not harmful ideologies. Family Values, Human Rights, Affordable Good Homes, Heterosexuality, and Gender Roles
Criminal globalist political groups use Female Equality, DEI, Race Theory, Gender Theory, and LGBT Rights campaigns to win elections and power (see Election Fraud), and “Girl Power” campaigns work very well to secure control of public coffers in 64 of 70 high-income collapsing democracies today. Reprehensible individuals knowingly trade a Crime against Humanity for power, and then they use this power to hide all reporting of the 40+ serious economic and social collapses and national infanticides that today’s irresponsible “Female Vote” creates
Vaccines and Autism
By coincidence or correlation, the number of vaccines given to children has exploded at the same time that testosterone levels in young women as well. This causes many parents to wonder if the two are contributors.

Autism by Other Causes
Last year, I sat through a discussion with a University Professor who was convinced that new cleaning detergents were to blame for soaring autism, so this is not a subject with a small consensus as to cause – at the time of this writing.
The cause of Autism is NOT
- Vaccinations – Autism can be tested for before vaccines are given; which means that a clinical trial could add an Autism test BEFORE vaccination to confirm any contribution (if any)

- Cleaning supplies – Autism is a “high testosterone fetus & mother” condition
- Rising Age among Mothers – permits us to compare the age of new mothers over time as well, but in families with 12 children where mothers gave birth at 40, there were not today’s high incidents of Autism


The Most Likely Culprit (at the time of this writing) – is Feminism – due to its ubiquitous testosterone-building Double Income Trapped females.
Protecting Children from Autism
Protecting your future and family, today means:
- return to family values
- single-income families with stay-at-home wives and mothers
- reducing each mother’s age for first pregnancies (from 27 to 22)
- increasing the number of children per woman (fertility rate) to 3.0
- surround young wives with high-estrogen, low testosterone settings, and children
- create high-estrogen mothers with a loving home, husband, and community
How can we build this?
- Learn Civic Science – see Civic Science Education Indoctrination
- Vote – only for groups that support human rights and are Certified in Civic Science. Which means building ACT Parties like the Advance Party of Canada
- Right and Left Business Lobby-funded Political Parties are not going to ensure these Human Rights. One vote fixes this problem, but you must also communicate it to friends and family for it to work.
- Family Values – as taught by programs like The Flintstones, Jetsons, Leave it to Beaver, … see Family Values Values

Billionaires
Billionaires is a fun study in evidence-based science. Billionaires is not a causal indicator, but there are interesting lessons here just the same
In 67 countries that participate in this study, nations with 36 to 44 billionaires have the highest probability of advancing economies. Nations with 264 to 614 billionaires have the lowest chance of advance
Explanations for this go back to leadership fundamentals. If Billionaires pay living wages and empower production, opportunity, and high social contracts – as did Henry Ford for example, they are a benefit. When they do not – as we saw in the First Industrial Revolution (1750-1800), they are a detriment to economy AND to society
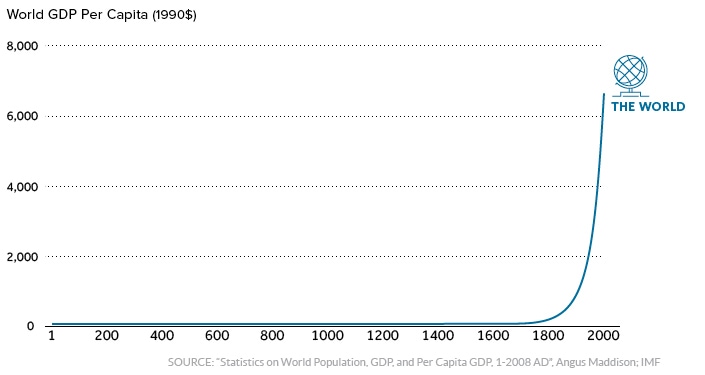
Henry Ford’s High Industrial Wages created Prosperous Economies in the Second Industrial Revolution


Cancel Culture
“The Mob” Mentality
Shunning , Accusation, and Disrespect
Absolutes
We don’t want to be a Politically Correct ![]() , Easily Offended, “Fit” or Follower
, Easily Offended, “Fit” or Follower
Cancel Culture says that one opinion is true 100% and that those who oppose this opinion, or the opinion of an advertised group or ideology, should be shunned completely – as with absolutes 100%.
If you do not follow the consensus’ opinion, you should be fired, denied incomes, denied grants, hiring, admission, loans, and human rights, while being denied the option of holding your own opinion or respect, regardless of your expertise, facts, or social harms caused the accusing absolutist’s behaviour.
Absolutes – are low-IQ, immature labels that explain you should be dismissed and cast out – because you are “a chauvinist”, “a racist”, “sexist”, not “a fit”, and so on.
In an abundant society with strong human rights, no-one would care much about the immaturity and shunning of others. They could just easily get a new income elsewhere and go on with their lives.
However, in a setting of scarcity, where incomes cannot be found easily or at all, once an individual is cast out, Cancel Culture by harmful ideology supporters can devastate individuals, families, communities, and even whole societies.
Good Values are Good, Respect, and Human Advance (taught as a Father, Son, and Holy Spirit in faith-based Civics) – and all of our behaviours (our thoughts, words, and actions) should gravitate toward these fundamental Civics 101 lessons that we should have learned since childhood. in any important, thriving society.
Collapse
90% of large democracies are collapsing today
See also: Abundance & Prosperity
Economic Turn-around
Mature Capitalisms
Tytler Cycle – the Cyclic Collapse of Civilizations
60-year Kondratieff Waves
Collapse Motivators
Collapse Policy
Collapse is created by Unsustainable, Tactical, Business & Government Practices
Any nation collapses when they place into positions of authority the least qualified, least introspective, and least strategic people in their society. Nations collapse today by their MBAs, Accountants, Politicians, theory-based Economists, Academia, and Human Resource admins, who are placed in charge of hiring – by gender, by race, and by “fit” (followers, concensus thinkers, anti-leadership, anti-merit, anti-expert), and Right and Left baby-kissing SuperPAC sponsored salesmen who tell us anything we might want to hear for power
When you put obvious non-leaders and non-experts into decision-making positions – about:
- Investment
- Executive – National Strategic Planning
- Legislature – Senate and Congress/Parliament
- Courts – Judges and Lawyers
- Teachers – in the schools of your children
… your society will collapse reliably by systemic shortfalls in Checks, Balances, and Veritas
Once in power, elected non-leaders and their entourage of sicophants who “fooled” voters into electing them, will want to continue on in their paid roles. So, these individuals will now HAVE to indoctrinate, lie, hide reports of collapse, and tell voters whatever they want to hear in media and propaganda. In times of imbalance and mature capitalism, voters will here anything but the truth, while legitimate reports of collapse are simply omitted or lied about
The resemblance of leadership with no leadership; or worse, leadership by elected officials who are now actively working against you, to undo your society on behalf of a sponsoring Oligarch or foreign power, is the beginning of the end for any nation through history, no matter how large or how previously successful it was
Countries will not just fall behind, rather the entire country will return to the agrarian economies and the financial slavery of 1750’s first industrial revolution sweatshops – reliably (see Orwell’s 1984 and the Tytler Cycle)
“Kings of Finance” become in fact “Kings of a molehill”, and the molehill gets smaller daily as today nearly every economy in the world loses $4 to $30 billion daily (55% to 150+% of their nation’s revenues)
Business Curricula Indoctrination
Loss of the Middle Class
equals
Loss of National Prosperity
70 years ago, businesses in the West built the greatest economies in history; but today, a competitive tactical focus and stock-price or quarterly-profit-focused business policies mandate regulation so that litigious, unproductive, and parasitic businesses and profits cannot continue to hobble production.
National productivity must be monitored and governed when low performance warrants it nationally. Globally, we are at the lowest production levels since the 1930s because governments are safeguarding neither national advance nor human advance.
Without this guidance and strategic oversight, your nation will consistently fail to achieve ALL meaningful growth targets
Nations that can plan, build, and advance strategically will surpass collapsing nations, growing both economically and socially with reliable consistency


See a catalog of systemic Collapse Motivators at WAOH
Fixing Collapse
See links above and for Civic Science Certifications and Monitoring (of political parties and politicians) by experts who can ensure that only advance policies are permitted and forwarded in any nation
No voter should be forced by a ballot card to give power to a political group that isn’t monitored and trained for confirmed Advance Policies only
Collapse is expensive and dangerous for everyone
CO2 Decarbonization
Are your ESG and similar Government and Finance Industry programs calling for blindingly irresponsible “Decarbonization” investment, programs, and laws?
Decarbonization takes place as a special project in “Decarbonization Factories”, and as Susiness SOPs (Standard Operating Processes)
Not to be confused with pollutants and harmful methanes or Carbon Monoxide (CO – is converted to CO2 by exposing it to metal–oxide catalysts as does a catalytic converter), etc.
Carbon Dioxide (CO2) is an essential building block of life on this planet
The earth sits at record low levels of CO2 today, CO2 is not a greenhouse gas (we’ve had four ice ages with CO2 levels multiples higher than today’s), and CO2 is also approaching starvation levels
Yet pension funds (like CPP), and similar large commercial investors, are investing billions of dollars into money laundering schemes that claim benefit by stripping CO2 from our atmosphere
See CO2
Corruption
Large Democracies are Oligarchies
See also Incarceration, Systems of Government, Monarchies, and Democracy
It’s easy to confirm that $100,000 salaried politicians live like 1%ers in large mansions in many large “Democracies”
See Real Examples of Big Money’s Power to Sway Democracy
Legal and Illegal:
Corruption can be illegal, legal, or a bit of both, and take many forms …
- Bribes – Crypto is the latest, most secure method today
- Kickbacks, Gifts, and Donations
- Multi-million dollar-per-year Board of Director appointments
- Non-Profit Corruption

- Banning Popular Political Opponents – on Technicalities
 Money laundering
 - Preferred Lending and Grants for supporters of harmful ideologies
- Super PAC Political Party Seed Funding
- Misinformation, Indoctrination & Propaganda

Whoopi never explains that her ideologies create the greatest population cull in human history
PACs / SuperPACs
Installing governments and leaders who are obliging to the business interests and direction of larger nations is a practice documented, and protected against by Monarchs, for 4,000 years in our Civilizations. By now, Oligarchs have become very good at eliminating these corrections
Davos, Switzerland’s WEF (World Economic Forum) Organization is a famous example of a Global SuperPAC; a multi-national business and banking consortium that buys and sells Right and Left governments in 100+ nations where foreign-influenced contributions and political Seed Money are permitted by law. Sometimes, laws are changed specifically to permit the participation of these groups too. Steven Harper, Canada’s Prime Minister, had to deregulate Canadian banking laws to invite in WEF-spearheads BlackRock, McKinsey, and similar – which has since created the World’s largest housing bubble there
International Bankers can bounce between tax and banking laws in multiple countries, to create money from thin air – as can a Sovereign Nation but without the obligation to repay their money printing. This gives them the ability to drop a few billion dollars annually into 100 country’s national election races and thereby ensure that banking “rules?” remain as they are. The benefit to a nation’s inviting WEF in is to bolster their GDP Reports with an infusion of billions in “new money”
While any Civic Scientist realizes that GDP Reports are meaningless (a 2,000th ranked report), Western Democracies have trained citizens in Wealth Theory EXCLUSIVELY for 40 years now – until citizens incorrectly believe that GDP Reports and Business Profits are “the most important goal” for any nation
90% of large democracies (48 of 54) are collapsing today – because of this protection of Wealth Theory harmful ideology
Spot the Great Depression
Great Depressions are easily seen above in the purple line trending 10-year-average GDP Growth
We are in a Great Depression, hidden from us by Micro and Macroeconomics Wealth Theory today
Politician for Hire

Sponsored (Right and Left) Politician-for-Hire political parties change nothing and solve nothing – because they are employed by wealthy individuals and groups that are benefiting from inflation and current policies (decisions, contracts, and laws), and so these politicians realize that they must “kick the problem down the road for the next sponsored political group to ignore” until they are forced publically to address and change something – or until they are voted out of office, only to be replaced by another “funded” politician

“Sinema received checks (totaling $2.2 million) from businesses like Amazon, Honeywell, Intel and Merck, among many others, that have been actively fighting off Democratic efforts to reverse the 2017 tax cuts on businesses that Republicans passed while they were in power. Those groups are all part of The Business Roundtable, a coalition of prominent corporate leaders that argue increasing taxes is a threat to their future plans.”

“Kyrsten Sinema has taken $2.5 million from corporate PACs since 2021” – May 2022
Runaway corruption in large Democracy / Oligarchy nations is the reason that Monarchies have outperformed the G7 for 25 Years today, with free education, free healthcare, and the richest citizens in the world
Money Laundering
Like other forms of corruption, Money Laundering has crept into a surprisingly high percentage of Federal Military, Investment, and Spending today. Auditor Generals are fairly run off their feet, and this doesn’t count the myriad of legal corruptions that are permitted by regulations in various countries

Justin Trudeau’s Family Trust vaulted to Billions of dollars from foreign interests and contributors during a nine-year period that can be easily summarized as the most harmful period in Canadian history, while the Auditor General had no legal right to investigate how these contributions were misshaping Canada’s security, social, or financial welfare
In the example explained by Tucker Carlson above, after money laundering is taken as a percentage off the top of military arms sales by politicians, the weapons are then sold off by local government and military groups to fund other agendas. In this case, the advanced weaponry is sold to Drug Cartels and to militant regimes internationally
Systemic Corruption
Housing
As a society, we have been rewarding slumlords (rental housing operators) with disproportionate one-percenter wealth for the past several decades.
When finding a good job was easy, people preferred that productive profession first, but now that finding a good job has become harder than winning a lottery in many countries, individuals like Politicians have been taking advantage of lending opportunities to buy homes and rent them out for profit – as a side business for income and wealth accumulation.
Creating bubbles (in housing or anything else) is a very easy thing to do, and regulating these harmful bubbles out of existence is a simple thing to do too.
When open border election fraud immigration policies were introduced, rents doubled – in English, Canada but not in Quebec (French Canada), where housing and rent costs were kept affordable by local governments. So, now politicians are becoming rich for forwarding laws that make it impossible for citizens to either buy homes (outside their ridings of course), and citizens will now not even be able to save for home ownership because rents are now taking 70% and more of their incomes (when < 30% living costs is considered responsible governance).
Homes have also doubled in cost due to banking deregulation laws that force young families to compete directly against “free” offshore banking capital and commercial Real Estate Trusts.
This problem is reported in Britain, Australia, Canada, the USA, and most of the other 48 collapsing large democracies in our report here.
Immigration without Human Rights
America’s recent illegal immigration waves (estimated 20 million illegal immigrants) were suggested by 2024 Democrats (see Criminal Legislature) to be allowed to vote (for Joe Biden’s US Presidential campaign), as another example of democratic corruption – Election Fraud
Ontario, Canada, spends $1 billion per month on hotels for a flood of refugees and immigrants, while Canadians fill homeless camps – unable to find incomes or homes nor even to file a Human Rights complaint.
In Canada, Human Rights Tribunals only accept “Complaints of Discrimination”, which means Canadians live in a Pure Democracy – where 51% can starve the 49% to death legally and with impunity. This is the reason that Aristotle called Democracy an Evil form of Government. An Evil government systemically fails empathy toward its citizens, as was also the definition of Evil explained by the author of the Nuremberg Diaries, Gustave Mark Gilbert.
See also – Incarceration for thoughts and words
Systems of Government
Immigration
Human Rights
See also Collapse Motivators
Election Fraud
Election Rigging
Rule Rigging
Election Tampering
Millions of low-compatibility immigrants in swing ridings – the globalist practice of overwhelming democratic swing (close race) ridings with millions of low-compatibility immigrants. Low compatibility individuals are often desperate, vulnerable individuals who can only vote for the criminal political group that brought them in to change election outcomes.
Low Compatibility – the term used by refers to persons who don’t align easily with their host nation. The immigrant may practice (and insist upon) non-Christian religious beliefs, values, or legal frameworks – while residing in a Christian country. Examples of incompatibility can include Sharia Law, halal food processing, honour killings, ceremonial turbins, dagars, or swords, very different sanitary practices and home living conditions. A household of 20 people can afford and offer to work for far less than a Christian household with one core family (2 to 6) per home.
The only political group that this immigrant can now vote for is the criminal group that invited them in and then supported them to guarantee permanent elected power.
Election Tampering – includes a variety of election outcome tampering practices, including:
- One Party supervision – permitting ballots to be supervised by one individual or party
- Sending (boxes of) ballots home – usually without documentation. This practice can often lead to boxes (of ballots) going missing, or it can lead to the replacement of, or addition to, the box’s contents
Rule Rigging – examples can include:
- Top Two on Ballots Only – One group (Republicans/ Democrats / Liberals/ Labour …) might create a rule to add the top two candidates only, eligible for addition to ballot boxes, for election when their Governor/Senator/Congressman/Premier/MP/MPP candidates are the top two, and then change the rule when their candidates are not the top two – see California Democrats in 2026.
- Naturalization – after inviting in millions, the globalist criminal legislatures will reduce to rights of Citizenship to irresponsible low levels, in a direct effort to subvert elections
Support in Swing Ridings :
- Free or subsidized Daycare for immigrants
- Language Courses – for immigrants only
- No White Males – First right of hiring and incomes is now legislated given to immigrants and women, with no consideration of merit. See Canada’s Business Corporations Act for an example of this treasonous denial of human rights to it citizens.
See also:
Criminal Legislatures
No White Males
Incarceration
for Thoughts and Words
Thoughts and words are not actions. This might appear to be an obvious statement, logic, and common sense, but in the collapsing societies governed by criminal legislatures, their false definitions of Good (harmful ideologies) must be defended. These legislatures are toxic and traitors to citizens, to life, and to human advance, so any thoughts and words that do not align with their harmful ideology must become punishable to have any hope of compliance.

Overreaching
A collapsing society will showcase many examples of overreach.
See
Privacy
Privacy Laws protect citizens from over-reaching bureaucrats and enforcement officers. These laws should also protect citizens from having their personal information being made available to actuaries, insurance agencies, and marketers that should never have access to your private information beit:
Finances
Health
Thoughts and Words
Surveillance States
Monitoring of Emails, Mail, and Social Media Posts
See also Incarceration
Criminal Legislatures
Criminal Legislatures
Globalists Block – Civic Science, Central Planning & Human Advance
The term “Criminal Legislature” would sound like paranoid conspiracy theory during times of abundance in a successful society, but in nations where preventable mature capitalisms place Pride Flags in classrooms to abuse children, the greatest cull of human life in history rages, and 200 nations lose $1 trillion annually in 90% (48) of 54 collapsing democracies, a reader is only very gullible to believe that this scale of collapse is not intentional, coordinated, and also funded by globalist oligarches that can use lax international banking laws to create trillions of dollars in funding for Criminal Legislatures (democratic political parties) – legally, and without cost or penalty (with impunity and without accountability) to themselves.
Important Reports are not the only thing hidden and blocked from view in dozens of collapsing Criminal Legislatures today.
Entire sciences and responsible Performance Management, Central Planning, and even Human Advance is blocked or compromised by agendas that seek to hold power while diverting wealth and decision making away from citizens.
The exact same behaviours were seen in the Dark Ages and Middle Ages – a millennia-long period of human stagnation. Poverty and illiteracy were mandated, human rights and human advance were denied, science was called heresy and was judged either harshly or with penalty of death – both in this life and the next. The actions of today’s WEF SuperPAC bankers bear striking resemblance to a 9th century medieval papacy nadir, which is today regarded as the most corrupt period in human history.
Please note here that a medieval oligarchy which called itself “the Church”, should not be confused with today’s Papacy, Vatican, Priests, and an international community (of Christeners / Christians) that builds Human Rights and trains proven civics lessons in 200 nations.
Criminal Legislatures:
- Rack up huge debt
- Giving national tax dollars away to other countries with no transparency or accountability
- Increase taxes (Industrial carbon tax and clean fuel standard)
- Tell young citizens they’ll need to make more sacrifices
- Increasing the personal wealth of politicians through massive conflicts of interest (see Brookfield Asset Management in Canada)
- make housing unaffordable
- increase the costs of bureaucracy massively
- Fly all over the planet to accomplish ZERO
- Ruin what remains of important trade relationships
- Divide citizens by religion, race, etc.
- Allow violent crime to flourish
- Allow homelessness to skyrocket
- Allow access to lethal drugs to continue unabated
- Increase access to MAiD
Why are Security Ministries like CSIS and the CIA, Justice Ministries, and FBI/RCMP Police Forces, unable to defend against Global SuperPAC-sponsored harmful ideologies and illegal wealth redistributions? Because they are not illegal actions; they are actions working against human advance, but they are fully prevented in laws by Federal Courts.
Evidence-based Civic Science explains the failings of these Criminal Legislatures, which is the very reason that its obviously beneficial Performance Management is not taught in universities today. Civic Science is blocked from funding, credentialing, and curricula in the countries that these legislatures control.
In 2025, CSQ Research will work to understand – and build important Case Law to combat Criminal Legislatures in 54 large democracies today
Follow that Court Case at: Tilley vs HMK The Crown
Canadian Federal Court Case Files
See also – Law
Courts
Education
Civic Science
Our Academic Mediocracy
Corruption
De-industrialization through Net Zero
International Banking Lobby
Treasury, Debt, and Election Control leading to
Government-mandated Poverty and Wealth Consolidation
See also: Banks, ESG, Sustainability, CO2, Corruption, Election Fraud, Democracy
- 450 major financial institutions
- $130 trillion managed assets
- 45 Countries targeted
- $400 billion of capital flight from industrial investment through ESG Frameworks (Youtube 4:01)
- 22% spike in domestic energy costs
- Financial Institutions coached by a Prime Minister turned espionage agent on how to profit from publicly mandated transitions
- Not stewardship, but a direct and egregious Conflict of Interest
- A transfer of economic power from people and governments to international bankers
- Prosperity for working people is cut off at the source quietly and methodically by financial and hiring governance policy (Youtube 5:30)
Researched and Citationed concerns include:
Buying elections, installing relaxed banking laws (international banks are permitted to print money and buy hundreds of thousands of residential and agricultural properties), installing depopulation, poverty, and leadership decapitation policies that are of no benefit to electorates, bubbles, government policy according to an unelected Cabal, and wealth consolidation from public citizen hands to their financial elites.
The Glasgow Financial Alliance for Net Zero (GFANZ ), launched in April 2021 by UN Special Envoy Mark Carney, is a global coalition of financial institutions committed to accelerating the decarbonization of the economy.
- Initial Scale: At its launch, the alliance brought together over 450 major financial institutions (including banks, asset managers, and asset owners) across 45 countries, managing combined assets of over $130 trillion.
- Goal: Members pledged to reach net-zero emissions by 2050 at the latest, using science-aligned, intermediate, and long-term targets in line with the Paris Agreement.
- Net-Zero Banking Alliance (NZBA): This is the banking-specific subgroup under the GFANZ umbrella. It involves banks committed to aligning their lending and investment portfolios with net-zero pathways.
- Structure: GFANZ acts as a high-level coalition, covering sectors like banking, insurance, and asset management, and includes regional networks in Asia-Pacific, Africa, and Latin America…
- Major Exodus: As of early 2025, the alliance is facing significant turbulence, with several major U.S. banks (including JPMorgan Chase, Citigroup, Bank of America, and Morgan Stanley) and large Canadian banks exiting the NZBA subgroup.
- Political Backlash: These departures are linked to mounting political pressure in the U.S. against Environmental, Social, and Governance (ESG) criteria, with arguments that such commitments penalize the fossil fuel industry.
- Restructuring: In response to political polarization and a challenging regulatory environment, GFANZ has restructured, allowing for more flexible collaboration and reducing strict membership requirements for its sub-alliances.
- Continued Focus: Despite the departures, GFANZ continues its work focusing on public-private partnerships, such as the Just Energy Transition Partnerships.
Training Courts to protect against Criminal Legislatures
90% of large democracies are collapsing, and here’s why …
The Simple Steps of a Globalist Siege
Today’s international Consulting organizations are well-equipped to assist any national takeover. The planning and siege can take a single elected term to set up, and an armed conflict is rarely needed…
Step:
- Win an Election – Fund and Win an election with a political group that aligns with foreign globalist interests. Leaders are assured to be set in power and wealth for life with deniability and zero accountability.
- Control Public Money, Public Debt, and Spending – Use FIAT Debt money printing and lax international banking laws to create the hundreds of billions of dollars of public money needed to build this Plan.
- Banking Deregulation / Wealth Consolidation – relax international banking laws to permit the creation of trillions of dollars from nothing in support of local housing bubbles and broad costs of living increases for citizens (runaway unreported inflation) while denying good incomes (hyper competition for jobs, pensions).
- Control Media – censor reporting; permit and fund one-sided reporting (propaganda) only
- Control the Courts – Courts are a democracy’s only Checks and Balances – Only the Courts can challenge an elected Legislature in a Western Democracy, and 90% of large democracies are collapsing today. Female Equality and the Supreme Court’s majority control by an infiltrator is critical to maintaining any siege of power nationally.
- Control Bureaucracy – Legislatures can replace Ministry Executive. A criminal legislature will replace up to 80% with DEI (women and immigrants) in all ministries – targeting Justice, Finance, Education, Military, Intelligence, Foreign Affairs for new hiring that supports their election siege.

Justice Ministries are filled with DEI hires to prevent Legal definition of Ideology War as a War
- Control Major Businesses – billions in funding, grants, and lending programs will be made available to ESG (DEI compliant) companies, forcing out responsible competing companies who do not comply. See gifts of billions of dollars in public Canadian Taxpayer ESG spending to Linamar, Germany-owned VW, Japan-owned Honda, USA-owned Ford, and other multinational companies that can now force out responsible Canadian companies and startups easily.
- Deny human rights and court action by citizens – Democracies with weak human rights and Bill of Rights laws are always vulnerable, because any society’s majority “haves” can be misinformed or easily taught to ignore the death and hardships of a minority of neighbours who find themselves “have nots”.
 Herbert Hoover’s Rugged Individualist Libertarianism ideologies and indoctrination starved millions of Americans to death in the Great Depression’s soup lines and 80% unemployment and poverty in some states. This is a mass extinction event that is broadly hidden in the West today, but we must recall it so that it never can happen again.

- Teach Indoctrination; Not Education – Universities create curricula for feeder schools, which now teach indoctrination instead of education: multiculturalism, globalism, feminism, hate, wealth theory (Billionaire Oligarchies, profit, GDP, and stock markets are ONLY important in proven-false theory-based Micro and Macroeconomics.)
- Depopulate current citizenry – Female Equality hiring mandates will guarantee a 2+% annual depopulation (double the depopulation rate of WWII Europe countries). Canada’s
- Create wide Poverty – stall national productions authorizing only ESG-compliant companies and government projects; install siege designed to break down resistance by citizens through attrition over several years.
- Import a Visible Army – millions of low-compatibility, poverty-acclimatized, visibly‑different immigrants (Open Borders – and 90% military age Hindu and Sikh) – a visible minority that can be defended with virtue-signalling hate laws and specific human rights protections for these groups only. No strong country does this globally.

- Replace the current Population – The Century Initiative Lobby Group is quietly funded in Canada since 2010 and led by CEOs at Canada Pension and McKinsey consulting. McKinsey Consultants sit on the boards of BDC and other Finance Organizations to monitor bureaucratic funding compliance. The Great Replacement
- Install a permanent Siege. Make the Loss of Elected Power impossible – Hundreds of thousands of new federal workers (with high salaries, flex remote work, pensions, holidays, etc.) are hired. At the same time, payment supports for immigrants happen ONLY in key ridings that ensure a Federal Election win. The compromised Elections Canada Executive will now ensure that any close losses are decided in favour of a majority parliament for the criminal legislature. Now, “swing” ridings and provinces are always won and can never be lost PERMANENTLY, and the public funding of a criminal legislature’s re-election campaign will be 100s of times larger than competitors – as we see today. 83-times higher campaign budgets are not counting ministry advertising, $20 billion in election consulting, and indoctrination and censorship influencing which bring support to 1090-times the next political group’s funding.

- Support compliant businesses only – Support only large private businesses and globalist multination FDI companies who report ESG compliance with Female Equality depopulation and Open Border immigrant support. HR Departments ignore responsible civic leaders and now hire for compliance, fit, and social media compliance.
- Keep supporters well-funded, compensated, and well-powered – Support money laundering, Not-for-Profit Lobbies, ESG Projects, Wars, and Foreign Affairs contributions, as the country and citizens spiral and collapse.
- Separatists and Citizen Protests (Rallies to Revolutions) – can be protected against or encouraged opportunistically and per globalist sponsor goals. Leaders, and voices of opposition, can be targeted passively – for unemployment (based on social media posts), for zero funding, financing, for zero human rights; remember that homelessness is a form of murder in a cold climate nation like Canada. No one survives living outdoors for years in Canada
- Repeat – in other countries to build “Allies”. Notice that globalist leads Carney, Starmers, and Macron easily find one another at government events. They are each following the same instructions so this makes perfect sense.
See CSQ Civic Scientific Journal & Civic Science Magazine Newsletter
The Courts vs Criminal Legislatures
A Globalist Siege
It’s really this easy to create and sustain the Siege of ANY nation
How close was the United States to being locked in an election Siege?
TOO CLOSE !!
Loss of Power through democratic elections will be impossible after just two terms with this system
The Solution to Siege
Every Problem has a solution
Stop complaining about a Globalist Siege. Donate to the Advance Party’s Court Challenge of this past election and put an end to it instead

We also encourage your club or committee to run their own case as well.
Here is the simple Court Challenge that we believe can stop globalist Sieges in their tracks. Hopefully, before too many lives are lost and too much irreversible damage is done to your nation’s sovereignty…
Step 1: The Case / The Claim
A four-page court Claim that every citizen has the Charter Right to file …
Step 2: Factum: Fertility
Proof in Civic Science data explaining a national infanticide in 62 high-income democracies today, as created by a female vote for Reproductive Rights, Female Equality in hiring, and, of course, Open Borders
Step 3: Factum: High Treason
High Treason is an in-depth Civic Science explanation of how a Globalist Siege is created and perpetuated with DEI, ESG, and election controls, guaranteeing depopulation, population replacement, zero human rights, poverty, housing bubbles, wide poverty, and low production
With One Claim and three documents, a $2 fee can recover a country
Judicial Review
PROVISO, QUID PRO QUO WARNING
If you want to file a claim yourself, you may draw a Counsel for Defense or a Judge who flatly refuses Civic Data Science in his or her Court. Court officers can be compromised by Criminal Legislatures and Judges can look to staff for direction. Normal Court process for Claim, to Statement of Defense, to Trial, can be diverted by an immediate Motion to Strike and to not hear your case.
Should misdirection by the court steer you from Due Process and Trial, and your appeal isn’t heard either, there is the risk that you could be asked to pay a fine of $500 to $750, and have your case dismissed.
Look to our Discord Community Forum for NON-Professional Legal Help before and during your Claim. It’s a great learning experience, and it’s every citizen’s Charter Right as well.
![]()
Did You Know
CSQ Research’s thesis Advance Party of Canada (visit us at ACTCanadian.com) is taking Elections Canada and Provinces to the Federal Court, to remove a Criminal Legislature from office in Canada
The Claim was filed February 17, 2025 with last update filing in May
Follow Tilley vs HMK online at Canada’s Federal Court Portal
We need your help.
Donate to end the Globalist Siege in Canada, and then export this cure to every affected country
Cultural Replacement
The Great Replacement
Cultural Replacement – is a globalist tactic that assists in gaining control of constitutionally weak democracies to give power indefinitely to political groups that support an invading army of immigrants and harmful ideologies to fill a nation – and to replace the people who built the country
The Great Replacement – is a term that often adds an anti-white spin onto the same problem – see the PBS Report on it here
Read about The Great Replacement harmful ideology at PBS, Wikipedia, WAOH, and others
… or read about the Century Initiative in Canada. Canada’s well-funded Great Replacement Lobby is headed by the CEOs of Canada Pension Plan and McKinsey Consulting, championing the theory that more population (that vote for Liberals exclusively – as an Election Fraud) make a better economy.
Nothing could be further from the truth of course, as showcased by the UAE whose 1 million citizens and 9 million VISA workers have created an economy 1/4 the size of Canada’s – see Immigration
DID YOU VOTE FOR THIS?
NO!?
With elected power, reports of a nation’s collapse can be hidden—often in nations with weak constitutional protections against this.
Public funds can now pay for indoctrination in our schools, televisions, and social media – explaining that “All is well” and that we should “be happy to own nothing” and to have our people depopulated. At the same time, immigrant cheap labour displaces the citizens that foolishly elected these globalist political group traitors.
If we object to being replaced, we are guilty of Hate Crimes as well – by the way
This year Canada and the US have seen the greatest immigration push in their history – at a time of economic and social vulnerability and inflation. The impact has been to destabilize us when we are least able to afford and integrate these masses into our culture, laws, employment, healthcare, and housing systems
Even if immigrants and illegal immigrants cannot vote, their presence makes the votes of their democratic leaders more influential; now able to control more electoral votes in the USA for example
Are groups that sponsor population replacement Traitors?
Canada’s Constitution is poorly equipped to defend against an attack on the country by its elected officials. Yet, even it defines High Treason as anyone who brings a War to the country
Wars are measured by Depopulation
All wars are measured through history by the rate at which they depopulated their participants. World War II, for example, killed between 30 and 40 million persons in battles (with tanks and bullets), in concentration camps, and similar. It killed another 30 to 40 million with runaway starvation and disease caused by the interruption of basic human rights and supply chain services. World War II is realized today to have killed between 60 and 80 million people.Feminist sponsored fertility Depopulation creates the same casualty rates as WWII Europe experienced (1.5% annually), so anyone who purposefully depopulates a country while increasing immigration to hide this fact, is guilty of waging an Ideology War. There are no guns, tanks, and bombs in this war, but a nation’s casualty rates are the same 1.5% annually – and this problem is seen in 64 high-income countries today. See also Fertility

When/If a Court of Law agrees that a political group has created a legitimate War against its own nation, the answer to this question is Yes: the group are traitors
As this is a risk for the planners of these assaults, Justice Ministries will tend to be restaffed at first opportunity with new leadership mandated to install woke diversity or immigration-supporting staff members systemically – as we see in Canada, where Law Societies and Ministry offices are today 90% filled with “DEI hires”

Justice Ministries are filled with DEI hires to prevent Legal definition of Ideology War as a War
See Immigration & Culture
Diversity & Inclusion
DEI is Diversity, Female Equality, Inclusion


See also Harmful Ideologies
$200 trillion lost annually
DEI belongs to a family of Globalist-sponsored harmful ideologies that lose the global economy $200 trillion and a reliable 1.5% depopulation – annually *EVERY YEAR
See Criminal Legislatures
Social Contract Loss
Harmful Ideologies
Wealth Theory
Diversity – is a GFANZ/WEF (World Economic Forum), and McKinsey nbusiness lobby whose hiring laws and business practices ask societies to prefer division based on “special groups”. Racism, Sexism, Ageism & Lost Human Capital is preferred to responsible nationalism, culture, families, experts, merit, and family pensions; and prefers to support:
- corporate profit
- election fraud – low-compatibility immigrants could vote for just one irresponsible and criminal party
- starvation wages
- tactical business profits – that create national Production and Social Contract Loss of $4 billion daily
- business devaluation
- government dumbdown
- housing bubbles
- cheap labour
- hypercompetition – for jobs, housing, pensions…
- suicide
- divorce
- Unsustainable fertility rates – A Gender Equality Genocide explains DEI’s Crime Against Humanity population losses are equal to WWII European nations (1.5% annually)
- offshoring, and
- onshoring
ALERT: At the time of this writing, EVERY A.I. writing co-pilot supported DEI indoctrinations – at:
- Microsoft
- OpenAI
- Wikipedia
Criminal? Consulting Firms
McKinsey’s argument was their Power of Parity Report, which compared projects in two countries and misused the accounting theory of “Economic Output” to report that women’s unpaid work (unmonetized caregiving, etc.) increased an unimportant GDP Report. For this goal, they presented incorrectly that monetizing this unpaid production is an “economic benefit” worth $12 trillion in growth globally.
Boston Consulting made the case that Diversity created Innovation, but we found that real-world evidence proves this theory/assertion is neither quantifiable nor true. Canada is a former G7 and #4 in Innovation, now a G9 and 16th (15th in 2023) in Innovation, and now hobbled by the strongest division and anti-citizen Diversity Laws in the world (see Bill 25). By comparison, China has risen from the stone age to 12th place on this Innovation Index in the same time with none of these harmful ideologies or collapsing democratic system manipulations
These claims were not credible, not true in evidence, and met only short-sighted business goals and Election Fraud political goals
Why?
- GDP – is NOT an important economic measure.
- Female Equality – GUARANTEE WWII levels of depopulation (1.5% national infanticides annually), and when you run projects with cheaper labour and no pensions (in two countries or the same country), businesses will report higher profits and “All is well” – incorrectly.
- Business Profits – DO NOT benefit economies. Monetizable Productions benefit economies, but Profits simply take money out of circulation, pump it back into meaningless stock markets, or store money offshore when no regulations prevented this “Business Best-practice”. Find this Proof explained under Profit
- Election Fraud – “Girl Power” campaigns win elections and legislative power in 62 democratic high income countries
The last, but not least important reason for policy adoption, was that Oligarchs benefitted directly
Oligarches benefited while societies and widespread prosperity were diminished; so these policies and political groups found funding easily – from PACs (see political corruption)
Asian Governments and Monarchies
Eastern Governments were not influenced by Oligarchy controls, so their performance soared …
Merit, human capital, family pensions, males, and experts – are purged from universities, government, business leadership, and even the job market completely – for the sake of corporate profit and votes for reprehensible woke feminist and harmful ideology-led political groups in the end
The one-million dollars per employee pension saved by corporations using this policy boosts business profit; a measure that adds no benefit to economies or societies whatsoever. Meanwhile, firing “expensive” twenty-year expert middle-manager fathers and employees – who were suddenly unpensioned and unhireable – creates a ticking timebomb of retirement support costs that fall back on society to pay for. Any society that supports these firings trades a well-pensioned citizen and economic and family contributor, for a wholly-dependent, impoverished, and likely-divorced male senior citizen. Human Capital (experience, new science, and learning after University) is wasted/lost while suicide, divorce, and euthanasia soars
A male kills himself at a reliable proven rate of .8% of men for every 1% unemployment – through overdose, alcohol abuse, or other reckless actions
During the terms (of inevitable collapse) that these groups hold power, populations lose 1.5% due to infertility annually (the same population loss as WWII Europe) and hide stats for suicide and 40++ other serious social problems which will continue and snowball reliably
Example Problem Nations
Canada is a good case study example for the collapses created by these policies. It now has the highest male suicide in the G7 (since these laws were enacted) and has the highest assisted suicide in the world – up 125% in just 5 years. In a study by the New York Times, it was found that men commit suicide at a rate of .78% for every 1% of unemployment
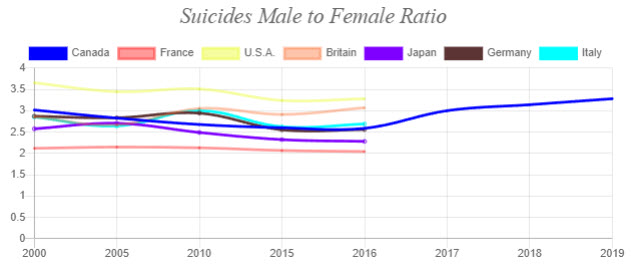
What about production and productivity? Canada’s economy loses $4 billion per day today and sits at 1930s levels of production growth. A fact that is unreported by political groups who can block media reporting of this collapse
Once installed in a position, “diverse” employees use “fairness doctrines” to hire persons like themselves: people within their “special groups” – be they a religion, minority, race, their own age group, etc. This harmful practice continues until an entire generation of country-building experts, human capital expertise, and builders are left without pensions, families, incomes, and basic supports of life.
Haters, Racists, Misogynists
Citizens who oppose these social harms suffer name calling, cancel-culture, deferential treatment by indoctrinated children, firing, demotion, failed funding applications, loans, the loss of executive and board influences, income loss, euthanasia, and suicide
“Diverse Boards” are an insult to intelligence and human advance, that fill leadership boards 100% with women, special group minority activists, non-expert followers, and like-thinkers 100% – and then call themselves a “Diverse Group”. This is the opposite of a diverse group or expert leadership because they are, entirely a group of tactical, unqualified, anti-expert, anti-merit, anti-family-values, racist (against native males), disrespectful, unscientific, indoctrinated, nation-collapsing, crimes against humanity-creating, vote-grasping, opinion and ideology-led decision-makers
“Dumbed-down workplaces” vault oddballs and low-CSQs (low-Common Sense Quotient individuals) into leadership positions and investment boards, where they are the least capable of realizing their shortcomings, harms, and collapses
A nation’s Businesses are devalued and its Governments dumbed-down
Similar examples in History
Similarly, Stalin’s Russia eliminated leaders from the populations of famously educated and brilliant Poland after 1945
Election manipulation
Elected power can be held indefinitely by the obvious majority of 50% women, plus open borders policy immigrants, plus minority groups
Inclusion
Inclusion – is “hiring for fit”, an HR (Human Resources) law and practice that discourages hiring leaders, experts, human capital experience, and workplace learners. Inclusion confirms that experts and experienced leaders are not as important as consensus opinions. Thousands of people believe the earth is flat; 40% of Americans believe in angels; that the earth was created by the “God” explained in the bible; the point here is that consensus of opinions among us is completely irrelevant
Applicants seeking income now find their resumes added to a stack of 40 or 60 others, which will be evaluated by non-experts who are unqualified to recognize an expert or train up any deficiencies that come to light later
Public Harm by Public Spending
When billions of dollars per year are spent in media advertising aimed at convincing us through propaganda; that lies are truth, that only “bad people” don’t believe in harmful ideology, and that you can only find a career or income when you agree that lies are truth, a society collapses – due to its poor civics training and poor values
Right isn’t real; Left, Socialism, Communists, Neoliberalists, Feminism, etc. are creations of our indoctrinations entirely
A hidden genocide of 50+ aged males results from this policy as heads-of-household experts (20-year managers) are seen as too expensive and ignored by federal hiring laws, which prevents meale citizens from finding incomes
The Solution
The scientific solution here is Family Values, Single Income Families, Living Wages, Affordable Housing, Assurances of Income and Living Wages, No Immigration during mature capitalisms, No False Idols (Harmful ideologies), Merit, Experts, Leaders, and high-CSQ Leadership by Civic Science Experts
See also: Ideologies
Divorce
One of the most heavily disguised stats in Western nations today is Divorce
National websites in the west go out of their way to present meaningless measures, and completely hide the impact that the erosion of the family has had on sustainable fertility rates. Immigration is often used to hide the reliable 1.5% annual WWII Europe-like depopulation rates created by anti-family “Girl Power” election campaigns and indoctrinations, and to further support election fraud by these groups as well
Divorce Statistics in Canada
According to the Merchant Law group website:
- The average age of divorce is 46 years old, more than old enough to have attained significant marital assets
- 40% of marriages end in divorce
- Spouses can file jointly for a divorce, and 31% of them do just that
- Canada has the 29th highest divorce rate in the world
- Only 8% of Canadians have prenuptial agreements, despite the high divorce rate
- The divorce rate is lower among couples age 50 and up, amounting to just 26%. This is still nearly a quarter of the marriages within this age bracket
- The average Canadian divorce costs $18,000
- The average Canadian divorce takes 3 years. The minimum amount of time is generally 12 to 18 months, but it can take longer if both couples spend a lot of time fighting over the settlement
- 60% of second marriages end in divorce
- 73% of 3rd marriages end in divorce
- 34% of divorces are caused by domestic violence, verbal abuse, or physical abuse
- Infidelity accounts for 27% of divorces
- An average of 25% of couples report that money problems played a role in their divorce. In 41% of cases, money problems serve as a “last straw” among many other issues that are already weakening the marriage
- 38% of those who try couples counseling still get divorced once they stop going, though attending therapy can offer 4+ years of increased marriage satisfaction
What does Statistics Canada Report about Divorce?

The top Google Search result for “Divorce Rates in Canada” is a CBC article that makes heroic efforts to avoid explaining straight answers to the question – as seen above, and a Google Home search will explain that Divorce rates have dropped steadily since the 1970s
See also: Marriage and Arranged Marriage
Dumb Down
We elect the least-qualified among us to run countries – into public office based on their ability to tell us voters anything we want to hear, fueled by the financing of industrialists who only hire agreeable politicians, and then we wonder why nothing works
90% of large democracies are collapsing
We hire for “fit”, which means we hire followers; anti-expert, anti-leader, anti-merit, anti-male – and we believe this is going to build a better society because we saw it on an advertisement – that might very well have been funded by a foreign country hoping to weaken your nation
CSQ Research is putting together a Common Sense Quotient Test (similar to an IQ and EQ test), and we strongly recommend that you read through the WAOH Library and then take the test
Economics &
Economists
Wealth Theory
Economics and Economists are Wealth Theory Indoctrinations proven to collapse economies reliably – citation
Since the 1980s, Western University Economics Faculty curricula has rekindled the Neoliberalist teachings of 1920s Wealth Theory; a collection of ideology and indoctrinations that created the Great Depression and have no foundation in truth or reality
Aristotle explained that theory is fiction when it is proven false, and that “experts of fiction” are experts of nothing in reality
No Science supports indoctrinations of Supply, Demand, Cost, Profit, Labor, GDP, Stock Market Performance, Sales Economies, U-3 Unemployment, Finance Accounting, etc. – and much actual science (education) proves them expensive, false, and dangerous
Here are some of those proofs:
- Wealth Theory Collapses Economies
- 90% of Large Democracies are Collapsing today
- Economics and Economists cost every nation $4 billion daily
- Economics and Wealth Theory are Harmful Ideologies
The Nobel Prize (an international esteemed award for all sciences) brand was hijacked in 1971 by the Central Bank of Sweden’s successful spin-off of a separate Prize Committee. This group have only awarded Nobel Prizes (for Science in Economics) to indoctrination and concensus ever since
The Nobel Prize for Economics has never once Awarded an actual science to this day
Alfred Nobel’s grand-son Peter Nobel, has been campaigning against this clear propaganda for his entire career
See also: Microeconomics, Macroeconomics, Economy
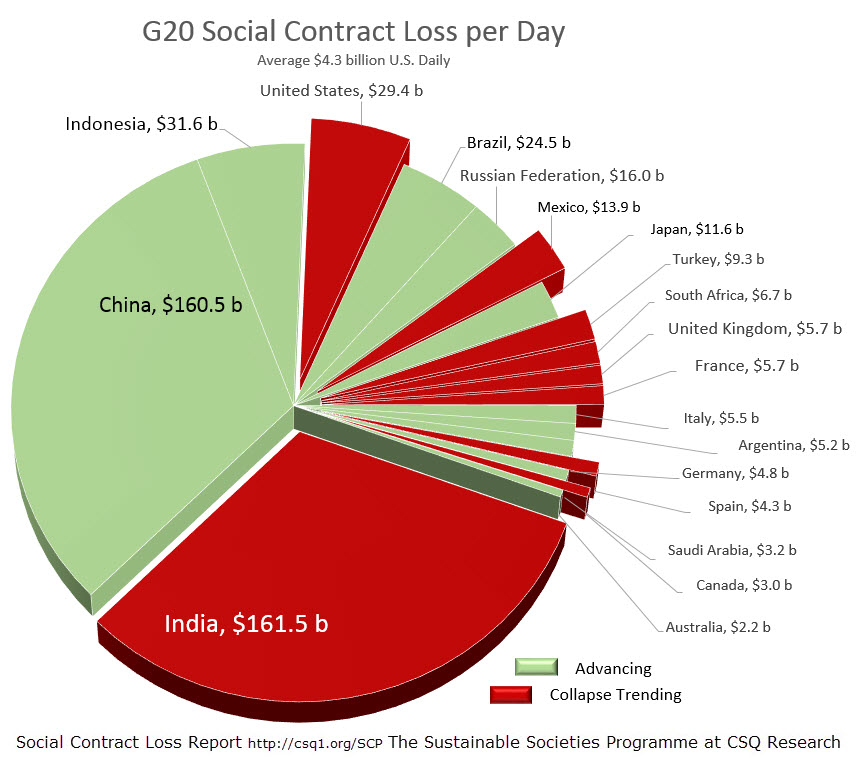
The Solution – to Economics Indoctrination
The solution is to simply Deprecate Economics and Economists
Civic Science and Civic Scientists explain and teach a 100% truthful curricula for how economies work and advance
ESG
Environment, Social & Governance

ESG is the Finance Industry’s socially irresponsible cousin to Diversity and Inclusion
See also: Harmful Ideologies
ESG pits finance and government investment against environmental, social (human advance), and national advance, and then call it “Social Governance” as well
Environment – read CO2 to understand that Carbon Neutral policies are both devastatingly harmful for human life and vegetation on this planet, and a distraction from the actually essential important social issue of Wealth and Income Inequality
Social – is hiring by DEI Diversity and Inclusion guidelines, forcing every investment and operating business in the country to work against its own productivity, experts, human capital, and success. hidden genocide of over-50 males can result from this policy as heads of households are seen as too expensive and ignored in hiring and prevented from securing incomes
Governance – 90% of large democracies are collapsing today; 70-years-ago, businesses created the greatest economies and societies in history, so – clearly, what passes for governance today – in university curricula, government, and in business best practice – is whatever media-based propaganda and indoctrination an elected political group can still be re-elected with
Universities fail 60% of males students, they graduate 75% of their degrees without teaching any science, and these institutions retain the right to issue degrees (expert credentials) because this unacceptably low performance passes for “Governance” today – in collapsing nations like Canada, the United States, Britain, France, Brazil, and so on
FDI In
Foreign Direct Investment Inflows
In science, FDI-Inflows offer no benefit. Foreign Investment is only a benefit when a nation can invest capital and business in other nations – outbound as FDI-Outflows
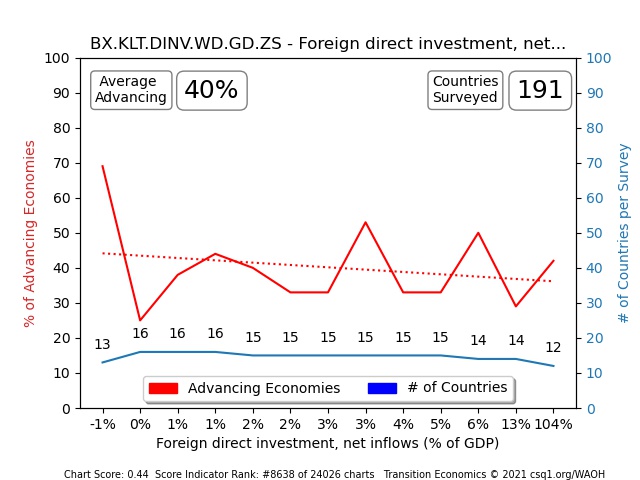
Once FDI Inflows are implemented, a nation collapses from within …
FDI Inbound is foreign ownership that competes with, or prevents, the startup or success of local companies and owners
FDI prevents local executives and local living wages at all levels of this business’s production – in most cases
Finance Industries
Deregulation
Unregulated, bloated national Finance Industries are proven to harm economies reliably
Greenwashing Energy
Wind, Solar, Storage, and Oil is High-Cost Energy
Every pilot will tell you that the best time to learn to fly is at dawn and dusk, because there is no wind. These are also the peak energy loag times for any nation’s energy infrastructure
Wind and Solar could be easily fit into a finance investment portfolio that made financiers wealthy, so these poor technology fit were widely adopted in the west
Nuclear Energy is abundant and clean; and Thorium is more abundant and safer than the Rapid Breeder Uranium reactors we use today
As proof, Case Study Germany’s higher-cost “Green” Energy infrastructure versus France’s abundant, cheap Nuclear
Homelessness
Obviously, homelessness is a preventable hallmark of poor leadership
A “Good Home” is an essential basic human right of every Constitution
See Good Homes
EVERY Constitution with this provision advances its nation; while all that don’t – collapse
CASE STUDY: Constitutional Science
Homicide (Murder)
Gun Homicides
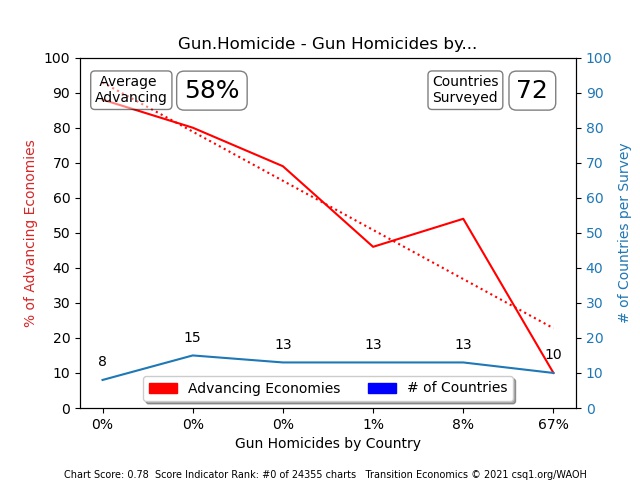
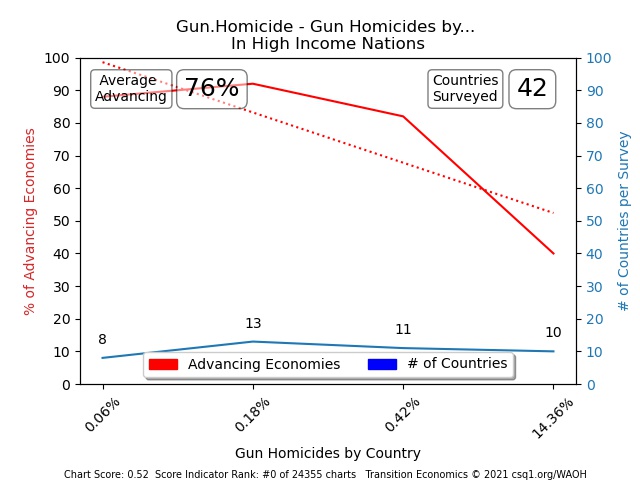
Gun Homicides create collapsing societies and economies; this fact is true in every nation and in high-income nation surveys too
Guns Kill People – because murder is always higher in countries with easy, unregulated access to guns. See article: Guns Kill People
Gun Lobbyists are quick to insist that People Kill People – with guns or any other weapon, but international statistics DO NOT SUPPORT this lie
Dysphoria – Guns create Dysphoria (unjustified panic, paranoia, and fear) in owners and gun rights supporters, high murder rates, and a broad fearful siege mentality and mental illness that drives affected individuals to reject civic facts, values, and education irrationally
Constitutional Lies – the USA’s Second Amendment states clearly that citizens may own guns only if they are part of a formal militia. Politicians agree to misread this law to win votes, elections, and power; and today’s world’s highest crime, murder, and incarceration rates – explain the dystopic conditions and siege mentality that armed citizens (guns) create in any nation
Immigration / Emigration
Open Borders
Mature Capitalisms (Great Depressions) imbalance Cost of Living to Salary Ratios in mismanaged nations every 60 to 70 years
During times of mature capitalism imbalances like today, Immigration, Open Borders, Offshoring, and Onshoring drive:
- Unemployment (U3 unemployment reports hide true statistics by 100% and more)
- Hypercompetition,
- Starvation wages
- Poverty
- Suicide rates
- Social disturbances
- Lower Export per Capita (National Revenues)
- Lower Income per Capita
- Democratic Election Fraud, Vote Rigging, and Corruption aimed at maintaining imbalances that benefit a minority
Immigration had to be greatly discouraged in our last mature capitalism
Immigration is an unsustainable policy during a Mature Capitalism
We saw this clearly during the 1930s when responsible governance was installed in the USA under the FDR Administration
Yet, in Criminal Legislatures, Open Borders policies will work to gain permanent elected power by flooding swing ridings with immigrants accelerated through national naturalization with Nonpermanent Resident processes

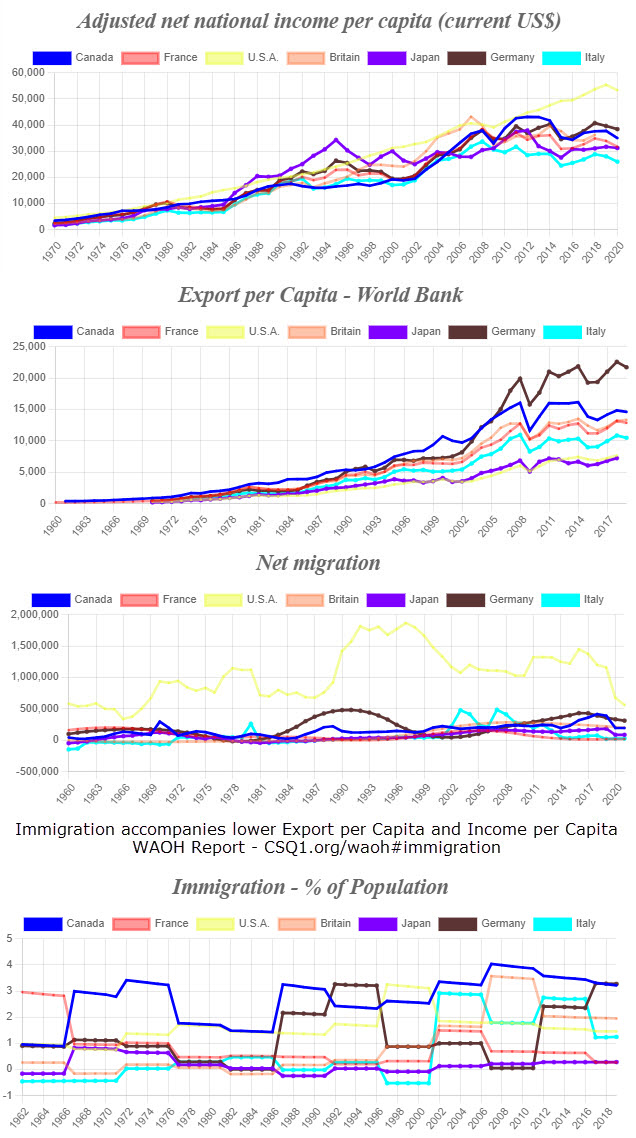
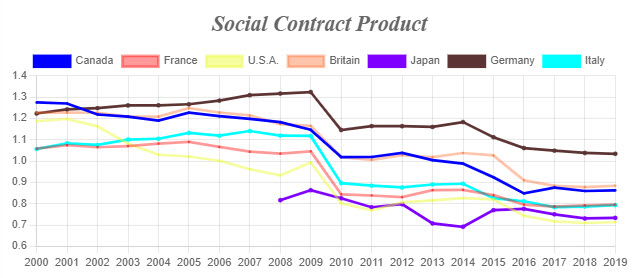

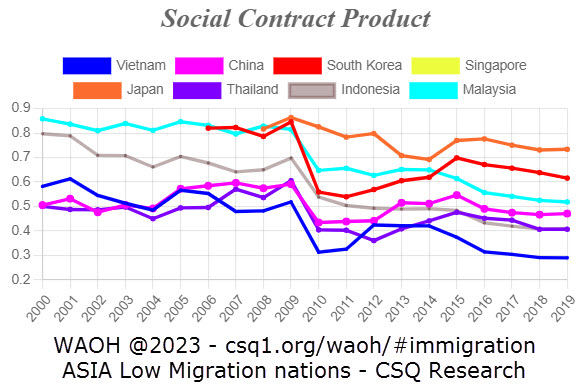
ImmigrationExport per CapIncome per CapHousing BubblesCost of LivingLowest 40% Income GINICost of Education
Immigration and Election Fraud
Immigrant Election Fraud
See also Election Fraud
One of the most obvious trends of recent globalist woke campaigns is high Immigration Rates intended to sway voting and hold democratic power
Often, the hiring of illegal or partisan-voting immigrant groups before citizens (usually military-aged males) will be given top priority by political groups seeking to retain control of the country – with little regard for the destabilizations that irresponsibly high levels of immigration bring to any country. Canada’s Bill C-25 was an example of one such law passed in 2020 that created citizen unemployment, suicide, dumb-down, and business and government devaluation as immigration rates reached record highs and production growth slowed to 1930s levels
America’s recent illegal immigrant waves (estimated 20 million voters) are tabled to be allowed to vote (for Joe Biden’s campaign) in 2024, as another example of democratic corruption
Ontario, Canada, spends $1 billion per month on hotels for a flood of refugees and immigrants, while Canadians fill homeless camps – unable to find incomes or homes nor even to file a Human Rights complaint.
In Canada, Human Rights Tribunals only accept “Complaints of Discrimination”, which means Canadians live in a Pure Democracy – where 51% can starve the 49% to death legally and with impunity. This is the reason that Aristotle called Democracy an Evil form of Government. An Evil government systemically fails empathy toward its citizens, as was also the definition of Evil explained by the author of the Nuremberg Diaries, Gustave Mark Gilbert.
See also – Systems of Government
State TV propaganda in Canada has completely shut out reports of the European Parliament’s election losses after riots and mass marches across Europe called for an end to immigration. CBC reports lauded the contributions of immigrants from 50 and 100 years ago, in an uninterrupted pro-immigration support campaign
On the strength of arguments that count the high costs and harms to any nation that is facing the corruption of immigration in a mature capitalism, harms which are undertaken with the intent of unfairly winning elections and power, a legal argument can be made for either Treason or High Treason by the offending political organization and its leaders
See Political Party Certification and Monitoring for the solution to this problem
And, of course, you will be accused of racism and hate crimes when you oppose these obvious corruptions of a nation’s democratic electoral system
Open Borders
Canada, the US, and Europe have seen the greatest immigration pushes in their history – at a time of economic and social vulnerability and inflation, which is destabilizing all nations when we are least able to afford and integrate these new masses into our cultures, laws, employment, healthcare, housing, education, and healthcare systems
Non-permanent Residents
See also Election Fraud
Corruption
Here we see a rush to Nonpermanent Resident status in Canada, which is a device used to reduce the time needed to become a voting citizen. The Trudeau Liberal government reduced Canada’s immigration naturalization period to the lowest in the G20 – just 3 years, in 2017
Even where immigrants and illegal immigrants cannot vote, their numbers are counted and still make the votes of their democratic leaders more influential. Regions and ridings with more open borders immigrants are now able to control more electoral votes – in the USA, for another example
Naturalization
Naturalization is the process of citizenship in every country. Immigrating to a new country, and then becoming a Citizen there, are two distinct processes. The time needed to become a citizen is called Naturalization
Wikipedia maintains a list of the years required to become a citizen in every country – see Naturalization
Nations that are under democratic siege (election fraud, depopulation, and population replacement programs) as we see in Globalist strongholds like Canada, Poland, Britain, Ireland, Greece, Spain, France, Australia, and similar, will find their naturalization years reduced quickly. Since 2017, Canada has had the lowest naturalization requirement in the world at just 3 years, reduced to the lowest in the G20 by the globalist Liberal party under Justin Trudeau.
Swing Ridings
An election win is all that is needed for a criminal legislature to open borders and fill “swing” ridings (electoral ridings with a close split of its votes for one party versus another) with low compatibility immigrants (immigrants who deficate in public, have different values, etc.) so that citizens who object to this election fraud’s high treason (bringing an army and war to the country) can be accused of hate crimes and then criminalized and incarcerated by the globalist political party who has now secured permanent election wins.
What follows next?
Rallies and peaceful demonstrations, escalating to rioting, national sovereignty separation, civil wars, and government overthrow.
Nothing good, in short.
Church Burnings
Central to the replacement of culture in Open Border Immigration nations is the destruction of cultural landmarks and historic community gathering centers
Canada has seen 100 Churches burned down – most in arson cases since the Trudeau government’s Open Borders Immigration replacements of the last few years, while reports of major church burnings are immediately played down by PMO reports as accidental even before fire marshalls can determine the cause of the fire

See Cultural Replacement and Culture
Immigration creates Homelessness – for Citizens Only in some cases
In nations where Open Border Immigration is used as a democratic election fraud, laws are often changed to support immigration at the expense of citizens
Canada’s recent explosion of homeless camps are filled not with immigrants but with Canadians almost exclusively. Immigrants rely on foreign-financed rental properties to provide income and wealth, while laws like Bill C-25 ensure hiring prefers immigrants and women to local male citizens
In this photo, homeless Canadians are portrayed with U.S. Contractors whose job it is to make poverty a crime by issuing “Accountability Forms” with all monetary aid stipends – that usually amount to 1/6th the cost of living. In Ontario, Cost of Living is $3200 per month while supports are $700 per month; rents start at $550 for a room in a house – to an apartment for $2000 per month; a roast of beef costs $250 at Costco here
Welfare Lies
Welfare is not “paid for by taxpayers”, as corrupt Left Depopulation and Right Wealth Theory politicians like to suggest
The most successful nations in the world charge NO income tax; other nations give money to businesses with the expectation of production and that they will also pass money, profit, and pensions to employees. Money is created by a country and distributed in any way it chooses
The fact here is that a political group that chooses to tax its citizens and then indoctrinate the population in schools and the media to believe this is the only possible solution is an example of politicians lying to voters. The decisions to charge income tax and to support citizens who cannot find the human right to an income or a good job are two completely separate discussions
Often governments who rely on Open Borders for winning elections (election fraud) will create laws that make local citizens the last possibility of hiring as well – as I mentioned above, citing Canada’s Bill C-25
The Great Replacement
Immigration can install the Great Replacement Theory harmful ideology – see PBS, Wikipedia, WAOH, and others
… Read about the Century Initiative in Canada
Do voters vote for this?
Not Usually
Are voters even invited to know about this planning and harmful spending? Often, No.
See Century Initiative article website
NEVER PERMIT REPLACEMENT THEORY
The UAE (Emirates) is a 43c sandbar the size of Cape Breton – with 1/4 of Canada’s economy. Canada has 100 times their land and resources. They have 1 million citizens and 10 million VISA-carrying foreign workers; they have free healthcare, free education, no homelessness, no income tax, and the richest citizens in the world.
NOTHING is not working with UAE’s leadership – and Canada can never decimate our culture and current population for the benefit of anyone’s treasonous, harmful depopulation, election fraud, and replacement ideology.
Q1: Did you vote for this? Q2: Did you even know that it was being executed presently – and for the last x years? Q3: Has the Media and Press reported this? If the answers are NO, NO, and NO, you have a serious failing in your systems of government, election, and democracy.
Immigration is always a Collapse Policy, especially in unbalanced mature capitalist economies, such as 90% of large collapsing democracies at this time.
The Economies that have outpaced the G7 for the last 25 years allow Work VISAs and Student VISAs only – see below.
Immigration Consulting Firms
Immigration Consulting Firms create a cottage industry in nations that permit immigration loopholes
The number of firms jumped from 6000 in 2018 to 12,000 in 2022 in Canada alone
Medical System Hitch-hiking
Immigrants and international students can now invite family members – parents, grandparents, etc. from abroad, to obtain “free” state-paid medical system visits and treatments for everything from annual physicals to cancer treatment, transplant surgeries, and dental treatment
Work VISA
and Study VISA
International Student VISAs
It’s no secret in Canada that international study permits are being used as a backdoor into the country. Canada hosted more than a million international students this past school year alone
22,000 Immigration Consulting Firms have helped foreigners obtain post-graduate work permits and then permanent residency in Canada since 2018, and military-aged Hindu and Sihk East Indians comprised 10 times any other group
In all nations that have not fallen victim to collapsing systems of democracy, a Work Visa or Study Visa is all that is issued to foreigners seeking to work or study in their country, and then these individuals return home when the VISA ends
There is no invitation to family members, no medical hitch-hiking, no cottage industry of Immigration Consultants, no democratic systems corruption of any sort
When is Immigration a Benefit?
Only in Boom Economies can Immigration be a benefit, when it can help to monetize the abundant opportunity available in those times
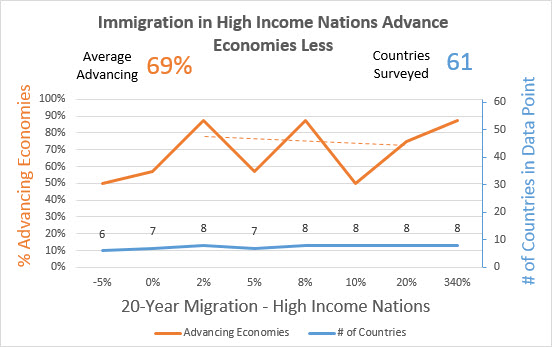

Immigration versus Racism
Immigration is an unsustainable policy, and voicing this fact is never racism
Harmful political groups might suggest the two arhttp://@valuese the same when their voter majority is strengthened by immigration in unsustainable Diversity and Inclusion campaigns
A proper Constitution’s full set of Human Rights, education, and Policies of Good, Respect, and Human Advance, eliminates racism concerns in the long term for any nation
Imports with a Trade Deficit
Imports with a Trade Deficit is unsustainable
Imports with a Trade Surplus is sustainable

Imports Collapse Trade Deficit Nations
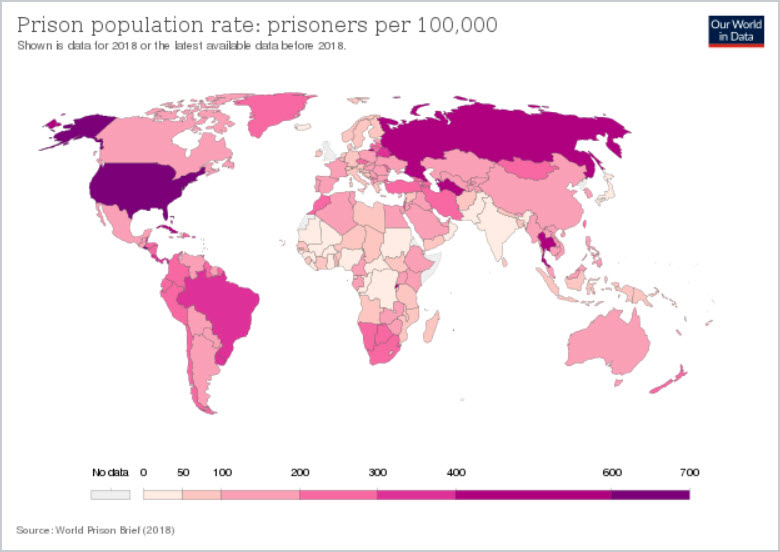
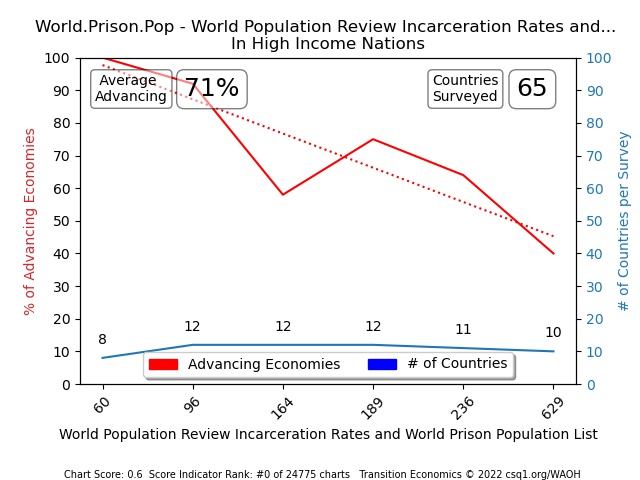
Denial of Income
Unemployment
Truthful unemployment and wage reports have not been shared since the 1950s or 1960s. U-3 is the only report we see today, and it ignores the overall job losses seen in Labour Participation Rate reports entirely

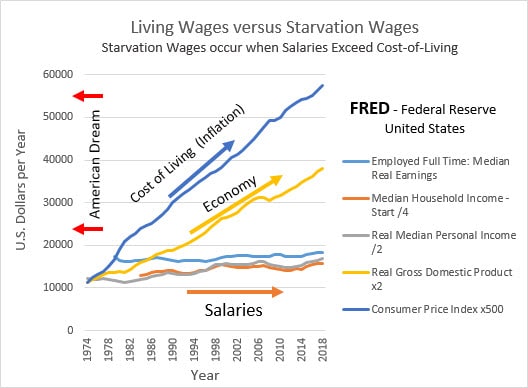
Shadow Stats does a good job of removing the creative accounting done by governments and it places the correct US unemployment rate at around 25% today
By Labour Participation, the USA has 16 million fewer jobs today than it did in the Year 2000, and Canada has 1 million fewer jobs since 2008
These fewer jobs are true despite rampant immigration in both Canada and the US, making immigration an irresponsible policy
Inflation > 4%
Inflation has a devastating impact on societies with income inequality problems, and as most Western countries today have an extreme income inequality problem, this probably affects your country
Inflation is also very under-reported by democratic nations – whose politicians fear losing power when they report Inflation or a CPI (Consumer Price Index Report) increase
CPI
In the 1970s; US President Nixon printed money in order to win re-election by making the economy look stronger than it was. Inflation soared as a result however, so he removed 70% of the items reporting inflation by the CPI . Items removed include housing mortgages, insurance, rent; motorhomes; foods – coffee; healthcare, etc.
CPI Exclusions – continue to this day, with the consistent intent to hide Inflation from the public. See “Discontinued CPI Series” at the US. Bureau of Labour Statistics
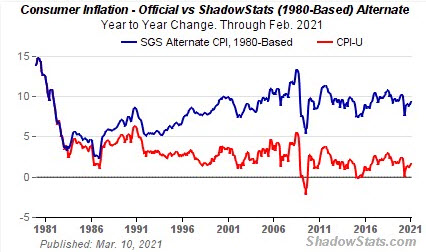
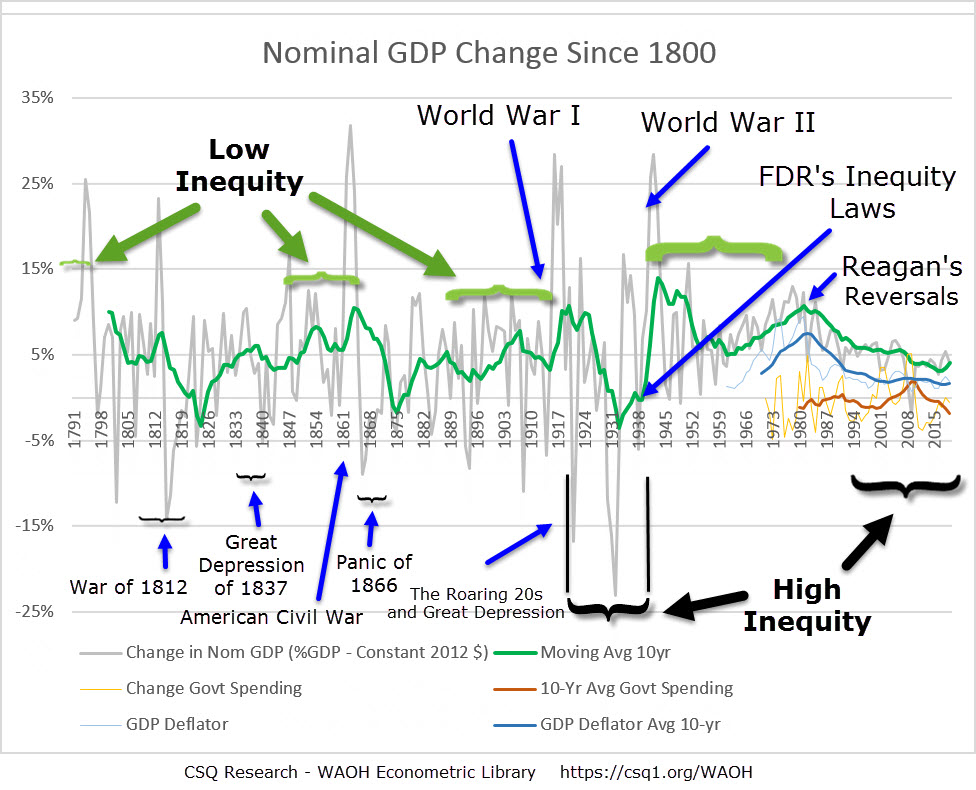
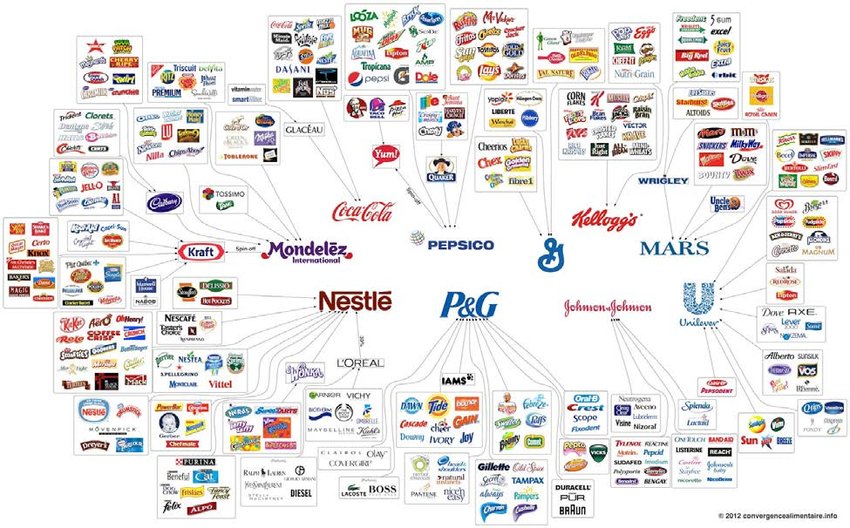
Monopoly through corporate consolidation and buyouts drives profiteering, price-fixing, inflation, and poor redundancy in supply chains
See the OECD’s recent efforts to deconcentrate institutional finance industry investments here
Inflation is not corrected by the theory-based practice of increasing interest rates or decreasing government spending – or anything short of regulation really, and it’s created by a heavy reliance on imports and by too-large companies that benefit from inflation, who collude to price-fix higher prices and profits for oil, wood, steel, energy, and all component needs of manufacturing and production
Cumulative Inflations = Cost of Living
When a political group wants to keep News Reports positive (so that they can be re-elected), they report a subset of inflation measurements from the CPI Report
Also, when a 4% Inflation rate in July is reported as “a great win” because last November’s rate was 7%, Inflation is reported as going down but Cost of Living is consistently climbing (4% + 7% = 11%) – while the Salaries and Incomes that must somehow pay for this inflation – are not moving, or are decreasing, and this fact is seldom reported
Correcting Inflation
“The best method to stop inflation instantly is by cutting off profiteering at the start of its upward movement – issued by a regulation to waylay greed.
Profiteers are usually the real drivers of inflation because they set prices from the top, indirectly controlling both supply and demand for goods and services.”
Barbara Ellis – 2022 article “Nixon’s Price Freeze did stop inflation“
Regulation – stops inflation in its tracks immediately – and it can reverse inflation also
FDR – The greatest turnaround in history was successfully implemented by Franklin Delano Roosevelt’s administration in the 1930s and 1940s. The economy continued to grow reliably for another 40 years based on these laws and regulations
Nixon – did two things:
- He hid Inflation. He removed 70% of the CPI Report’s measures – which remain stripped out of the CPI Report to this day
- He froze Prices – by Executive Order- initially for 90 days, and then he kept on top of changes for 2 years
Reagan – uninstalled the laws implemented by FDR and simply recreated the problems seen in the 1920s again. Deregulation restarted the consistent decline and 40-year collapse that we can see today in the chart above
Today’s Solution: ACT Parties, Civic Scientist Certifications, and Monitoring
What does Academia Teach?
Which solutions do we teach students in universities today? We don’t teach FDR’s Advance; instead, we teach Reagan’s Neoliberalist Wealth Theory and Collapse – which were the same GOP teachings as in the 1920s that created the Great Depression in just 10 years
Is everyone impacted by Inflation?
The Rich benefit from Inflation
The Super-Yacht Industry is booming in 2022, while the lion’s share of society suffers from unaffordable and rising costs for food, transportation, and supply chain finished goods without corresponding new incomes
See Housing Bubbles to understand how to correct inflation problems also
What are politicians doing about Inflation?
Are they fixing the inequality problem? No.
Instead of solving the problem, politicians are blocking:
- their citizens’ abilities to hear and see legitimate reports of Cost of Living to Salary Imbalance and socioeconomic collapse
- the ability of citizens to assemble and peacefully protest
- legitimate news and media reporting
- shadow-banning comments on social media by citizens defending the country’s human rights: food, a good home, reliable incomes, pensions, education, etc.
See also Corruption
Laissez-Faire
NeoLiberalist ideology Laissez-Faire – calls for low or no regulation in Business and Finance Oversight. This policy is ill-suited to mature capitalism imbalances
Laissez Faire is an unsustainable business practice, but less regulation enforcement is recommended during Boom Economies whenever it helps to monetize the abundant opportunity of those times.
The caveat here is that full Human Rights are essential to this exception, even in Booms
Left versus Right
Division by harmful ideologies are failing Democracies

90% of large democracies are collapsing today because of this problem
Right – is assured collapse by neoliberalist conservatism and libertarian individualism ideology (citation)
Left – is virtue signaling that creates a 1.5% annual infanticide and Crime Against Humanity in any nation (citation)
“Female Equality” campaigns win elections in 64 of 70 high-income nations – because reports of the genocide and poverty created by its hiring and investment policies are hidden
Both:
- tell you anything you want to hear
- seek power
- collapse your country and communities (average cost is $4 billion daily in every country)

- they hide collapse (through GDP reports, CPI, unemployment, stock market, etc.)
- lie – about your collapse to stay in power; you should NEVER reward lies with your vote
- indoctrinate – and not educate; teach proven theory-failed theory (fiction) such as Micro and Macroeconomics, that there are six genders, or one gender, put tampons in male bathrooms, etc.
- disparage the 4,000 years of proven-successful civics lessons and human rights summarized in the Bible
- offer the opposite of Leadership
- forward to success and agendas of reprehensible individuals
- offer no expert’s and therefore irresponsible Government
- subvert merit and reward incompetence and consensus right or wrong
All harmful ideologies call themselves:
- Modern
- Ethical
- Moral
- Patriotic – American, Canadian, British, etc.
Meanwhile, what we should vote for is:
- There is only one “side”, it’s ADVANCE.
- We must vote for proven Constitutions – proven Advance Policy; and not just for one or two policies, or for an individual, or be rooked by a marketing pitch – because we are gullible and want to “belong to something”. For most, its easier to follow the crowd, concensus, and “the mob”
- “The Beast” was a story tale monster taught to us to warn us about merchant-class economic powers that seek to “brand” us with their labels, values, ideals, morals, and ethics – Right, Left, WEF, NAZIs, the Medieval Church, Babylon, etc …
Media Lies
Propaganda
CBC TV replays messaging that says a Carbon Hoax is real, that Climate Crisis, Hate, and Racism are all real problems, and that Canadian politicians must take Canadians into custody and into court to defend against those who won’t adhere to their harmful ideologies. Media also completely omits reports daily on harmful immigration (open borders), Canadian men hired as a last resort only (as seen in Canada’s Bill 25), soaring suicide and divorce rates, unexpected deaths (seemingly caused by COVID vaccines), depopulation caused by unsustainable infertility, Autism caused by high testosterone females, US. State Border lockdowns and a dozen EU farmer revolts that mimic the actions of Canadian farmers.
Media is not there for the people any longer, because “the people” are no longer the ones who are paying for their salaries, as used to be the case. 7 days a week and 24 hours a day, billions of public dollars are spent annually to tell seniors and at-home children messaging that is harmful to them, to you, and to your family and nation. Seniors are the highest-percentage voting demographic and are also the most easily exploited by big-money ad campaigns like these
The EU does not have an exploitable media budget like Canada has, so its reporting of these same WEF and globalist indoctrination messages is occasionally dismissed and defended against by EU Media. In Canada, however, there is no one but the occasional court challenge to help defend voters against media lying. These court challenges are not reported to voters, as they must be
The US political landscape is entirely scripted and coordinated with other similarly themed and SuperPAC-funded parties in other nations, as seen in this heartfelt smear campaign against a political opponent’s clean-up of performance problems created by their political party while in office

Media directs populations toward collapse today, so propaganda and media manipulation must be rigorously prevented by our Constitutions. 200 countries have Constitutions based on the Bible’s updates of the Constitutions of Hammurabi and Ur-Nammu 4,000 years ago. Eve
Stand on Guard against Media lying
… because populations with poor civics training are easy prey for this favorite tactic of Oligarchy (wealthy merchants)
War mongering, fear and distraction campaigns, and unscientific, meaningless economic reporting are the norm in dozens of collapsing democracies today. Once a Right or Left Party wins power, they will hide reports of the collapse that they created to be re-elected
See Criminal Legislatures
“We will tell you whatever polls say you want to hear: All is Well! Vote for us again!” – or, “Vote for our other Oligarchy Right / Left Party instead !!”
Countries collapse when “Advance” is not mandated by every single political party on a democratic ballot. Why are groups with policies and messaging certain to collapse any nation, allowed on a ballot card in the first place?
See ACT Parties
ACTCanadian.com
![]()
Have you noticed that the media supports a political group until the tides turn against them? Only to direct voters back to another group that just collapses the country again? This has been the norm in Western nations for decades, and if you didn’t notice it before, you should take notice now – and you should Stand on Guard against Collapse
ACT Parties build scientific societies, and are always the preferred option for any nation
Mental Illness
“Mental Illness” is a new term for Social Disturbance; which switches ownership for society’s dystopic conditions onto the individual, instead of back onto the society that created the problem. Police no longer respond to social disturbances, they now make “Mental Illness” calls
When an individual can no longer pay his rent, or his family cannot find a home or basic needs of life, his outbursts are a “Mental illness” problem. See Thinktanks below for more …
Micro &
Macroeconomics
No science supports the theory-based Economics that we teach in our Universities, and much science also proves it collapses nations reliably
See also Wealth Theory
Indoctrination

Military Spending
Military spending has a negative impact on economies, yet the United States spends 53% of its Federal Tax Revenues on it
Mis-Education and Indoctrination
Education is essential, but miseducation with harmful ideologies is indoctrination
Indoctrination teaches the opposite of Values; where values are Good, Respect, and Human Advance. They teach …
- Tactical not Strategic – HR agencies, MBAs, and Accountant employers are non-expert generalists, who are also trained in unsustainable, tactical business practices that create collapse and infanticides in 64 high-income nations
- Marginalize Human Capital experience, experts, and Leaders – these can never be ignored and replaced. The hiring of false credentials in academia – over experience; nations are weakened and collapse from within due to misleadership
- Ideologies – the Bible’s “false idols”; see Ideologies
- No Joy, No Good Lives, and no Productivity – miseducation takes the essential joy out of any workplace and culture, as it collapses economies and societies
- Values – are not Ideologies, but all ideologies claim they are values, morals, and ethics
See also Collapse Motivators, Ideologies, and Education for more
Indoctrination is not scientific, true, nor real; it is harmful, expensive fiction and it isn’t Education
Citation: Notice to Academic Institutions – Educational Reform
Morality
Every generation of young people considers themselves “modern and progressive”, but in the context of history – few actually are. Every utopian ideology insists that its morals and ethics are “better and more important”
Do you not think that 1930s Germans were convinced that killing some people – by race, was important, moral, and ethical? Of course they did
Female Equality and Gay Rights campaigns – win elections while they create poverty and reliable national infanticides (equal to WWII Europe population losses) in 64 high-income nations. This “morality” gives power to reprehensible individuals who must hide their country’s collapse and crimes against humanity – and 40+ social problems, so as to continue to stay in power. These groups must bombard voters with every sort of indoctrination and irresponsible “values” messaging – and, they must block responsible political or independent media and legal groups from exposing their propaganda, in order to hold power
The Bible is a civics lesson book and an important update of our first Constitutions. It is scientific because it’s based on observation and lessons learned from 3,000 years of civic rise and fall. Its policies have proven to work very well in advancing nations across the globe today too. The Bible’s audience was illiterate and superstitious, so its 307 scholar authors used the teaching tools of a father, son, and holy spirit, to explain sustainable values, morality, and ethics:
Good (God), Respect (Jesus means “Saviour of others” in Hebrew), and Human Advance (Holy Spirit)
EVERY large nation that supports all of the Bible’s human rights is advancing today; and, ALL that do not, are collapsing
“Merry Christmas” is immoral or disrespectful? Christ means “anointing with oil”, as used by every Abrahamic Religion (Judaic, Christian. Muslim) at special life events
LGBT showcases like Pride Parades – surveys prove that a tween’s testosterone levels are physically impressionable. What value is there to a dying nation (with a 1.4 fertility rate) to promote how “cool” a homosexual lifestyle is? Respect is afforded to everyone, but homosexuality is a discussion for adults and not for biologically and emotionally impressional young children
Open Markets
Globalization, Consumerism, Sales Economies, Offshoring & Onshoring – consistently collapse nations. The solution for this unsustainable policy is Nationalism’s regulation of free markets
Correct this problem with “Strategic Trade” (WP Projects) and Nationalism
Platitudes
Free Speech, Democracy, Freedom, and Capitalism – are examples of meaningless catch phases and platitudes
Capitalism – Unregulated Capitalism created the Great Depression – and it creates today’s mature capitalism the same; while FDR used Regulated Capitalism to monetize protected productivity until it created the greatest economy in history
Free Speech – permits lies, indoctrination, and harmful ideology, so what we want to guarantee is Truthful Speech
Democracy – 90% of large democracies are collapsing while Socrates was put to death at the age of 80 by Athen’s democratic Senate. Any system of government that collapses societies, creating cost and hardship, needs correction – and not a celebration
Freedom – countries with no rules (no laws) have no property ownership, no currency, and no law and order until women are traded for a pack of cigarettes a dozen times a day
War in a Nuclear Age
Today’s failing democracies risk nuclear devastation via propaganda and global conflict rates higher today than at any other time in history
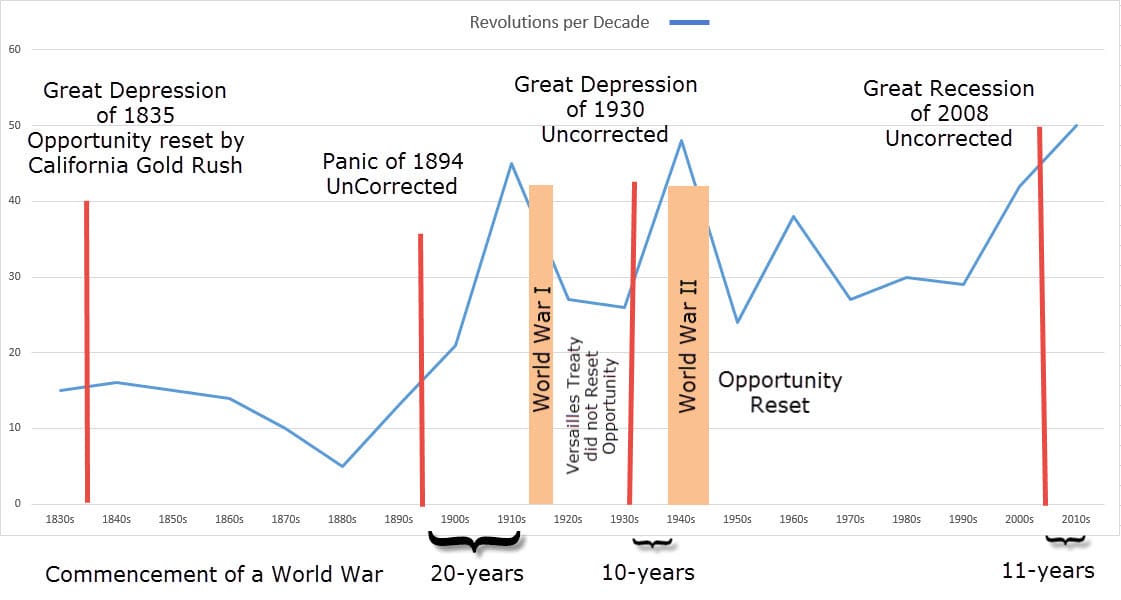


To avoid nuclear winter, Col. Richard Black is a US Senator who councils informedly and honestly about the dangerous game that a global military complex, with global media coercion at its side, plays today
- “We use unlimited force and violence while controlling global media to erase discussion of what’s truly happening.”
- “We and NATO do not care how many of our proxy Ukrainian women, children, or young men are killed.”
- “Russia’s appeals for peace were ignored until it was forced to conduct an obviously very cautious special operation against brother slavs.”
Patents & Intellectual Property
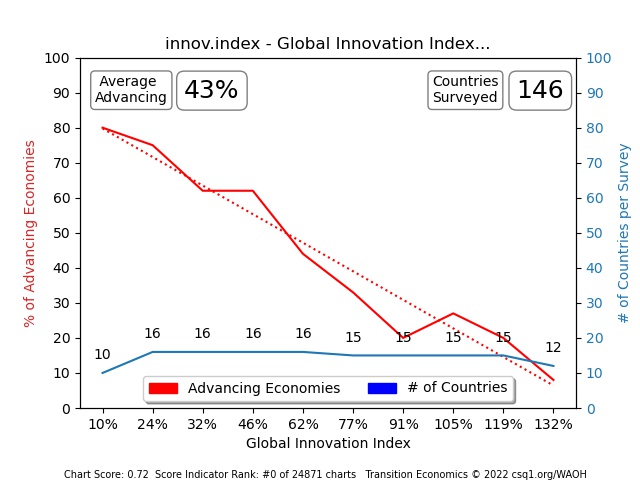
Patents, Intellectual Property Laws, or “IP” are an essential legal system and protection that permits innovators of new products to pay for their Research and Development investment costs and to establish new companies and even also new industries
Receiving payments for Intellectual Property is also important for national economic strength
Where Patents become a concern and unsustainable, is whenever large companies can use Patents to block innovation by smaller companies, inventors, and startups
- Canada is the 9th largest economy in the world but ranks 16th on the Global Innovation Index
- Nikola Tesla used Westinghouse lawyers and a warehouse fire to claim ownership of Marconi’s Radio Patent
- Tesla also Patented Turin University’s open source AC Generator for use at Niagara Falls
- Software Patents set back Voice Recognition 10-years until AI could be used as an excuse to bypass Dragon Dictate’s IP
- 80% of phones in the world today do not have Voicemail Apps because Apple holds a software patent. Ridiculous!
- China had to be able to ignore restrictive western patent laws for years, in order for them to become self-sufficient and successful
Pollution
Greenhouse Gases (methane, …), Emissions (Air) and water-born pollutants need to be managed:
- Operational SOPs in every Industry
- Special Projects
… so as to safeguard our environment
Poverty
Poverty is Poor Leadership
See also: Austerity, Leadership Decapitation, GDP per Capita, Democracy
Most truthful reports of poverty are hidden from voters. In any democracy, one will always find that as long at 51% are ok, the voice of those in desperate need can easily be suppressed and ignored
The productivity costs of pure democracy are well understood and well documented in 48 (90%) of 54 large collapsing democracies today
But “well understood” is not the same as “well reported”
Aristotle called Democracy an Evil form of government, and North American Constitutions were created by slave owners initially – so these are not Republics (not Aristotle’s “Polities” that safeguard human rights), which is why so many democracies collapse every 60-years as capitalism mature and need reset
Necessary, responsible economic resets can be almost impossible after any national population exceeds 15 million, and human rights are not protected
One of the most important measures of economic success and good health is the GDP per Capita (see this transparently at WAOH Data Science)
Right of Contract
In situations where labor has poor collective bargaining power, by a 1925 ruling of the Supreme Court of the United States, any individual could be forced by necessity into signing an employment contract that assured them both starvation wages and inhumane working conditions – in a legal and binding contract that waved away their basic human rights
In 1937, FDR gave a decidedly-neoliberalist Supreme Court the ultimatum to end “Right of Contract”, or to be retired
Small Government
Regulation ensures that Business’s natural competition to drive everything down to zero, doesn’t permit unsustainable globalism, price-fixing, consumer gouging, monopoly, and weak nonredundant supply chains
Monopoly through corporate consolidation and buyouts drives profiteering, inflation, and poor redundancy in supply chains
To prevent inflation, all industries and companies profiting from inflation must be regulated
Starvation Wages
Trickledown / Scaleup / Reaganomics
Failing to protect Living Wages and access to income is expensive for any nation
As it detriments innovation, productivity, opportunity, economies, and Social Contracts (csq1.org/SCP)
Supply and Demand
No evidence proves supply or demand changes impact economies
The First Industrial Revolution invented production and demand, and yet it created no lasting economic benefit (from 1750 to 1805). The USA has been at war for most of the last 100 years, and that demand has not prevented its collapse either
A TEP Sheet of Inventory Level reports across 186 countries confirms that high and low measures of demand and supply are meaningless, only showing benefit by SCP 2020 measures in High-Income nations (very specific conditions)
From these reports, its clear that Living Wages and Good Lives are the far more important determiner of economic advance
Surveillance States
Once the path of Dictators, today’s large collapsing and treasonous criminal legislatures are adopting Surveillance, Authoritarian ![]() , and Totalitarian
, and Totalitarian ![]() laws to control rising poverty’s unrest and rightful opposition.
laws to control rising poverty’s unrest and rightful opposition.


Violence against Women
Nations with high incidents of violence, collapse economically as well
Virtue Signaling
See Morality and Ideologies above
What’s New at WAOH?
Here is a list of our latest updates and additions. We’ve added an importance measure ![]() …
…
Treason and High Treason
Understanding and protecting against Treason and Acts of War
Surveillance States
The end of liberty, education, and prosperity; see also – pursuing Thought Crimes

Hate Laws
Hiding Election Frauds and Depopulation High Treason
Act of War
Female Hiring Quota Laws guarantee depopulation for any population, and constitute an Act of War
Net Zero
The $130 trillion Banking Cabal that is working for economic control and poverty in 45 countries

Education
The Greatest Philosopher World Tour

![]()
![]()
![]()
![]()
![]()
![]()
Law


Investment
Economy Doubling ETFs & Bonds featuring Transition Economics Civic Science
![]()
![]()
![]()
![]()
![]()
![]()

Criminal Legislatures
![]()
![]()
![]()
![]()
![]()
![]()


Corruption
Female-Vote
Credibility
Credible Measures and Context
![]()
![]()
![]()
![]()