


Jump to “How does it work?” here
A Quality Education
TASK is The Academic Civic Science Challenge (tacsc). TASK rates academic universities and institutions by National Advance
This assures that their curricula are creating experts, leaders, and successful societies
The Annual Universities TASK Report ranks universities from highest to lowest by their record of teaching quantitative highest-probability-of-success science and approach (epistemology)
TASK showcases Universities that govern all faculties with a Civic Science Program and Standard of Research (see CS-BOK). Civics faculties include Economics, Business, Finance, Law, Government, Education, and Social Science, but most engineering and natural science faculties mandate Civics electives as well

Transparency
Source statistics for all TEPs are available online so anyone can confirm or build charts for the same results. All Data here must be properly cited and summarized credibly by Edgar Alan Poe’s famous truism (with my Dad’s twist):
Believe nothing you hear, half of what you read, and everything you see

Read how TE ensures essential Human Rights, incomes, and national production and prosperity is maintained in Hybrid Economies on csq1.org/Transition-Economics
How does a Hard Science in evidence-based Civics Work?
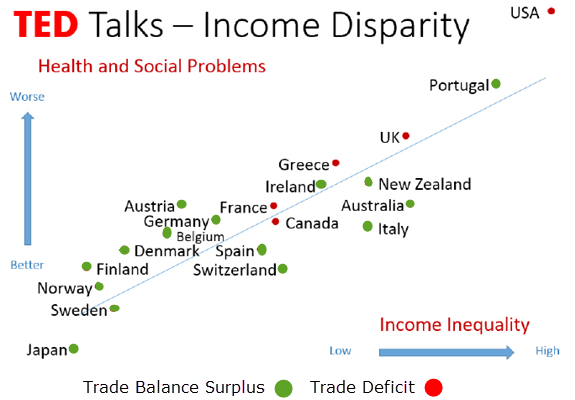
Let’s begin by looking at a report by Professor Richard Wilkinson’s Nottingham University Research Team TED Report on Financial Inequality and Social Problems in 2013. See his TED Talk here …

13 Social Problems in 20 countries are higher with inequity
Nottingham’s report is compelling because it shows conclusively that 13 social problems are caused by financial inequality in 20 surveyed countries.
One sanity check for any civic science, therefore, is that it must confirm financial inequality and social problems have a similar relationship. Both in the countries proven by the Wilkenson Report, and in every other country too.
To prove that the statement: “Financial Inequality causes (is causal to) Social Problems” is a true statement in every nation, we have to confirm it in 220 countries, in high/medium/low-income nation comparisons, in democracies/monarchies, Latin/Asian/Pacific/African Regions, and so on.
Surveys of 13 social problems in 18 countries might sound like enough evidence to convince anyone, but what other information is available to bolster this report’s claim of “Causality in ANY society”? Which other measures can confirm that financial inequality reliably creates social problems – and that correcting the problem improves economies too?
As luck would have it, there seems to also be a similar correlation to social problems when we look at “Trade Balance” – of all things. We can see in the chart below that the nations in the Nottingham survey with trade surpluses, also exhibited low social problems and lower inequality.
Trade Surplus nations (with a positive Trade Balance = Export – Import) are grouped to the left of the chart, while Trade Deficit nations are grouped to the right – as seen in Income Inequality nations
Trade Balance is higher in high Social Contract Nations
 Why are Trade Balance AND Financial Inequality valid determiners of Social Problems?
A lot is going on in an economy, and here we see that both a social measure and an economic measure appear causal to social problems (able to cause or correct them). Why? Perhaps it’s because higher financial equality in a nation permits more citizens to increase opportunities and to contribute to start-up businesses, which generates trade revenues from this increase in local production.
And, we can also learn from history. Today is a time of mature capitalism, imbalance, populism, clear misleadership, and collapse but things were not always this way. What did Financial Inequality (and Trade Balance) look like during the greatest boom economies of all time – just 70 years ago?
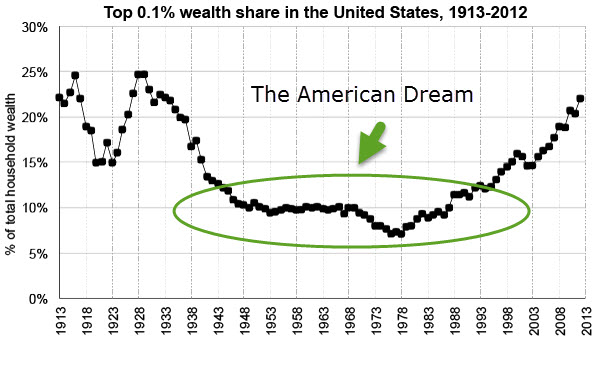
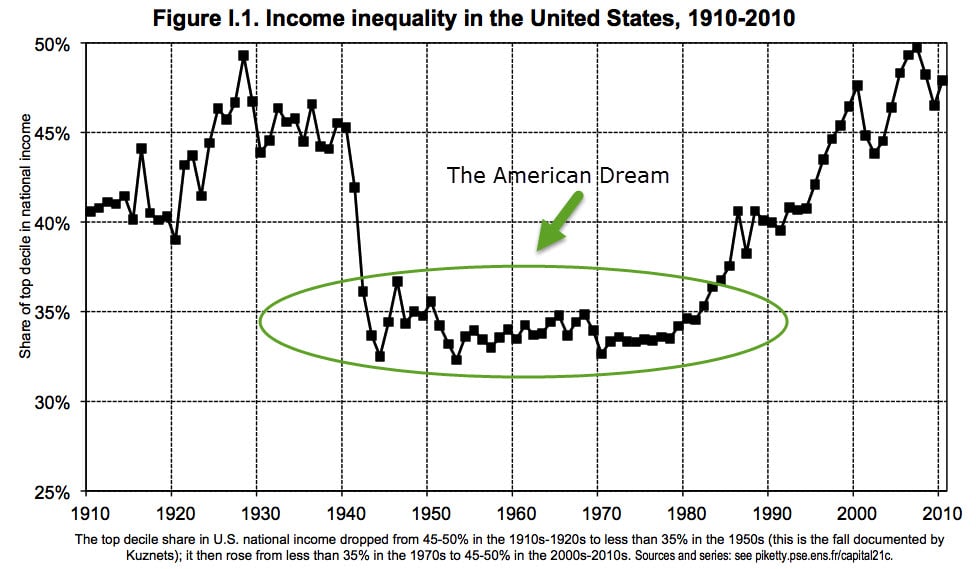


The United States, under the direction of Franklin Delano Roosevelt and then Harry Truman, created the greatest economy in history. Let’s take a closer look at that success.
We can see in the charts above, that financial inequality was much lower during the economic boom that began in the late 1930s. That economic boom can easily be said to have been caused by the correction of the inequality created during the 1920s and the Great Depression (another Mature Capitalism and period of imbalance – like today). Wealth Inequality almost doubled between 1923 to 1928 and it stayed high until 1940’s dramatic correction.
Can you also notice that Trade Balance changed as Inequality soared again in the 1980s?
What built that boom economy? Can you tell?
- Did WAR explain the boom economy of the 1950s and 60s? NO. World War I did not create a boom economy afterward; rather, it created the Great Depression. The US has been at war for the last 100 years and its production is collapsing for the last 40 years consistently
- Did GOVERNMENT SPENDING create the boom economy? NO. Government Spending is unchanged or higher as the US collapsed for 40 years
- Did FINANCIAL EQUALITY create the boom economy? YES. Based on everything we see above, this is the truthful answer
So, the chicken-and-egg question of “Does money in the hands of many citizens create a strong economy?” has an answer. Yes.
Does putting money in the hands of a few wealthy oligarchs create a strong economy – as things are today and in the 1920s (per Wealth Theory, Trickledown, and Transition Economy)? No.
This question is answered above – by evidence – and without Transition Economics.
A Context-Driven Approach
When you don’t know what to stand for, you fall for anything
Important to any presentation of statistical information – is Context. Presentations must compare you to successful nations only, they must use recent accurate data, and they must present only credible measures. A credible measure is a measure that is proven highly causal to creating an advancing economy (see “TEP Scores” below). Context in history is relevant also; Debt was forgiven for most European countries in the 1930s from 25% to 250% of their GDP  For example:
Q1: Is a 3% Salary increase good, bad, or normal? No, it’s bad. A 3% Salary increase is embarrassing in fact.
Why? Since the 1980s, individual and household salaries haven’t budged. It would take a 100% increase in Salaries today, just to come back into balance with where salary levels were in the 1970s.

Q2: Are stock market ups and downs meaningful? No.
Q3: Are GDP lifts important? No.
See Credible Measures explained in the Proofs of the World at our Hands Report
![]()
Confirming Causality with Transition Economics
After researching Trade Balance, we could move next to look for causality in “Household Savings”, or randomly to any one of the over 1,500 other indicators (measures) which every country already collects annually. But, a “guesswork method” is labour-intensive, imprecise, and often unrepeatable. In short, it’s unscientific.
Doctor Wilkenson’s survey and team couldn’t look at all countries, as he wanted to, because of the high workload mandated by their manual survey approach.
So, is there a way to confirm which indicators are the most causal measures from the 1,500 measures that we already collect annually from 220 countries? Can we confirm which already available indicators can influence the collapse and advance of any nation – like Professor Wilkenson’s “Financial Inequality” reports clearly can?
Yes. These are the questions answered, and the problems solved, by Transition Economics (TE) every day.

Finding the same conclusions using TE
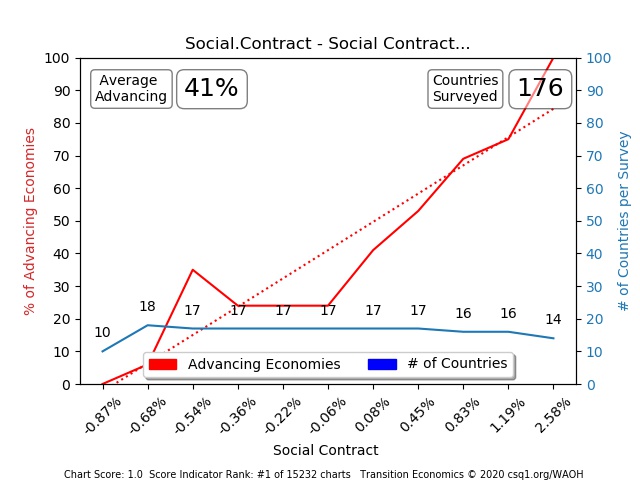
The Nottingham study above is explained by Transition Economics with the “Social Contract” report. Social Contract is an index of social indicators already collected in 180 countries at present. TE builds the frequency distribution chart (TE Proof or TEP Chart) on the right, based on their research, surveys, and data.
How does the Nottingham “Social Problems Chart” look using Transition Economics’ causal Social Contract measures?

Based on the Social Contract’s 179 country survey, the distribution of advancing and collapsing nations group together – from the chart’s left-most advancing nations to its right-most collapsing nations – identical to the distribution of Nottingham’s National Social Problem findings report. You can see from a (simple) Threshold Report below, that Canada and France’s collapse signals were a judgment call as in 2019 they were both marginally collapsing and just barely reaching the status of Advancing. Note that Nottingham’s report presented 2012 social stats.

Legend: Advance/Collapse = original assessment, Trade = Advance or Collapse based on Trade Balance, SC = Social Contract 2019, SC20 = SC 2020, SCP = Social Contract Product (Index), Value = Indicator value, Pop = Population, PRnk is the rank of the country by population size, % is Advance (shown when within 25% of just passing threshold)
– Important Learning –
ANY Causal mix of Social Indicators (indexes whose frequency distribution amplitudes equal 1.0) will show this chart very similarly. We ran the same report for the following Social Contract report as a validation (using MEMS), and I could have run a dozen similar Social Contract indexes the same.

Why build more than one Social Contract Index? Because we have statistics back to 1970 for 179 countries with the first list of three indicators above, but – we only have statistics to the year 2000 for 180 countries that reported the six indicators in the second report.
Indexes with more indicators are best, but data is not always available to support our need for historic trend and context validation. When a report shows Social Contracts have improved in nations where conditions diminished, that report is still useful for noting events, peaks, and valleys in time – but cannot be a truthful Causal report.
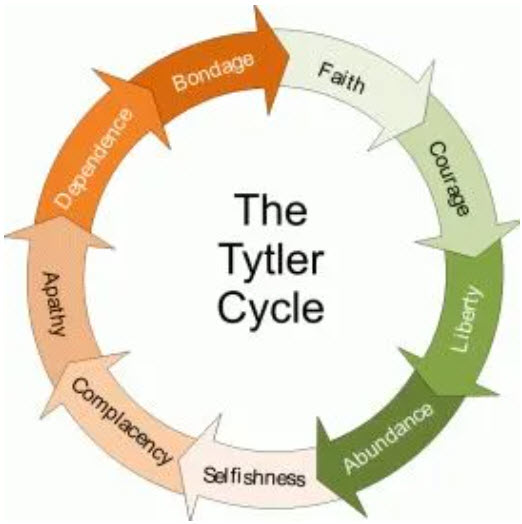 Note: Countries further along a Tytler Cycle, that have grown prosperous and lazy without responsible Civics training, are vulnerable to falling prey to an Ideology War easily. Whereas nations that have been through real wars and real adversity, recognize the importance of nationalism and human rights, and quickly reject Open Borders and Anti-family values or depopulation indoctrinations. Canada or Western Europe versus Croatia or Russia – are examples of this point.
Canada puts their citizens in homeless camps while protecting Globalist Open Borders policies, puts tampons in public men’s washrooms, and suspends its students for not calling males female; while Italy, Croatia, or Russia reject obvious indoctrination and insanely foolish sheep-like followers.
90% of (48 of 54) large democracies are collapsing in the West, while citizens battle DEI laws in the workplace and approach World War III. And still, we can’t vote for Advance – because its not on our ballot cards.
These are the devastating, easily corrected Social Problems that hinder Human Advance – that TE corrects.
Important Measures & Causality are measurable
with TEP Scores and Context Validation
We know that the Transition Economics Advance and Collapse survey results are accurate because we validated the Social Contract measure to have a TEP Score equal to 1.0, and we were also able to run through a Context Validation Process with the Wilkinson Report and the other supporting historical charts above.
Click here – to read our Science of 70% tutorial on how to recreate any TEP chart for yourself
Click here – to view the indicators that make up the Social Contract Index
Click here – to read an advanced explanation of how to read TEP Charts
Click here – to view 945 other sortable and filterable Indicator TEP Scores
Click here – to view the WAOH Library’s Data Science webpage, for many more TEP Scores, Indicators, and Indexes
Click here – to sign up for Civic Scientist training and certifications, so that you, and your teams, can become experts of Civic Science too

The Social Contract Index TEP Chart
A Causal TEP chart like Social Contract (SC), explains that countries with low scores collapse reliably – 100%, while countries with a strong score advance reliably – 100%.
 We call Social Contract “Causal”, or a “Causal Indicator” because its TEP Score is a perfect 1.0. A TEP Chart’s “Score” subtracts the highest frequency distribution (FD) Y-value (for SC it is 100%) minus the lowest Y-axis value – 0%. 1.0 – 0 = 1 .0.
TEP Scores are frequency distribution amplitudes.
A score of 1.0 indicates the highest possible causality score – as confirmed by the reporting of 176 countries (in this Social Contract report).
We can also rank TEP Charts that share a score of 1.0, by counting the total number (or %) of advancing nations in their highest value range.
Now, we have a numeric approach to finding both causality – and causal measures, like Wilkenson’s Social Problems above.
So, we no longer have to rely on Classic Economics’ hit-and-miss guesswork, logic, theory, consensus opinions, modeling, or mathematic projection.
Adding more measures and collections
Can we add measures, to those measures that are already currently collected by every nation today? Yes, of course.
Professor Wilkenson’s team struggled to collect obesity, suicide, and other stats in just 20 nations. When these stats collections are budgeted, staffed, reported country-by-country, and then consolidated for 220 countries, perhaps also by income and wealth quintile, then TE’s TEP Reports can zero in on problems and solutions very reliably.
Every problem is solvable, and the first step to solving a problem is finding out that you have one. Everything measured can usually be improved.
TE allows us to drive economies to success consistently
With a numeric approach, we can automate the computation work; we can use Machine Learning techniques to quickly find and compare every variation and combination, of indicators and indexes that yield TEP scores of 1.0 – using Social measures, Economic measures, or a combination of both. We have used this approach to discover TEP Reports that are so causal that they group 38 (of 200) Advancing countries at their highest frequency distribution range.
A Social Measure is either an individual indicator or an index of measures, that is composed of social measures entirely – like Longevity, Education, Infant Mortality, or Social Contract
Economic Measures – are indicators or indexes composed of economic measures like Trade, GDP, Government Spending, and similar.
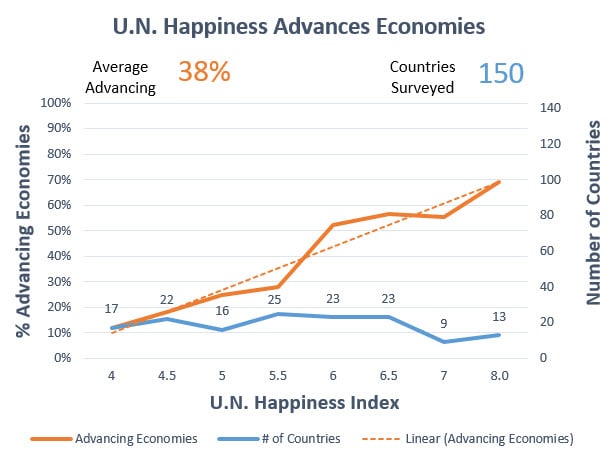
Socioeconomic Measures – are mixed measures which are a combination of the two – Social Contract Product and the United Nations’ Happiness Index – are two examples of this
Basic Principles: Economies are High Transaction Systems
Trillions of daily transactions means that “highest-probability-of-advance” policies WILL build advance reliably in any economy, and the same is also true in reverse – “highest-probability of collapse” policies will collapse economies reliably.
Advance Policies – explain FDR’s Greatest Economy in History – and …
Collapse Policies – explain the GOP’s Neoliberalism Wealth Theory policies of the 1920s, which created the Great Depression in just a handful of years
Adoption Delay
What barriers stop the adoption of a simple, transparent, scientific approach that builds strong economies reliably?
Many of us don’t realize that it took Einstein’s 1905 Theory of Relativity, 20 years to be accepted in the West.
Adoption, the normal resistance to even essential change, is the elephant in any room that will slow TE’s acceptance similarly. Human nature explains that our vaulted Professors, awarded Nobel Laureates, Experts, and Academies have all written textbooks, authored articles, lectured, and peer-reviewed one another – and all of their labour has been based on easily proven-failed theory.
A job title makes no one an expert, and the Swedish Central Bank’s Nobel Prize for Economics has awarded only unscientific theory ever since its inception in 1968. Fictions have vaulted non-experts – and therefore non-leaders, into high positions as economic leads, and these people have been asked to create important policies and programs based on their mastery of a proven failed theory (fiction). This is a serious miss, for academics and peer-review processes, that is going to require some hard introspection, explanation, and KPI-driven performance management to correct
As individuals, it’s not our fault that we didn’t learn responsible civics. Civics takes training, and in the past, we didn’t have access to data from 220 countries as we do today.
Bloodletting and lobotomies were the highest forms of pseudo-science not so many years ago, and then those practices were discounted in a never-ending cycle of new learning – and adoption.
A simple new science like TE proves that leadership, education, and approach/processes have been sub-standard and harmful; bruising egos and besmirching the reputations of high-IQ, well-intended, and previously-esteemed researchers and teachers.
In hyper-competitive mature capitalisms, there are compelling personal and professional reasons for whole faculties to reject, discount, or adopt a new science only by their explanations and terms.
TE is a big challenge for existing social faculties because it is a computer science, which means faculties presently filled with thousands of math professors, are unqualified to teach and supervise TE.
Given unlimited time, economics teachers will: learn computer science, update their skills and research, and assimilate this new science while minimizing any professional embarrassment.
The problem with allowing adoption to take a normal course today is that TE is important. Transition Economics is needed immediately – to save lives, stop wars, and correct collapse. Universities, therefore, must minimize normal adoption delays so that a scientific approach can lift today’s dangerous social and economic collapses as quickly as possible.
Civic Science is exceedingly simple:
When you Fund Advance Policies and Don’t fund Collapse Policies, you are mathematically guaranteed to build a successful economy and society
A professional engineering office would re-phrase this to say: When you professionally Change Manage and Performance Manage your country (region by region) to improve your Advance Policy measures, then your Economic Advance is Guaranteed
“Collapse” is expensive and dangerous, so the performance management of causal indicators is essential to the responsible leadership of any nation. In any democracy, therefore, you only want to vote for Political Teams that implement Advance Policy – and who are also (preferably) endorsed, certified, and monitored by CSQ Research Certification programs.
In Summary:
- By improving your Social Contract score, you WILL advance your country
- If you do nothing, things will remain collapsing or advancing at current rates; and,
- If you drop your score you will collapse ANY country – no matter how strong it is
Here at CSQ Research, this is how we teach economic researchers and Civic Scientists to Double Your Economy and to build World Peace reliably.
Civic Science’s Knowledgebase
The hunt for causal reports never stops.
The World Inequality Database (WID) has been working on an indicator for wealth inequality for years.
The Palma Index (10% highest incomes divided by 40% lowest incomes) appears promisingly causal but inconclusive with just 44 countries in their surveys to date.
We have very recently found a causal report for Adult Wealth Inequality – in Credit Suisse’s Mean Wealth per Adult ($US) Report. This means that “Wealth per Adult” can be counted among the other important measures of collapse or advance for any country. Note, however, that the “sweet spot” in some Adult Wealth TEPs shows that causality decreases (drops to 70% from 100% advance) for the 13 countries with wealth over $274.9k per adult. The report appears causal up to these wealth scores.
So, TE uses indicators that are known to be causal across almost 200 countries – like Trade Balance, Domestic Savings, and similar.

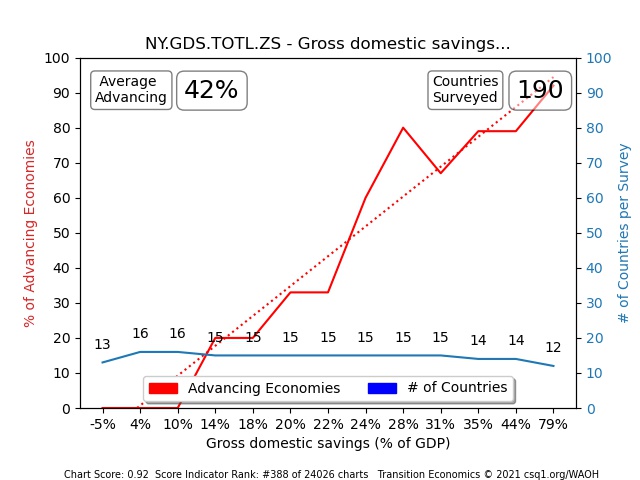


![]() Find hundreds of similar Causal, and not-so-causal, indicators and their TE proofs at the WAOH Civics Library. WAOH also curates a survey research “wishlist” for new indicators that evidence-based Civic Scientists might like to add to the existing measures that are already collected.
Find hundreds of similar Causal, and not-so-causal, indicators and their TE proofs at the WAOH Civics Library. WAOH also curates a survey research “wishlist” for new indicators that evidence-based Civic Scientists might like to add to the existing measures that are already collected.
Transition Economics Proof (TEP) Chart “scores” – are taken from frequency distribution (FD) charts created from indicator surveys from 28 to 220 nations – using a data science approach similar to Six Sigma and the Pareto Principle (the 80/20 Rule).
Why is “28 countries” the minimum permitted? Because, we want to see trendlines in the FD charts, which calls for a chart with no less than 4 data points; and, we also want each data point to compare no less than 7 countries so that we have as statistically significant a decision as can be offered by our often-small datasets. Surveys of more countries are better obviously, and data point comparisons of 10 countries or more offer more-truthful results.
TE isolates high-income countries in some reports, and mid and low-income countries in others; there are many ways to look at available data – but usually, TE surveys with more countries (120+) make better, more credible, reports.
Confirm any report here for yourself
TE is a science that makes “unsupported by data” opinions impossible. Anyone can confirm these survey results for themselves using public data and a spreadsheet.
We called our first scoring method – the Science of 70%; and the tutorial at this link explains how to create any TEP charts that you see here on the CSQ1.org website – for yourself – so that you don’t have to take our word for anything. You can also reach out to request any of our TEP chart source data at [email protected] (we take data from a hundred sources) and APIs are available to save your research teams from having to recalculate TEP chart data points and scores for yourself.
Data Science and Transition Economics
 Data Science is an exciting new field in quantitative computing. Transition Economics develops leading-edge Jupyter Notebook, Python, MatPlotLib, and Javascript Charting & modeling tools like MEMS and WAOH (The World at Our Hands Report – TE’s Econometric Proofs Library). Tools and data visualizations provide new clarity and insight into the reliable management of successful economies and societies. See a sample of some of the highest-scoring of the 15,000 TEP reports that we curate in the tables and slideshow below
 TEP Scores
With new tools, come new capabilities. Each TEP chart is a consolidation of 15,000 records and 60 years of data too. Data science tools now permit us to process 10-TEP charts for 1,500 Indicators and Indexes in under an hour; easily scoring, sorting, and ranking Sustainable and Causal Indicators, separating them from the lion’s share of meaningless indicators like GDP, Disposable Income, Unemployment, Supply & Demand, Consumption economies, and so on.
High TEP-Score indicators and indexes have a high amplitude – a large difference between minimum low and maximum high values. Alternatively, statistics whose TEP surveys have small amplitudes, have little influence on economies. TE Scores average the individual TE amplitudes of all TEP surveys – see a sheet of TEP Charts in the image to the left here 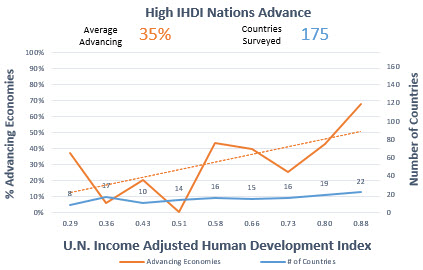
 Are you curious to know which reports are better than the United Nations HDI Report – for example? There are a dozen better indicators – and this technique can help improve future HDI Reports as well
Finding Data and Creating TE Causality Scores
An “indicator” is just a measure that has been collected similarly in many countries. Examples include Population, Longevity, Trade Balance, and 1500 other measures that are recorded and forwarded to data consolidators so that this data can be easily downloaded online by any of us who are reading this article.
Data Consolidators include the WHO, United Nations, the World Bank, OECD, Wiki lists, and hundreds of other providers and research bodies. Detail how-to questions are answered in our Science of 70% tutorial mentioned above.
In addition to automating the creation of TEP Charts, the Science of 70%‘s “thresholds” permits us to understand whether a nation is collapsing or advancing too. See a Case Study example of this National Status approach here.
The WAOH Civics Library – is an evidence-based Public Civics Library (Library Symbol – OTWA), central Knowledgebase and Standard of Research, that curates and catalogs 60,000 TEP chart survey results along with metadata, APIs, MEMS A.I. and Machine Learning tools.
![]() Score – Each TEP Chart is scored by subtracting its maximum value from its minimum value (the chart’s “amplitude”). A TEP chart’s maximum possible score is 100% minus 0% – or 1.0, but indicator TEP surveys typically score between .6 and .7.
Score – Each TEP Chart is scored by subtracting its maximum value from its minimum value (the chart’s “amplitude”). A TEP chart’s maximum possible score is 100% minus 0% – or 1.0, but indicator TEP surveys typically score between .6 and .7.
Rank – is the importance of the report (by score) compared to all other TEP Reports
Click here to learn how to read TEP Charts
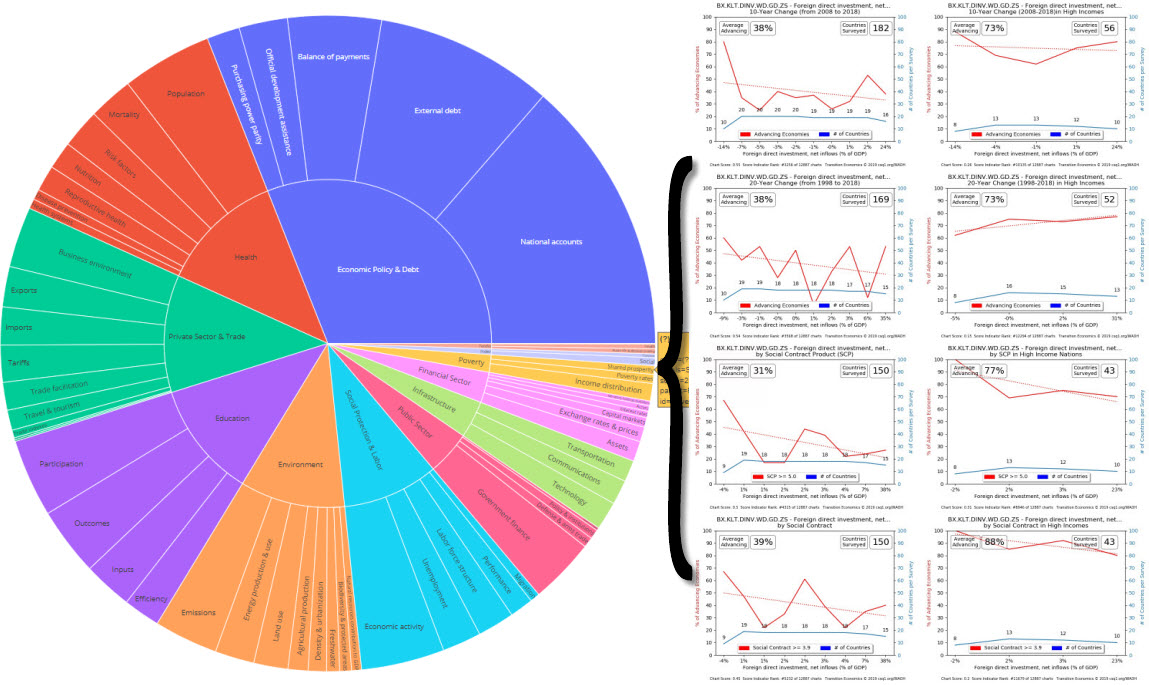
 TEP “Sheets” – present many TEP Reports for a single indicator onto one sheet. Click on the image to the right here …
TEP Report Types – can include TEP (Trade Balance), Social Contract (SC), Social Contract Product (SCP), High-Income (HI) nations, Change over x years, Gini, Per Population, and so on.
TEP Sheet Scores – average all TEP scores on a TEP Sheet together, for one indicator.
Indexes – Indexes combine several indicators until an optimal causality is reached. The most causal reports are Indexes.
Data Quality, History, and Consistency
Consistency – Smaller countries can only afford to collect a smaller number of indicator measures, and not all measures are collected annually, some are collected intermittently (once every 3 to 5 years), and other measures are one-time collections without history.
History – Some data is recorded for a century in some cases – and even 200 years in the example of the USA’s GDP reports, while others started reporting in the 1960s, and more still began in the 1990s. PPP was used for the first time in 1990, so there won’t be PPP stats earlier than this.
Data Quality – Much time and effort is taken to gather and forward measures reliably. Embarrassing stats such as suicide, homelessness, wealth inequality, and infant mortality rates can be under-reported in many countries. The hiding of stats by embarrassed countries tends to be consistent and ubiquitous. If one nation is hiding or misreporting a statistic, there is a higher probability that all nations are hiding their true values for that indicator as well.
Curated Data and MEMS Dashboards
The number of TE Proof Reports and Report Types is always growing. Today, a typical “TEP Sheet” displays 20 TEP Report Types with TE XY Scatter Charts – and then MEMS AI (TE’s interactive AI Dashboard) also presents many additional interactive versions of each TEP Report – with an API service.
 WAOH and MEMS are presently the only online source of Transition Economics data.
See Data Science at WAOH
By recording, sorting, and ranking the scores taken from tens of thousands of TEP Charts and TEP Sheets, we can confirm every indicator’s importance and probability of contributing to building a successful economy and society.
Indicators can also be aggregated so that multiple indicators can combine to create an index (see how indexes are built below). Index values can then be charted, scored, and ranked; and trending reports can explain changes in the index over time as far back as we have data.
The following table shows 1500+ indicators (and indexes) ranked by TEP Scores for Social Contract, 10-year Change, Trade Balance, Population, High-Income Nations, and combinations of these measures too, summarizing the scores collected from all frequency distribution reports.
These web-based tables permit us to resort them by column easily, and this analyzes important indicators and combinations straightforwardly for anyone.
| Indicator | TEP | TEP HIs | SCP | Soc Contract | GINI | Per Cap | SCP 2020 | SC 2020 | TEP-SCP | TEP-SCP HIs | TEP-SC | TEP-SC HIs | TEP-CAP | TEP-CAP HIs | TEP CAP SC | TEP CAP SC HIs | Mean All |
|---|---|---|---|---|---|---|---|---|---|---|---|---|---|---|---|---|---|
| % Agro Land | 0.44 | 0.22 | 0.41 | 0.45 | 0.25 | 0.6 | 0.4 | 0.52 | 0.425 | 0.225 | 0.445 | 0.155 | 0.52 | 0.29 | 0.496666667 | 0.223333333 | 0.466 |
| % Arable Land | 0.43 | 0.51 | 0.57 | 0.47 | 0.37 | 0.42 | 0.46 | 0.51 | 0.5 | 0.395 | 0.45 | 0.29 | 0.425 | 0.425 | 0.44 | 0.306666667 | 0.496 |
| Abortion Rates | 0.39 | 0.44 | 0.45 | 0.42 | 0.52 | 0.19 | 0.42 | 0.59 | 0.42 | 0.28 | 0.405 | 0.23 | 0.29 | 0.28 | 0.333333333 | 0.193333333 | 0.42 |
| Access Electricity Rural | 0.4 | 0 | 0.52 | 0.64 | 0.31 | 0.47 | 0.5 | 0.48 | 0.46 | 0 | 0.52 | 0 | 0.435 | 0.21 | 0.503333333 | 0.14 | 0.576 |
| Access Electricity Urban | 0.46 | 0 | 0.51 | 0.65 | 0.32 | 0.49 | 0.51 | 0.42 | 0.485 | 0 | 0.555 | 0 | 0.475 | 0.21 | 0.533333333 | 0.14 | 0.606 |
| Account Balance % | 0.77 | 0.5 | 0.69 | 0.67 | 0.5 | 0.71 | 0.5 | 0.62 | 0.73 | 0.4 | 0.72 | 0.375 | 0.74 | 0.5 | 0.716666667 | 0.416666667 | 0.582 |
| Account Balance US$ | 0.94 | 0.62 | 0.85 | 0.85 | 0.34 | 0.84 | 0.92 | 0.69 | 0.895 | 0.48 | 0.895 | 0.435 | 0.89 | 0.62 | 0.876666667 | 0.496666667 | 0.876 |
| Adjusted Savings US$ | 0.67 | 0.29 | 0.75 | 0.87 | 0.34 | 0.94 | 0.83 | 0.67 | 0.71 | 0.335 | 0.77 | 0.27 | 0.805 | 0.37 | 0.826666667 | 0.33 | 0.726 |
| Adv Edu Labor % | 0.52 | 0.38 | 0.39 | 0.38 | 0.28 | 0.52 | 0.5 | 0.47 | 0.455 | 0.4 | 0.45 | 0.34 | 0.52 | 0.38 | 0.473333333 | 0.353333333 | 0.464 |
| Adv Edu. Labor Force | 0.41 | 0.33 | 0.36 | 0.48 | 0.21 | 0.49 | 0.5 | 0.53 | 0.385 | 0.29 | 0.445 | 0.365 | 0.45 | 0.355 | 0.46 | 0.37 | 0.432 |
| Ag Machinery | 0.79 | 0.26 | 0.92 | 0.92 | 0.44 | 0.61 | 0.92 | 0.75 | 0.855 | 0.3 | 0.855 | 0.255 | 0.7 | 0.34 | 0.773333333 | 0.31 | 0.716 |
| Age 65 + Male | 0.94 | 0.43 | 0.92 | 0.93 | 0.53 | 0.41 | 1 | 1 | 0.93 | 0.445 | 0.935 | 0.34 | 0.675 | 0.42 | 0.76 | 0.363333333 | 0.772 |
| Aged >80 Male as %Pop | 0.54 | 0.31 | 0.85 | 0.92 | 0.5 | 0.51 | 1 | 0.79 | 0.695 | 0.365 | 0.73 | 0.19 | 0.525 | 0.32 | 0.656666667 | 0.236666667 | 0.668 |
| Agri Forest Fish | 0.37 | 0.21 | 0.49 | 0.5 | 0.19 | 0.39 | 0.28 | 0.7 | 0.43 | 0.255 | 0.435 | 0.23 | 0.38 | 0.255 | 0.42 | 0.253333333 | 0.476 |
| Agri For-Fish Growth | 0.53 | 0.28 | 0.49 | 0.49 | 0.17 | 0.28 | 0.34 | 0.54 | 0.51 | 0.215 | 0.51 | 0.29 | 0.405 | 0.245 | 0.433333333 | 0.263333333 | 0.46 |
| Agri Irrigated | 0.5 | 0.13 | 0.71 | 0.64 | 0.4 | 0.44 | 0.62 | 0.42 | 0.605 | 0.125 | 0.57 | 0.19 | 0.47 | 0.17 | 0.526666667 | 0.196666667 | 0.505 |
| Agricultural Methane | 0.22 | 0.33 | 0.38 | 0.33 | 0.35 | 0.34 | 0.4 | 0.48 | 0.3 | 0.28 | 0.275 | 0.25 | 0.28 | 0.34 | 0.296666667 | 0.283333333 | 0.358 |
| Agricultural Methane | 0.49 | 0.11 | 0.47 | 0.57 | 0.28 | 0.45 | 0.51 | 0.73 | 0.48 | 0.125 | 0.53 | 0.17 | 0.47 | 0.235 | 0.503333333 | 0.233333333 | 0.526 |
| Agriculture % | 0.88 | 0.39 | 0.82 | 0.9 | 0.44 | 0.61 | 1 | 0.9 | 0.85 | 0.405 | 0.89 | 0.345 | 0.745 | 0.435 | 0.796666667 | 0.39 | 0.79 |
| Agro Land (km2) | 0.47 | 0.47 | 0.21 | 0.4 | 0.35 | 0.57 | 0.22 | 0.61 | 0.34 | 0.325 | 0.435 | 0.36 | 0.52 | 0.45 | 0.48 | 0.383333333 | 0.436 |
| Agro Machines | 0.69 | 0.3 | 0.8 | 0.83 | 0.67 | 0.62 | 0.83 | 0.57 | 0.745 | 0.225 | 0.76 | 0.235 | 0.655 | 0.46 | 0.713333333 | 0.363333333 | 0.598 |
| Aid DAC to Hungary | 0.29 | 0 | 0.31 | 0.52 | 0.3 | 0.26 | 0.33 | 0.09 | 0.3 | 0 | 0.405 | 0 | 0.275 | 0 | 0.356666667 | 0 | 0.37 |
| Aid Flows donors | 0.5 | 0.48 | 0.5 | 0.42 | 0.33 | 0.48 | 0.29 | 0.33 | 0.5 | 0.24 | 0.46 | 0.24 | 0.49 | 0.39 | 0.466666667 | 0.26 | 0.454 |
| Air Freight | 0.74 | 0.46 | 0.69 | 0.77 | 0.4 | 0.8 | 0.91 | 0.64 | 0.715 | 0.345 | 0.755 | 0.355 | 0.77 | 0.335 | 0.77 | 0.306666667 | 0.702 |
| Air Infrastructure | 0.59 | 0.4 | 0.67 | 0.74 | 0.44 | 0.88 | 0.77 | 0.6 | 0.63 | 0.305 | 0.665 | 0.325 | 0.735 | 0.325 | 0.736666667 | 0.3 | 0.644 |
| Air Pollution | 0.53 | 0.28 | 0.8 | 0.93 | 0.4 | 0.33 | 0.94 | 1 | 0.665 | 0.295 | 0.73 | 0.225 | 0.43 | 0.35 | 0.596666667 | 0.29 | 0.753333333 |
| Air Pollution %pop | 0.37 | 0.29 | 0.62 | 0.75 | 0.24 | 0.47 | 0.84 | 0.83 | 0.495 | 0.235 | 0.56 | 0.23 | 0.42 | 0.32 | 0.53 | 0.27 | 0.58 |
| Air Traffic | 0.58 | 0.13 | 0.67 | 0.67 | 0.44 | 0.62 | 0.71 | 0.54 | 0.625 | 0.155 | 0.625 | 0.19 | 0.6 | 0.17 | 0.623333333 | 0.196666667 | 0.618 |
| Alcohol (litres/yr) | 0.55 | 0.33 | 0.74 | 0.61 | 0.62 | 0.29 | 0.69 | 0.53 | 0.645 | 0.28 | 0.58 | 0.315 | 0.42 | 0.29 | 0.483333333 | 0.293333333 | 0.633333333 |
| Alcohol per Cap | 0.55 | 0.27 | 0.74 | 0.61 | 0.54 | 0.29 | 0.65 | 0.56 | 0.645 | 0.25 | 0.58 | 0.285 | 0.42 | 0.225 | 0.483333333 | 0.25 | 0.633333333 |
| Alt Convert Factor | 0.57 | 0.35 | 0.66 | 0.8 | 0.46 | 0.58 | 0.73 | 0.74 | 0.615 | 0.285 | 0.685 | 0.26 | 0.575 | 0.435 | 0.65 | 0.346666667 | 0.628 |
| Anemia <5 | 0.81 | 0.3 | 0.9 | 1 | 0.7 | 0.46 | 1 | 0.9 | 0.855 | 0.4 | 0.905 | 0.315 | 0.635 | 0.4 | 0.756666667 | 0.376666667 | 0.806 |
| Anemia in Pregancy | 0.47 | 0.45 | 0.78 | 0.78 | 0.55 | 0.39 | 0.66 | 0.7 | 0.625 | 0.41 | 0.625 | 0.36 | 0.43 | 0.435 | 0.546666667 | 0.38 | 0.71 |
| Anemia Non-preg | 0.66 | 0.42 | 0.76 | 0.74 | 0.53 | 0.39 | 0.75 | 0.82 | 0.71 | 0.4 | 0.7 | 0.39 | 0.525 | 0.42 | 0.596666667 | 0.4 | 0.726 |
| Anemia Women 15-49 | 0.61 | 0.42 | 0.76 | 0.74 | 0.53 | 0.39 | 0.73 | 0.78 | 0.685 | 0.4 | 0.675 | 0.39 | 0.5 | 0.42 | 0.58 | 0.4 | 0.73 |
| Annualized | 0.33 | 0.5 | 0.19 | 0.61 | 0.41 | 0.51 | 0.55 | 0.45 | 0.26 | 0.46 | 0.47 | 0.375 | 0.42 | 0.34 | 0.483333333 | 0.31 | 0.376666667 |
| Annualized | 0.37 | 0.39 | 0.39 | 0.65 | 0.34 | 0.62 | 0.46 | 0.38 | 0.38 | 0.3 | 0.51 | 0.28 | 0.495 | 0.39 | 0.546666667 | 0.316666667 | 0.47 |
| Aquaculture | 0.45 | 0.47 | 0.44 | 0.51 | 0.32 | 0.42 | 0.67 | 0.38 | 0.445 | 0.385 | 0.48 | 0.36 | 0.435 | 0.445 | 0.46 | 0.38 | 0.44 |
| Arab imports | 0.47 | 0.54 | 0.88 | 0.6 | 0.65 | 0.46 | 0.59 | 0.39 | 0.675 | 0.46 | 0.535 | 0.395 | 0.465 | 0.52 | 0.51 | 0.43 | 0.586 |
| Arable Land (hec) | 0.4 | 0.67 | 0.28 | 0.37 | 0.26 | 0.42 | 0.28 | 0.74 | 0.34 | 0.44 | 0.385 | 0.42 | 0.41 | 0.525 | 0.396666667 | 0.406666667 | 0.432 |
| Arable Land (hec/cap) | 0.42 | 0.38 | 0.38 | 0.61 | 0.28 | 0.43 | 0.26 | 0.74 | 0.4 | 0.35 | 0.515 | 0.34 | 0.425 | 0.35 | 0.486666667 | 0.333333333 | 0.494 |
| Arms Exports | 0.34 | 0.29 | 0.75 | 0.74 | 0.46 | 0.46 | 0.74 | 0.63 | 0.545 | 0.27 | 0.54 | 0.235 | 0.4 | 0.265 | 0.513333333 | 0.236666667 | 0.486 |
| Arms Import | 0.6 | 0.41 | 0.62 | 0.71 | 0.36 | 0.46 | 0.64 | 0.45 | 0.61 | 0.3 | 0.655 | 0.24 | 0.53 | 0.325 | 0.59 | 0.24 | 0.632 |
| ATMs | 0.69 | 0.13 | 0.77 | 0.77 | 0.35 | 0.59 | 0.85 | 0.62 | 0.73 | 0.255 | 0.73 | 0.165 | 0.64 | 0.215 | 0.683333333 | 0.21 | 0.71 |
| Bachelors Female | 0.86 | 0.1 | 0.75 | 0.82 | 0.5 | 0.48 | 0.78 | 0.69 | 0.805 | 0.255 | 0.84 | 0.13 | 0.67 | 0.26 | 0.72 | 0.226666667 | 0.81 |
| Bad Loans | 0.64 | 0.21 | 0.76 | 0.83 | 0.36 | 0.56 | 0.94 | 0.82 | 0.7 | 0.265 | 0.735 | 0.215 | 0.6 | 0.32 | 0.676666667 | 0.286666667 | 0.6825 |
| Bal Budgets %GDP | 0.6 | 0.42 | 0.47 | 0.68 | 0.29 | 0.42 | 0.49 | 0.52 | 0.535 | 0.305 | 0.64 | 0.31 | 0.51 | 0.4 | 0.566666667 | 0.333333333 | 0.583333333 |
| Bank Branches | 0.55 | 0.3 | 0.5 | 0.67 | 0.26 | 0.61 | 0.54 | 0.54 | 0.525 | 0.3 | 0.61 | 0.265 | 0.58 | 0.4 | 0.61 | 0.343333333 | 0.62 |
| Bank Capital:Asset Ratio | 0.5 | 0.23 | 0.3 | 0.42 | 0.38 | 0.51 | 0.55 | 0.55 | 0.4 | 0.205 | 0.46 | 0.215 | 0.505 | 0.385 | 0.476666667 | 0.323333333 | 0.3925 |
| Bank Reserves | 0.5 | 0.07 | 0.6 | 0.71 | 0.21 | 0.22 | 0.58 | 0.72 | 0.55 | 0.035 | 0.605 | 0.035 | 0.36 | 0.07 | 0.476666667 | 0.046666667 | 0.5625 |
| Barter Index | 0.73 | 0.33 | 0.55 | 0.43 | 0.5 | 0.31 | 0.59 | 0.35 | 0.64 | 0.325 | 0.58 | 0.21 | 0.52 | 0.415 | 0.49 | 0.306666667 | 0.508 |
| Battered Women | 0.45 | 0 | 0.33 | 0.33 | 0.19 | 0.17 | 0.15 | 0.09 | 0.39 | 0 | 0.39 | 0 | 0.31 | 0 | 0.316666667 | 0 | 0.37 |
| Beatings | 0.33 | 0 | 0.38 | 0.25 | 0.17 | 0.3 | 0.14 | 0.08 | 0.355 | 0 | 0.29 | 0 | 0.315 | 0 | 0.293333333 | 0 | 0.32 |
| Big Mac Index | 0.5 | 0 | 0.29 | 0.64 | 0.35 | 0.42 | 0.63 | 0.8 | 0.395 | 0 | 0.57 | 0 | 0.46 | 0 | 0.52 | 0 | 0.3875 |
| Billionaires Per Nation | 0.28 | 0.5 | 0.53 | 0.39 | 0.69 | 0.57 | 0.62 | 0.44 | 0.405 | 0.31 | 0.335 | 0.305 | 0.425 | 0.325 | 0.413333333 | 0.253333333 | 0.394 |
| Birth rate, crude | 0.69 | 0.38 | 0.81 | 0.94 | 0.47 | 0.5 | 0.76 | 0.6 | 0.75 | 0.31 | 0.815 | 0.315 | 0.595 | 0.4 | 0.71 | 0.35 | 0.71 |
| Births Lost | 0.52 | 0.59 | 0.34 | 0.42 | 0.38 | 0.56 | 0.5 | 0.16 | 0.43 | 0.46 | 0.47 | 0.405 | 0.54 | 0.595 | 0.5 | 0.47 | 0.398 |
| Borrowers | 0.47 | 0 | 0.5 | 0.7 | 0.23 | 0.47 | 0.7 | 0.36 | 0.485 | 0 | 0.585 | 0 | 0.47 | 0 | 0.546666667 | 0 | 0.5225 |
| Bribery | 0.36 | 0 | 0.26 | 0.56 | 0.33 | 0.37 | 0.54 | 0.4 | 0.31 | 0 | 0.46 | 0 | 0.365 | 0 | 0.43 | 0 | 0.37 |
| Broad Money | 0.57 | 0.4 | 0.69 | 0.77 | 0.4 | 0.57 | 0.69 | 0.53 | 0.63 | 0.2 | 0.67 | 0.2 | 0.57 | 0.45 | 0.636666667 | 0.3 | 0.618 |
| Broad Money Growth | 0.62 | 0.62 | 0.5 | 0.41 | 0.33 | 0.58 | 0.44 | 0.5 | 0.56 | 0.31 | 0.515 | 0.31 | 0.6 | 0.38 | 0.536666667 | 0.253333333 | 0.42 |
| Broad Money LCU | 0.53 | 0.13 | 0.38 | 0.38 | 0.3 | 0.43 | 0.5 | 0.32 | 0.455 | 0.065 | 0.455 | 0.065 | 0.48 | 0.21 | 0.446666667 | 0.14 | 0.396 |
| Broad Money Ratio | 0.36 | 0.5 | 0.33 | 0.45 | 0.27 | 0.24 | 0.47 | 0.36 | 0.345 | 0.25 | 0.405 | 0.25 | 0.3 | 0.34 | 0.35 | 0.226666667 | 0.408 |
| Budget Deficits | 0.85 | 0.45 | 0.67 | 0.53 | 0.61 | 0.77 | 0.5 | 0.5 | 0.76 | 0.475 | 0.69 | 0.35 | 0.81 | 0.425 | 0.716666667 | 0.366666667 | 0.683333333 |
| Bus Start days | 0.37 | 0.46 | 0.58 | 0.6 | 0.32 | 0.41 | 0.53 | 0.51 | 0.475 | 0.515 | 0.485 | 0.375 | 0.39 | 0.44 | 0.46 | 0.39 | 0.455 |
| Bus Start Male Days | 0.46 | 0.57 | 0.54 | 0.61 | 0.33 | 0.41 | 0.57 | 0.55 | 0.5 | 0.57 | 0.535 | 0.43 | 0.435 | 0.495 | 0.493333333 | 0.426666667 | 0.47 |
| Bus. Start Fem. Days | 0.47 | 0.53 | 0.58 | 0.6 | 0.33 | 0.41 | 0.52 | 0.51 | 0.525 | 0.555 | 0.535 | 0.43 | 0.44 | 0.475 | 0.493333333 | 0.426666667 | 0.48 |
| Business Disclosure Index | 0.41 | 0.27 | 0.36 | 0.36 | 0.31 | 0.39 | 0.55 | 0.3 | 0.385 | 0.235 | 0.385 | 0.225 | 0.4 | 0.285 | 0.386666667 | 0.25 | 0.3575 |
| Cap Formation | 0.36 | 0.13 | 0.55 | 0.42 | 0.34 | 0.32 | 0.56 | 0.46 | 0.455 | 0.145 | 0.39 | 0.19 | 0.34 | 0.165 | 0.366666667 | 0.193333333 | 0.476 |
| Cap Formation | 0.36 | 0.3 | 0.6 | 0.59 | 0.28 | 0.37 | 0.57 | 0.53 | 0.48 | 0.3 | 0.475 | 0.275 | 0.365 | 0.29 | 0.44 | 0.276666667 | 0.504 |
| Cap Formation | 0.41 | 0.14 | 0.49 | 0.49 | 0.34 | 0.36 | 0.5 | 0.46 | 0.45 | 0.14 | 0.45 | 0.195 | 0.385 | 0.175 | 0.42 | 0.2 | 0.422 |
| Cap Formation | 0.49 | 0.37 | 0.53 | 0.52 | 0.47 | 0.41 | 0.54 | 0.65 | 0.51 | 0.29 | 0.505 | 0.245 | 0.45 | 0.26 | 0.473333333 | 0.213333333 | 0.554 |
| Cap Formation | 0.49 | 0.08 | 0.4 | 0.49 | 0.38 | 0.41 | 0.46 | 0.36 | 0.445 | 0.24 | 0.49 | 0.23 | 0.45 | 0.215 | 0.463333333 | 0.27 | 0.466 |
| Cap Formation | 0.58 | 0.46 | 0.45 | 0.59 | 0.23 | 0.31 | 0.56 | 0.53 | 0.515 | 0.295 | 0.585 | 0.355 | 0.445 | 0.38 | 0.493333333 | 0.336666667 | 0.512 |
| Cap Formation | 0.76 | 0.62 | 0.8 | 0.87 | 0.3 | 0.86 | 0.85 | 0.62 | 0.78 | 0.48 | 0.815 | 0.5 | 0.81 | 0.425 | 0.83 | 0.41 | 0.754 |
| Cap Formation | 0.76 | 0.5 | 0.73 | 0.87 | 0.3 | 0.88 | 0.85 | 0.62 | 0.745 | 0.39 | 0.815 | 0.44 | 0.82 | 0.4 | 0.836666667 | 0.393333333 | 0.756 |
| Cap Formation | 0.87 | 0.4 | 0.86 | 0.83 | 0.34 | 0.92 | 0.83 | 0.57 | 0.865 | 0.34 | 0.85 | 0.39 | 0.895 | 0.41 | 0.873333333 | 0.4 | 0.75 |
| Cap Formation | 0.88 | 0.38 | 0.86 | 0.83 | 0.34 | 0.83 | 0.87 | 0.67 | 0.87 | 0.33 | 0.855 | 0.38 | 0.855 | 0.34 | 0.846666667 | 0.353333333 | 0.736 |
| Capital | 0.59 | 0.29 | 0.67 | 0.48 | 0.44 | 0.4 | 0.63 | 0.63 | 0.63 | 0.355 | 0.535 | 0.23 | 0.495 | 0.26 | 0.49 | 0.23 | 0.482 |
| Capital Formation $ | 0.55 | 0.42 | 0.55 | 0.53 | 0.32 | 0.35 | 0.56 | 0.47 | 0.55 | 0.36 | 0.54 | 0.335 | 0.45 | 0.35 | 0.476666667 | 0.316666667 | 0.484 |
| Capital Formation % | 0.38 | 0.22 | 0.56 | 0.49 | 0.21 | 0.41 | 0.37 | 0.5 | 0.47 | 0.31 | 0.435 | 0.235 | 0.395 | 0.335 | 0.426666667 | 0.306666667 | 0.482 |
| Capture Fisheries | 0.33 | 0.24 | 0.47 | 0.41 | 0.44 | 0.37 | 0.5 | 0.41 | 0.4 | 0.25 | 0.37 | 0.235 | 0.35 | 0.39 | 0.37 | 0.336666667 | 0.482 |
| Cause Death non-comncble | 0.57 | 0.36 | 0.8 | 0.85 | 0.6 | 0.55 | 0.88 | 0.75 | 0.685 | 0.39 | 0.71 | 0.215 | 0.56 | 0.37 | 0.656666667 | 0.27 | 0.74 |
| Cause of Death disease | 0.6 | 0.24 | 0.81 | 0.9 | 0.6 | 0.36 | 0.76 | 0.65 | 0.705 | 0.28 | 0.75 | 0.245 | 0.48 | 0.33 | 0.62 | 0.303333333 | 0.77 |
| Cause of Death Registry | 0.4 | 0.12 | 0.49 | 0.46 | 0.36 | 0.37 | 0.56 | 0.41 | 0.445 | 0.3 | 0.43 | 0.14 | 0.385 | 0.25 | 0.41 | 0.22 | 0.462 |
| Cell subscriptions | 0.8 | 0.54 | 0.62 | 0.59 | 0.41 | 0.47 | 0.69 | 0.5 | 0.71 | 0.41 | 0.695 | 0.42 | 0.635 | 0.445 | 0.62 | 0.396666667 | 0.652 |
| Cell Subsribers | 0.37 | 0.62 | 0.35 | 0.38 | 0.34 | 0.69 | 0.43 | 0.25 | 0.36 | 0.425 | 0.375 | 0.425 | 0.53 | 0.6 | 0.48 | 0.476666667 | 0.334 |
| Cereal Land | 0.41 | 0.35 | 0.21 | 0.25 | 0.31 | 0.41 | 0.27 | 0.64 | 0.31 | 0.29 | 0.33 | 0.265 | 0.41 | 0.295 | 0.356666667 | 0.256666667 | 0.384 |
| Cereal tons | 0.35 | 0.35 | 0.35 | 0.29 | 0.38 | 0.52 | 0.31 | 0.38 | 0.35 | 0.25 | 0.32 | 0.3 | 0.435 | 0.35 | 0.386666667 | 0.316666667 | 0.37 |
| Cereal Yield | 0.81 | 0.29 | 0.73 | 0.92 | 0.41 | 0.51 | 0.92 | 0.85 | 0.77 | 0.265 | 0.865 | 0.31 | 0.66 | 0.29 | 0.746666667 | 0.303333333 | 0.648 |
| Changes | 0.46 | 0 | 0.26 | 0.4 | 0.33 | 0.31 | 0.26 | 0.24 | 0.36 | 0 | 0.43 | 0 | 0.385 | 0 | 0.39 | 0 | 0.378 |
| Changes | 0.58 | 0.24 | 0.61 | 0.61 | 0.44 | 0.73 | 0.63 | 0.6 | 0.595 | 0.225 | 0.595 | 0.31 | 0.655 | 0.265 | 0.64 | 0.303333333 | 0.614 |
| Child | 0.27 | 0 | 0.18 | 0.16 | 0.38 | 0.5 | 0.25 | 0.09 | 0.225 | 0 | 0.215 | 0 | 0.385 | 0 | 0.31 | 0 | 0.203333333 |
| Child Empl Manuf | 0.36 | 0 | 0.14 | 0.14 | 0.38 | 0.33 | 0.18 | 0.08 | 0.25 | 0 | 0.25 | 0 | 0.345 | 0 | 0.276666667 | 0 | 0.213333333 |
| Child w. 1 Parent | 0.41 | 0.4 | 0.41 | 0.16 | 0.53 | 0.36 | 0.15 | 0.41 | 0.41 | 0.33 | 0.285 | 0.285 | 0.385 | 0.335 | 0.31 | 0.28 | 0.355 |
| Child w. 2 Parents | 0.44 | 0.52 | 0.5 | 0.27 | 0.5 | 0.41 | 0.25 | 0.32 | 0.47 | 0.475 | 0.355 | 0.385 | 0.425 | 0.455 | 0.373333333 | 0.386666667 | 0.4275 |
| Children | 0.46 | 0 | 0.36 | 0.56 | 0.3 | 0.36 | 0.42 | 0.08 | 0.41 | 0 | 0.51 | 0 | 0.41 | 0 | 0.46 | 0 | 0.42 |
| Christianity | 0.41 | 0.36 | 0.4 | 0.36 | 0.34 | 0.37 | 0.43 | 0.44 | 0.405 | 0.305 | 0.385 | 0.33 | 0.39 | 0.295 | 0.38 | 0.296666667 | 0.39 |
| Claims Govt | 0.52 | 0.21 | 0.5 | 0.61 | 0.5 | 0.37 | 0.62 | 0.33 | 0.51 | 0.105 | 0.565 | 0.105 | 0.445 | 0.25 | 0.5 | 0.166666667 | 0.474 |
| Claims Other | 0.25 | 0.21 | 0.26 | 0.46 | 0.15 | 0.3 | 0.38 | 0.25 | 0.255 | 0.105 | 0.355 | 0.105 | 0.275 | 0.235 | 0.336666667 | 0.156666667 | 0.34 |
| Claims Priv. Sector | 0.28 | 0.19 | 0.3 | 0.45 | 0.36 | 0.36 | 0.26 | 0.24 | 0.29 | 0.095 | 0.365 | 0.095 | 0.32 | 0.295 | 0.363333333 | 0.196666667 | 0.346 |
| Clean Fuel Tech | 0.83 | 0.62 | 0.7 | 0.79 | 0.41 | 0.49 | 0.93 | 0.77 | 0.765 | 0.475 | 0.81 | 0.315 | 0.66 | 0.5 | 0.703333333 | 0.336666667 | 0.77 |
| Clothing Manuftg | 0.56 | 0.33 | 0.62 | 0.64 | 0.32 | 0.5 | 0.56 | 0.6 | 0.59 | 0.425 | 0.6 | 0.365 | 0.53 | 0.415 | 0.566666667 | 0.41 | 0.618 |
| CO2 Emissions | 0.36 | 0.19 | 0.61 | 0.63 | 0.36 | 0.57 | 0.4 | 0.53 | 0.485 | 0.2 | 0.495 | 0.22 | 0.465 | 0.21 | 0.52 | 0.223333333 | 0.536 |
| CO2 emissions | 0.48 | 0.3 | 0.54 | 0.48 | 0.34 | 0.47 | 0.64 | 0.7 | 0.51 | 0.3 | 0.48 | 0.235 | 0.475 | 0.265 | 0.476666667 | 0.233333333 | 0.502 |
| CO2 emissions | 0.49 | 0.4 | 0.65 | 0.69 | 0.47 | 0.33 | 0.52 | 0.44 | 0.57 | 0.305 | 0.59 | 0.3 | 0.41 | 0.435 | 0.503333333 | 0.356666667 | 0.504 |
| CO2 emissions | 0.5 | 0.56 | 0.53 | 0.47 | 0.47 | 0.45 | 0.64 | 0.36 | 0.515 | 0.445 | 0.485 | 0.405 | 0.475 | 0.445 | 0.473333333 | 0.38 | 0.562 |
| CO2 emissions | 0.58 | 0.33 | 0.74 | 0.53 | 0.59 | 0.8 | 0.65 | 0.42 | 0.66 | 0.27 | 0.555 | 0.29 | 0.69 | 0.285 | 0.636666667 | 0.273333333 | 0.634 |
| CO2 emissions | 0.64 | 0.43 | 0.69 | 0.78 | 0.37 | 0.84 | 0.88 | 0.67 | 0.665 | 0.365 | 0.71 | 0.33 | 0.74 | 0.43 | 0.753333333 | 0.363333333 | 0.682 |
| CO2 emissions | 0.64 | 0.43 | 0.58 | 0.72 | 0.24 | 0.67 | 0.84 | 0.67 | 0.61 | 0.24 | 0.68 | 0.26 | 0.655 | 0.48 | 0.676666667 | 0.35 | 0.664 |
| CO2 emissions | 0.8 | 0.62 | 0.67 | 0.73 | 0.47 | 0.79 | 0.69 | 0.62 | 0.735 | 0.425 | 0.765 | 0.435 | 0.795 | 0.535 | 0.773333333 | 0.44 | 0.68 |
| CO2 emissions | 0.93 | 0.53 | 0.67 | 0.69 | 0.47 | 0.93 | 0.73 | 0.5 | 0.8 | 0.405 | 0.81 | 0.39 | 0.93 | 0.41 | 0.85 | 0.356666667 | 0.7 |
| CO2 emissions % | 0.25 | 0.26 | 0.54 | 0.63 | 0.41 | 0.46 | 0.52 | 0.41 | 0.395 | 0.27 | 0.44 | 0.255 | 0.355 | 0.245 | 0.446666667 | 0.246666667 | 0.5 |
| CO2 emissions/cap | 0.87 | 0.41 | 0.85 | 0.87 | 0.5 | 0.73 | 0.92 | 0.92 | 0.86 | 0.455 | 0.87 | 0.395 | 0.8 | 0.495 | 0.823333333 | 0.456666667 | 0.776 |
| CO2 Intensity | 0.36 | 0.25 | 0.51 | 0.54 | 0.4 | 0.65 | 0.45 | 0.4 | 0.435 | 0.215 | 0.45 | 0.25 | 0.505 | 0.285 | 0.516666667 | 0.273333333 | 0.514 |
| Coal | 0.5 | 0.16 | 0.37 | 0.58 | 0.32 | 0.4 | 0.37 | 0.42 | 0.435 | 0.16 | 0.54 | 0.175 | 0.45 | 0.12 | 0.493333333 | 0.143333333 | 0.44 |
| Coal Electricity | 0.31 | 0.33 | 0.47 | 0.5 | 0.14 | 0.78 | 0.61 | 0.5 | 0.39 | 0.26 | 0.405 | 0.3 | 0.545 | 0.33 | 0.53 | 0.31 | 0.5 |
| Comm. Imports $US | 0.82 | 0.42 | 0.93 | 0.93 | 0.32 | 0.9 | 0.92 | 0.73 | 0.875 | 0.4 | 0.875 | 0.335 | 0.86 | 0.46 | 0.883333333 | 0.39 | 0.846 |
| Communications | 0.49 | 0.55 | 0.6 | 0.48 | 0.32 | 0.43 | 0.47 | 0.56 | 0.545 | 0.545 | 0.485 | 0.465 | 0.46 | 0.465 | 0.466666667 | 0.436666667 | 0.522 |
| Compound Inflation | 0.33 | 0.42 | 0.6 | 0.73 | 0.28 | 0.27 | 0.52 | 0.53 | 0.465 | 0.42 | 0.53 | 0.41 | 0.3 | 0.42 | 0.443333333 | 0.413333333 | 0.498 |
| Compulsory | 0.6 | 0.22 | 0.53 | 0.48 | 0.32 | 0.62 | 0.5 | 0.45 | 0.565 | 0.295 | 0.54 | 0.175 | 0.61 | 0.36 | 0.566666667 | 0.283333333 | 0.516 |
| Computer Service | 0.57 | 0.24 | 0.67 | 0.59 | 0.44 | 0.48 | 0.33 | 0.35 | 0.62 | 0.33 | 0.58 | 0.245 | 0.525 | 0.275 | 0.546666667 | 0.266666667 | 0.518 |
| Computer Services | 0.4 | 0.29 | 0.73 | 0.54 | 0.34 | 0.45 | 0.61 | 0.35 | 0.565 | 0.31 | 0.47 | 0.27 | 0.425 | 0.335 | 0.463333333 | 0.306666667 | 0.478 |
| Computer Services | 0.68 | 0.35 | 0.87 | 0.81 | 0.44 | 0.5 | 0.62 | 0.54 | 0.775 | 0.385 | 0.745 | 0.3 | 0.59 | 0.4 | 0.663333333 | 0.35 | 0.616 |
| Condom Use Female | 0.3 | 0 | 0.27 | 0.25 | 0.38 | 0.25 | 0.38 | 0.12 | 0.285 | 0 | 0.275 | 0 | 0.275 | 0 | 0.266666667 | 0 | 0.273333333 |
| Condom Use Male | 0.23 | 0 | 0.17 | 0.17 | 0.16 | 0.23 | 0.1 | 0 | 0.2 | 0 | 0.2 | 0 | 0.23 | 0 | 0.21 | 0 | 0.19 |
| Consumption LCU | 0.4 | 0.29 | 0.56 | 0.49 | 0.32 | 0.39 | 0.4 | 0.59 | 0.48 | 0.25 | 0.445 | 0.27 | 0.395 | 0.17 | 0.426666667 | 0.196666667 | 0.468 |
| Consumption per GDP | 1 | 0.78 | 0.69 | 0.67 | 0.41 | 0.42 | 0.7 | 0.7 | 0.845 | 0.58 | 0.835 | 0.49 | 0.71 | 0.57 | 0.696666667 | 0.446666667 | 0.654 |
| Consumption Private | 0.56 | 0.15 | 0.71 | 0.75 | 0.34 | 0.56 | 0.59 | 0.71 | 0.635 | 0.385 | 0.655 | 0.265 | 0.56 | 0.37 | 0.623333333 | 0.373333333 | 0.59 |
| Consumption US$ | 0.72 | 0.5 | 0.69 | 0.85 | 0.44 | 0.87 | 0.77 | 0.62 | 0.705 | 0.39 | 0.785 | 0.375 | 0.795 | 0.415 | 0.813333333 | 0.36 | 0.686 |
| Consumption US$ | 0.81 | 0.3 | 0.67 | 0.83 | 0.5 | 0.84 | 0.75 | 0.67 | 0.74 | 0.29 | 0.82 | 0.305 | 0.825 | 0.265 | 0.826666667 | 0.28 | 0.676 |
| Consumption/Cap | 0.36 | 0.3 | 0.62 | 0.54 | 0.37 | 0.33 | 0.6 | 0.41 | 0.49 | 0.225 | 0.45 | 0.25 | 0.345 | 0.36 | 0.41 | 0.306666667 | 0.45 |
| Container Traffic | 0.56 | 0.55 | 0.46 | 0.58 | 0.4 | 0.59 | 0.71 | 0.6 | 0.51 | 0.395 | 0.57 | 0.32 | 0.575 | 0.425 | 0.576666667 | 0.313333333 | 0.4725 |
| Contraceptive % Fem | 0.6 | 0.37 | 0.6 | 0.8 | 0.38 | 0.53 | 0.67 | 0.54 | 0.6 | 0.32 | 0.7 | 0.23 | 0.565 | 0.365 | 0.643333333 | 0.273333333 | 0.678 |
| Contract Enforcmt | 0.32 | 0.6 | 0.5 | 0.51 | 0.35 | 0.34 | 0.47 | 0.24 | 0.41 | 0.46 | 0.415 | 0.425 | 0.33 | 0.49 | 0.39 | 0.41 | 0.48 |
| Contributing | 0.66 | 0.21 | 0.9 | 0.84 | 0.47 | 0.78 | 0.92 | 0.9 | 0.78 | 0.255 | 0.75 | 0.27 | 0.72 | 0.315 | 0.76 | 0.32 | 0.788 |
| Corp. Depreciation US$ | 0.79 | 0.5 | 0.77 | 0.85 | 0.41 | 0.86 | 0.87 | 0.69 | 0.78 | 0.46 | 0.82 | 0.44 | 0.825 | 0.42 | 0.833333333 | 0.406666667 | 0.77 |
| Corruption Perception | 0.81 | 0.38 | 0.86 | 0.92 | 0.44 | 0.42 | 0.9 | 0.9 | 0.835 | 0.33 | 0.865 | 0.225 | 0.615 | 0.335 | 0.716666667 | 0.246666667 | 0.863333333 |
| Cost of Living Ratio | 0.67 | 0.21 | 0.88 | 0.77 | 0.53 | 0.5 | 1 | 1 | 0.775 | 0.305 | 0.72 | 0.205 | 0.585 | 0.255 | 0.646666667 | 0.236666667 | 0.773333333 |
| Cost to Export | 0.6 | 0.39 | 0.94 | 0.82 | 0.59 | 0.7 | 0.88 | 0.65 | 0.77 | 0.385 | 0.71 | 0.265 | 0.65 | 0.345 | 0.706666667 | 0.276666667 | 0.786666667 |
| Country Complexity | 0.6 | 0.46 | 0.85 | 0.81 | 0.71 | 0.61 | 0.93 | 0.85 | 0.725 | 0.495 | 0.705 | 0.355 | 0.605 | 0.3 | 0.673333333 | 0.283333333 | 0.622 |
| Coverage | 0.38 | 0 | 0.33 | 0.38 | 0.24 | 0.5 | 0.33 | 0.09 | 0.355 | 0 | 0.38 | 0 | 0.44 | 0 | 0.42 | 0 | 0.363333333 |
| CPI | 0.59 | 0.38 | 0.62 | 0.73 | 0.32 | 0.41 | 0.55 | 0.7 | 0.605 | 0.28 | 0.66 | 0.275 | 0.5 | 0.34 | 0.576666667 | 0.283333333 | 0.584 |
| CPIA | 0.2 | 0 | 0.12 | 0.19 | 0.25 | 0.31 | 0.29 | 0.06 | 0.16 | 0 | 0.195 | 0 | 0.255 | 0 | 0.233333333 | 0 | 0.17 |
| CPIA | 0.23 | 0 | 0.2 | 0.35 | 0.12 | 0.31 | 0.12 | 0.06 | 0.215 | 0 | 0.29 | 0 | 0.27 | 0 | 0.296666667 | 0 | 0.195 |
| CPIA | 0.25 | 0 | 0 | 0 | 0 | 0.23 | 0 | 0 | 0.125 | 0 | 0.125 | 0 | 0.24 | 0 | 0.16 | 0 | 0.07 |
| CPIA | 0.25 | 0 | 0.15 | 0.2 | 0.1 | 0.31 | 0.17 | 0.07 | 0.2 | 0 | 0.225 | 0 | 0.28 | 0 | 0.253333333 | 0 | 0.2 |
| CPIA Trade Rating | 0.24 | 0 | 0.5 | 1 | 0.44 | 0.23 | 0 | 0.03 | 0.37 | 0 | 0.62 | 0 | 0.235 | 0 | 0.49 | 0 | 0.435 |
| Credit %GDP | 0.76 | 0.1 | 0.85 | 0.92 | 0.32 | 0.39 | 0.92 | 0.69 | 0.805 | 0.19 | 0.84 | 0.24 | 0.575 | 0.24 | 0.69 | 0.286666667 | 0.712 |
| Credit Private % GDP | 0.76 | 0.1 | 0.85 | 0.92 | 0.38 | 0.33 | 0.92 | 0.77 | 0.805 | 0.19 | 0.84 | 0.24 | 0.545 | 0.205 | 0.67 | 0.263333333 | 0.682 |
| Credit Registry | 0.68 | 0 | 0.52 | 0.65 | 0.5 | 0.47 | 0.52 | 0.27 | 0.6 | 0.105 | 0.665 | 0.17 | 0.575 | 0 | 0.6 | 0.113333333 | 0.6075 |
| Crime & Theft | 0.6 | 0.52 | 0.67 | 0.68 | 0.44 | 0.38 | 0.64 | 0.67 | 0.635 | 0.445 | 0.64 | 0.32 | 0.49 | 0.57 | 0.553333333 | 0.42 | 0.65 |
| Crop Index | 0.4 | 0.21 | 0.64 | 0.73 | 0.53 | 0.25 | 0.82 | 0.65 | 0.52 | 0.315 | 0.565 | 0.305 | 0.325 | 0.255 | 0.46 | 0.303333333 | 0.546 |
| Cropland | 0.45 | 0.54 | 0.41 | 0.46 | 0.6 | 0.61 | 0.47 | 0.38 | 0.43 | 0.52 | 0.455 | 0.435 | 0.53 | 0.55 | 0.506666667 | 0.476666667 | 0.452 |
| Custom Process Burden | 0.94 | 0.41 | 0.79 | 0.85 | 0.38 | 0.55 | 1 | 0.92 | 0.865 | 0.415 | 0.895 | 0.295 | 0.745 | 0.35 | 0.78 | 0.293333333 | 0.775 |
| Customs Export | 0.34 | 0 | 0.67 | 0.75 | 0.47 | 0.29 | 0.47 | 0.29 | 0.505 | 0 | 0.545 | 0 | 0.315 | 0 | 0.46 | 0 | 0.4525 |
| Customs/Import Duties | 0.67 | 0.26 | 0.71 | 0.75 | 0.49 | 0.67 | 0.82 | 0.67 | 0.69 | 0.355 | 0.71 | 0.265 | 0.67 | 0.28 | 0.696666667 | 0.276666667 | 0.516 |
| Customs/Import Duties | 0.72 | 0.26 | 0.78 | 0.89 | 0.49 | 0.72 | 0.82 | 0.65 | 0.75 | 0.22 | 0.805 | 0.17 | 0.72 | 0.225 | 0.776666667 | 0.176666667 | 0.674 |
| CVD Cancer Diabetes | 0.83 | 0.36 | 0.78 | 0.82 | 0.36 | 0.39 | 1 | 0.9 | 0.805 | 0.345 | 0.825 | 0.33 | 0.61 | 0.325 | 0.68 | 0.316666667 | 0.81 |
| DAC Aid US$ | 0.69 | 0.6 | 0.56 | 0.67 | 0.5 | 0.76 | 0.78 | 0.69 | 0.625 | 0.3 | 0.68 | 0.3 | 0.725 | 0.56 | 0.706666667 | 0.373333333 | 0.558 |
| Days Paid Vacation | 0.44 | 0.21 | 0.64 | 0.57 | 0.5 | 0.55 | 0.64 | 0.5 | 0.54 | 0.205 | 0.505 | 0.23 | 0.495 | 0.355 | 0.52 | 0.32 | 0.55 |
| Death Prob 10-14 | 0.73 | 0.3 | 0.91 | 0.94 | 0.61 | 0.48 | 0.95 | 0.61 | 0.82 | 0.425 | 0.835 | 0.285 | 0.605 | 0.3 | 0.716666667 | 0.29 | 0.742 |
| Death Prob 15-19 | 0.83 | 0.56 | 0.89 | 1 | 0.54 | 0.47 | 1 | 0.71 | 0.86 | 0.67 | 0.915 | 0.445 | 0.65 | 0.43 | 0.766666667 | 0.396666667 | 0.794 |
| Death Prob 20-24 | 0.94 | 0.5 | 0.9 | 0.94 | 0.5 | 0.47 | 0.93 | 1 | 0.92 | 0.545 | 0.94 | 0.415 | 0.705 | 0.4 | 0.783333333 | 0.376666667 | 0.716 |
| Death Prob 5-9 | 0.82 | 0.44 | 0.93 | 0.95 | 0.71 | 0.55 | 1 | 0.73 | 0.875 | 0.22 | 0.885 | 0.22 | 0.685 | 0.37 | 0.773333333 | 0.246666667 | 0.764 |
| Death rate, crude | 0.61 | 0.41 | 0.42 | 0.43 | 0.38 | 0.6 | 0.45 | 0.7 | 0.515 | 0.36 | 0.52 | 0.355 | 0.605 | 0.38 | 0.546666667 | 0.353333333 | 0.496 |
| Death Reporting Infant | 0.61 | 0.42 | 0.67 | 0.74 | 0.4 | 0.56 | 0.64 | 0.69 | 0.64 | 0.48 | 0.675 | 0.375 | 0.585 | 0.37 | 0.636666667 | 0.356666667 | 0.673333333 |
| Death Reporting Total | 0.53 | 0.34 | 0.8 | 0.87 | 0.56 | 0.35 | 0.8 | 0.53 | 0.665 | 0.44 | 0.7 | 0.255 | 0.44 | 0.37 | 0.583333333 | 0.303333333 | 0.733333333 |
| Deaths < 5 | 0.59 | 0.42 | 0.7 | 0.74 | 0.41 | 0.79 | 0.6 | 0.8 | 0.645 | 0.235 | 0.665 | 0.335 | 0.69 | 0.375 | 0.706666667 | 0.333333333 | 0.646 |
| Deaths 10-14 | 0.44 | 0.36 | 0.7 | 0.67 | 0.38 | 0.84 | 0.53 | 0.7 | 0.57 | 0.275 | 0.555 | 0.335 | 0.64 | 0.43 | 0.65 | 0.39 | 0.534 |
| Deaths 15-19 | 0.6 | 0.36 | 0.7 | 0.67 | 0.47 | 0.88 | 0.65 | 0.7 | 0.65 | 0.295 | 0.635 | 0.295 | 0.74 | 0.43 | 0.716666667 | 0.363333333 | 0.622 |
| Deaths 20-24 | 0.47 | 0.32 | 0.7 | 0.67 | 0.35 | 0.83 | 0.59 | 0.6 | 0.585 | 0.29 | 0.57 | 0.265 | 0.65 | 0.36 | 0.656666667 | 0.31 | 0.6 |
| Deaths 5-9 yrs | 0.43 | 0.18 | 0.64 | 0.73 | 0.34 | 0.94 | 0.62 | 0.55 | 0.535 | 0.115 | 0.58 | 0.215 | 0.685 | 0.34 | 0.7 | 0.31 | 0.54 |
| Debt Net Flows Extl | 0.56 | 0 | 0.38 | 0.45 | 0.13 | 0.26 | 0.25 | 0.25 | 0.47 | 0 | 0.505 | 0 | 0.41 | 0 | 0.423333333 | 0 | 0.478 |
| Debt Rescheduled | 0.35 | 0 | 0 | 0 | 0 | 0.35 | 0 | 0.14 | 0.175 | 0 | 0.175 | 0 | 0.35 | 0 | 0.233333333 | 0 | 0.294 |
| Debt Service | 0.26 | 0 | 0.38 | 0.5 | 0.31 | 0.38 | 0.5 | 0.38 | 0.32 | 0 | 0.38 | 0 | 0.32 | 0 | 0.38 | 0 | 0.342 |
| Debt Service | 0.32 | 0 | 0.25 | 0.38 | 0.18 | 0.43 | 0.5 | 0.25 | 0.285 | 0 | 0.35 | 0 | 0.375 | 0 | 0.376666667 | 0 | 0.296 |
| Debt Service | 0.38 | 0 | 0.38 | 0.62 | 0.26 | 0.3 | 0.38 | 0.12 | 0.38 | 0 | 0.5 | 0 | 0.34 | 0 | 0.433333333 | 0 | 0.432 |
| Debt Service | 0.41 | 0 | 0.38 | 0.31 | 0.27 | 0.23 | 0.25 | 0.12 | 0.395 | 0 | 0.36 | 0 | 0.32 | 0 | 0.316666667 | 0 | 0.38 |
| Debt Service | 0.62 | 0 | 0.21 | 0.29 | 0.2 | 0.53 | 0.33 | 0.08 | 0.415 | 0 | 0.455 | 0 | 0.575 | 0 | 0.48 | 0 | 0.336 |
| Debt Service % | 0.26 | 0 | 0.22 | 0.24 | 0.18 | 0.31 | 0.25 | 0.25 | 0.24 | 0 | 0.25 | 0 | 0.285 | 0 | 0.27 | 0 | 0.248 |
| Debt Stock resched | 0.28 | 0 | 0.03 | 0.3 | 0.03 | 0.28 | 0.05 | 0.06 | 0.155 | 0 | 0.29 | 0 | 0.28 | 0 | 0.286666667 | 0 | 0.1525 |
| Democracy Index | 0.86 | 0.36 | 0.86 | 0.8 | 0.65 | 0.36 | 0.92 | 0.92 | 0.86 | 0.325 | 0.83 | 0.295 | 0.61 | 0.295 | 0.673333333 | 0.273333333 | 0.7475 |
| Deposit Int Rate | 0.63 | 0.28 | 0.62 | 0.62 | 0.47 | 0.67 | 0.62 | 0.56 | 0.625 | 0.14 | 0.625 | 0.14 | 0.65 | 0.245 | 0.64 | 0.163333333 | 0.538 |
| Depositors | 0.42 | 0 | 0.54 | 0.54 | 0.27 | 0.41 | 0.55 | 0.4 | 0.48 | 0 | 0.48 | 0 | 0.415 | 0 | 0.456666667 | 0 | 0.49 |
| Depth of Credit Info | 0.24 | 0.21 | 0.33 | 0.34 | 0.34 | 0.46 | 0.29 | 0.16 | 0.285 | 0.28 | 0.29 | 0.195 | 0.35 | 0.255 | 0.346666667 | 0.23 | 0.303333333 |
| Development Asst | 0.74 | 0.4 | 0.78 | 0.76 | 0.25 | 0.72 | 0.78 | 0.69 | 0.76 | 0.2 | 0.75 | 0.2 | 0.73 | 0.46 | 0.74 | 0.306666667 | 0.588 |
| Development Asst | 0.74 | 0.6 | 0.78 | 0.76 | 0.32 | 0.72 | 0.71 | 0.62 | 0.76 | 0.3 | 0.75 | 0.3 | 0.73 | 0.56 | 0.74 | 0.373333333 | 0.576 |
| Disposable Income $US | 0.29 | 0.23 | 0.75 | 0.75 | 0.58 | 0.45 | 0.62 | 1 | 0.52 | 0.26 | 0.52 | 0.19 | 0.37 | 0.26 | 0.496666667 | 0.223333333 | 0.39 |
| Dist.to Frontier | 0.76 | 0.14 | 0.8 | 0.74 | 0.56 | 0.51 | 0.87 | 0.69 | 0.78 | 0.28 | 0.75 | 0.13 | 0.635 | 0.22 | 0.67 | 0.186666667 | 0.766666667 |
| Divorce Rate | 0.21 | 0.13 | 0.49 | 0.57 | 0.5 | 0.3 | 0.57 | 0.32 | 0.35 | 0.18 | 0.39 | 0.18 | 0.255 | 0.265 | 0.36 | 0.253333333 | 0.346 |
| Doctoral | 0.68 | 0.23 | 0.8 | 0.8 | 0.38 | 0.79 | 0.8 | 0.9 | 0.74 | 0.315 | 0.74 | 0.24 | 0.735 | 0.305 | 0.756666667 | 0.286666667 | 0.76 |
| Doctoral Female | 0.84 | 0.23 | 0.76 | 0.8 | 0.43 | 0.67 | 0.84 | 0.9 | 0.8 | 0.305 | 0.82 | 0.215 | 0.755 | 0.305 | 0.77 | 0.27 | 0.8 |
| Doctoral Male | 0.71 | 0.1 | 0.73 | 0.88 | 0.47 | 0.79 | 0.8 | 0.9 | 0.72 | 0.3 | 0.795 | 0.24 | 0.75 | 0.24 | 0.793333333 | 0.286666667 | 0.773333333 |
| Domestic | 0.76 | 0.28 | 0.77 | 0.92 | 0.29 | 0.39 | 0.85 | 0.73 | 0.765 | 0.28 | 0.84 | 0.33 | 0.575 | 0.33 | 0.69 | 0.346666667 | 0.714 |
| Domestic Credit | 0.5 | 0 | 0.41 | 0.53 | 0.25 | 0.31 | 0.58 | 0.5 | 0.455 | 0 | 0.515 | 0 | 0.405 | 0 | 0.446666667 | 0 | 0.442 |
| Domestic Credit LCU | 0.57 | 0.19 | 0.38 | 0.33 | 0.34 | 0.57 | 0.5 | 0.31 | 0.475 | 0.245 | 0.45 | 0.22 | 0.57 | 0.26 | 0.49 | 0.256666667 | 0.396 |
| Domestic Savings %GDP | 0.92 | 0.88 | 0.67 | 0.62 | 0.44 | 0.87 | 0.77 | 0.69 | 0.795 | 0.69 | 0.77 | 0.565 | 0.895 | 0.65 | 0.803333333 | 0.516666667 | 0.63 |
| Domestic Savings LCU | 0.73 | 0.29 | 0.56 | 0.62 | 0.35 | 0.73 | 0.56 | 0.5 | 0.645 | 0.25 | 0.675 | 0.27 | 0.73 | 0.4 | 0.693333333 | 0.35 | 0.582 |
| Domestic Savings US$ | 0.86 | 0.62 | 0.69 | 0.8 | 0.34 | 1 | 0.87 | 0.62 | 0.775 | 0.45 | 0.83 | 0.5 | 0.93 | 0.685 | 0.886666667 | 0.583333333 | 0.736 |
| Drought, flood, temp | 0.51 | 0.28 | 0.75 | 0.68 | 0.5 | 0.63 | 0.69 | 0.71 | 0.63 | 0.39 | 0.595 | 0.265 | 0.57 | 0.29 | 0.606666667 | 0.276666667 | 0.646666667 |
| Ease of Business Index | 0.78 | 0.25 | 0.82 | 0.74 | 0.41 | 0.41 | 0.82 | 0.64 | 0.8 | 0.285 | 0.76 | 0.16 | 0.595 | 0.215 | 0.643333333 | 0.166666667 | 0.78 |
| Econ Fitness | 0.68 | 0.5 | 0.77 | 0.81 | 0.28 | 0.53 | 0.92 | 0.36 | 0.725 | 0.39 | 0.745 | 0.375 | 0.605 | 0.4 | 0.673333333 | 0.35 | 0.753333333 |
| Econ.Dev Assistance | 0.76 | 0.48 | 0.75 | 0.76 | 0.27 | 0.84 | 0.78 | 0.59 | 0.755 | 0.24 | 0.76 | 0.24 | 0.8 | 0.465 | 0.786666667 | 0.31 | 0.572 |
| Economic Freedom | 0.54 | 0.27 | 0.69 | 0.79 | 0.38 | 0.39 | 0.68 | 0.75 | 0.615 | 0.285 | 0.665 | 0.195 | 0.465 | 0.325 | 0.573333333 | 0.256666667 | 0.673333333 |
| Edu Attainment Tertiary F | 0.81 | 0.24 | 0.8 | 0.87 | 0.6 | 0.44 | 0.8 | 0.75 | 0.805 | 0.235 | 0.84 | 0.245 | 0.625 | 0.235 | 0.706666667 | 0.24 | 0.73 |
| Edu Attainment Tertiary M | 0.76 | 0.3 | 0.85 | 0.85 | 0.5 | 0.805 | 0.34 | 0.805 | 0.275 | 0.76 | 0.3 | 0.805 | 0.275 | 0.715 | |||
| Edu Masters Female | 0.58 | 0.16 | 0.85 | 0.92 | 0.55 | 0.73 | 0.79 | 0.82 | 0.715 | 0.28 | 0.75 | 0.27 | 0.655 | 0.33 | 0.743333333 | 0.346666667 | 0.783333333 |
| Edu Masters Male | 0.63 | 0.22 | 0.8 | 0.78 | 0.6 | 0.71 | 0.74 | 0.82 | 0.715 | 0.36 | 0.705 | 0.21 | 0.67 | 0.36 | 0.706666667 | 0.306666667 | 0.736666667 |
| Edu Primary female | 0.69 | 0.35 | 0.8 | 0.73 | 0.57 | 0.59 | 0.75 | 0.67 | 0.745 | 0.505 | 0.71 | 0.255 | 0.64 | 0.34 | 0.67 | 0.28 | 0.63 |
| Edu Secondary | 0.7 | 0.28 | 0.93 | 0.93 | 0.53 | 0.69 | 0.87 | 0.73 | 0.815 | 0.39 | 0.815 | 0.265 | 0.695 | 0.29 | 0.773333333 | 0.276666667 | 0.7225 |
| Edu Spend %GDP | 0.41 | 0.19 | 0.56 | 0.59 | 0.21 | 0.39 | 0.52 | 0.47 | 0.485 | 0.285 | 0.5 | 0.22 | 0.4 | 0.21 | 0.463333333 | 0.223333333 | 0.542 |
| Edu Spend %Gov | 0.46 | 0.13 | 0.52 | 0.52 | 0.44 | 0.24 | 0.43 | 0.29 | 0.49 | 0.13 | 0.49 | 0.19 | 0.35 | 0.18 | 0.406666667 | 0.203333333 | 0.506 |
| Edu Spend/Pupil | 0.63 | 0.11 | 0.67 | 0.69 | 0.32 | 0.49 | 0.8 | 0.73 | 0.65 | 0.265 | 0.66 | 0.18 | 0.56 | 0.305 | 0.603333333 | 0.286666667 | 0.6275 |
| Educ. % of Primary Cmplt | 0.76 | 0.24 | 0.83 | 0.92 | 0.6 | 0.45 | 1 | 0.77 | 0.795 | 0.325 | 0.84 | 0.245 | 0.605 | 0.26 | 0.71 | 0.256666667 | 0.768 |
| Educ. Secondary Pupils | 0.62 | 0.5 | 0.44 | 0.36 | 0.23 | 0.54 | 0.29 | 0.54 | 0.53 | 0.365 | 0.49 | 0.365 | 0.58 | 0.42 | 0.506666667 | 0.356666667 | 0.482 |
| Education Cost | 0.5 | 0 | 0.28 | 0.1 | 0.55 | 0.3 | 0 | 0.18 | 0.39 | 0 | 0.3 | 0 | 0.4 | 0 | 0.3 | 0 | 0.293333333 |
| Education Index | 0.8 | 0.23 | 0.93 | 0.93 | 0.51 | 0.61 | 0.92 | 0.69 | 0.865 | 0.425 | 0.865 | 0.24 | 0.705 | 0.265 | 0.78 | 0.26 | 0.886666667 |
| Education Masters | 0.61 | 0.26 | 0.85 | 0.92 | 0.55 | 0.56 | 0.63 | 0.75 | 0.73 | 0.33 | 0.765 | 0.255 | 0.585 | 0.38 | 0.696666667 | 0.336666667 | 0.793333333 |
| Education Middle | 0.71 | 0.24 | 0.93 | 0.86 | 0.58 | 0.61 | 0.67 | 0.62 | 0.82 | 0.32 | 0.785 | 0.205 | 0.66 | 0.31 | 0.726666667 | 0.263333333 | 0.7075 |
| Education Minimum | 0.59 | 0.28 | 0.86 | 0.86 | 0.53 | 0.51 | 0.71 | 0.71 | 0.725 | 0.205 | 0.725 | 0.265 | 0.55 | 0.255 | 0.653333333 | 0.253333333 | 0.65 |
| Education Pri. Pupils %Fem | 0.69 | 0.54 | 0.75 | 0.88 | 0.41 | 0.53 | 0.69 | 0.69 | 0.72 | 0.48 | 0.785 | 0.42 | 0.61 | 0.55 | 0.7 | 0.466666667 | 0.684 |
| Education to Gr-5 | 0.71 | 0.55 | 0.77 | 0.79 | 0.47 | 0.48 | 1 | 0.77 | 0.74 | 0.535 | 0.75 | 0.4 | 0.595 | 0.42 | 0.66 | 0.363333333 | 0.672 |
| Educational | 0.81 | 0.28 | 0.93 | 0.93 | 0.6 | 0.63 | 0.87 | 0.8 | 0.87 | 0.39 | 0.87 | 0.265 | 0.72 | 0.29 | 0.79 | 0.276666667 | 0.73 |
| Electric Consumptn | 0.82 | 0.53 | 0.92 | 1 | 0.43 | 0.68 | 1 | 0.92 | 0.87 | 0.535 | 0.91 | 0.455 | 0.75 | 0.41 | 0.833333333 | 0.4 | 0.794 |
| Electric Vehicles | 0.38 | 0 | 0 | 0 | 0 | 0.38 | 0 | 0 | 0.19 | 0 | 0.19 | 0 | 0.38 | 0 | 0.253333333 | 0 | 0.126666667 |
| Electric xmit Loss % | 0.69 | 0.29 | 0.81 | 0.85 | 0.43 | 0.32 | 1 | 0.89 | 0.75 | 0.355 | 0.77 | 0.345 | 0.505 | 0.29 | 0.62 | 0.326666667 | 0.67 |
| Electricity Access %Pop | 0.44 | 0 | 0.52 | 0.64 | 0.31 | 0.47 | 0.5 | 0.48 | 0.48 | 0 | 0.54 | 0 | 0.455 | 0.21 | 0.516666667 | 0.14 | 0.604 |
| Emission Damage | 0.9 | 0.27 | 1 | 1 | 0.6 | 0.51 | 1 | 1 | 0.95 | 0.435 | 0.95 | 0.235 | 0.705 | 0.385 | 0.803333333 | 0.323333333 | 0.89 |
| Empl Agri Female | 0.83 | 0.6 | 0.76 | 0.94 | 0.4 | 0.74 | 0.9 | 0.9 | 0.795 | 0.56 | 0.885 | 0.45 | 0.785 | 0.51 | 0.836666667 | 0.44 | 0.72 |
| Empl Agri Male % | 0.8 | 0.38 | 0.94 | 1 | 0.41 | 0.65 | 0.94 | 0.94 | 0.87 | 0.54 | 0.9 | 0.39 | 0.725 | 0.44 | 0.816666667 | 0.426666667 | 0.798 |
| Empl Agriculture | 0.9 | 0.6 | 0.88 | 1 | 0.41 | 0.6 | 0.94 | 1 | 0.89 | 0.65 | 0.95 | 0.5 | 0.75 | 0.55 | 0.833333333 | 0.5 | 0.794 |
| Empl.Services %Fem | 0.79 | 0.32 | 0.77 | 0.92 | 0.33 | 0.43 | 0.85 | 1 | 0.78 | 0.3 | 0.855 | 0.275 | 0.61 | 0.32 | 0.713333333 | 0.29 | 0.68 |
| Empl:Pop Ratio 15-24 | 0.49 | 0.21 | 0.24 | 0.25 | 0.28 | 0.24 | 0.38 | 0.38 | 0.365 | 0.295 | 0.37 | 0.26 | 0.365 | 0.265 | 0.326666667 | 0.28 | 0.366 |
| Empl:Pop Ratio Female | 0.45 | 0.28 | 0.6 | 0.54 | 0.34 | 0.39 | 0.67 | 0.62 | 0.525 | 0.28 | 0.495 | 0.225 | 0.42 | 0.3 | 0.46 | 0.256666667 | 0.544 |
| Empl:Pop Ratio Male | 0.46 | 0.62 | 0.6 | 0.63 | 0.56 | 0.41 | 0.53 | 0.53 | 0.53 | 0.405 | 0.545 | 0.465 | 0.435 | 0.59 | 0.5 | 0.496666667 | 0.54 |
| Empl:Population Ratio | 0.56 | 0.5 | 0.47 | 0.41 | 0.38 | 0.35 | 0.35 | 0.63 | 0.515 | 0.38 | 0.485 | 0.405 | 0.455 | 0.49 | 0.44 | 0.43 | 0.408 |
| Emplmt Compensation | 0.37 | 0.09 | 0.56 | 0.53 | 0.4 | 0.27 | 0.44 | 0.47 | 0.465 | 0.165 | 0.45 | 0.17 | 0.32 | 0.165 | 0.39 | 0.193333333 | 0.422 |
| Emplmt Compensation | 0.68 | 0.36 | 0.78 | 0.67 | 0.56 | 0.5 | 0.71 | 0.6 | 0.73 | 0.405 | 0.675 | 0.315 | 0.59 | 0.28 | 0.616666667 | 0.276666667 | 0.64 |
| Emplmt Services %Male | 0.71 | 0.32 | 0.8 | 1 | 0.36 | 0.49 | 0.85 | 0.92 | 0.755 | 0.43 | 0.855 | 0.315 | 0.6 | 0.32 | 0.733333333 | 0.316666667 | 0.64 |
| Employers Female | 0.55 | 0.42 | 0.46 | 0.52 | 0.44 | 0.61 | 0.56 | 0.4 | 0.505 | 0.3 | 0.535 | 0.335 | 0.58 | 0.37 | 0.56 | 0.33 | 0.482 |
| Employment | 0.45 | 0.5 | 0.48 | 0.49 | 0.29 | 0.39 | 0.55 | 0.44 | 0.465 | 0.4 | 0.47 | 0.405 | 0.42 | 0.41 | 0.443333333 | 0.376666667 | 0.512 |
| Employment | 0.61 | 0.33 | 0.85 | 0.92 | 0.5 | 0.46 | 1 | 1 | 0.73 | 0.355 | 0.765 | 0.32 | 0.535 | 0.365 | 0.663333333 | 0.346666667 | 0.64 |
| Energy Depltn | 0.66 | 0.44 | 0.55 | 0.57 | 0.42 | 0.59 | 0.32 | 0.47 | 0.605 | 0.385 | 0.615 | 0.385 | 0.625 | 0.42 | 0.606666667 | 0.39 | 0.58 |
| Energy Imports % | 0.65 | 0.27 | 0.3 | 0.42 | 0.4 | 0.6 | 0.42 | 0.28 | 0.475 | 0.225 | 0.535 | 0.235 | 0.625 | 0.325 | 0.556666667 | 0.283333333 | 0.516 |
| Energy Intensity Level | 0.67 | 0.19 | 0.37 | 0.56 | 0.23 | 0.48 | 0.34 | 0.43 | 0.52 | 0.235 | 0.615 | 0.21 | 0.575 | 0.21 | 0.57 | 0.216666667 | 0.45 |
| Energy Methane | 0.48 | 0.6 | 0.47 | 0.61 | 0.2 | 0.88 | 0.54 | 0.47 | 0.475 | 0.45 | 0.545 | 0.455 | 0.68 | 0.625 | 0.656666667 | 0.52 | 0.516 |
| Energy Methane | 0.69 | 0.62 | 0.65 | 0.57 | 0.24 | 0.61 | 0.5 | 0.79 | 0.67 | 0.375 | 0.63 | 0.37 | 0.65 | 0.575 | 0.623333333 | 0.423333333 | 0.572 |
| Energy Use | 0.32 | 0.23 | 0.27 | 0.4 | 0.24 | 0.51 | 0.21 | 0.27 | 0.295 | 0.315 | 0.36 | 0.265 | 0.415 | 0.325 | 0.41 | 0.316666667 | 0.376 |
| Energy Use | 0.42 | 0.16 | 0.3 | 0.61 | 0.4 | 0.59 | 0.34 | 0.32 | 0.36 | 0.22 | 0.515 | 0.23 | 0.505 | 0.29 | 0.54 | 0.293333333 | 0.458 |
| Energy Use | 0.83 | 0.3 | 1 | 0.92 | 0.5 | 0.52 | 0.93 | 1 | 0.915 | 0.485 | 0.875 | 0.34 | 0.675 | 0.3 | 0.756666667 | 0.326666667 | 0.806 |
| Energy Use Kg Oil | 0.36 | 0.21 | 0.31 | 0.46 | 0.21 | 0.51 | 0.27 | 0.13 | 0.335 | 0.255 | 0.41 | 0.22 | 0.435 | 0.255 | 0.443333333 | 0.246666667 | 0.394 |
| Equity Inflows $US | 0.68 | 0.45 | 0.74 | 0.78 | 0.58 | 0.69 | 0.89 | 0.75 | 0.71 | 0.385 | 0.73 | 0.31 | 0.685 | 0.45 | 0.716666667 | 0.356666667 | 0.722 |
| Errors & Omissions | 0.53 | 0.39 | 0.74 | 0.84 | 0.37 | 0.69 | 0.9 | 0.7 | 0.635 | 0.36 | 0.685 | 0.32 | 0.61 | 0.325 | 0.686666667 | 0.3 | 0.738 |
| Exchange Index | 0.52 | 0.28 | 0.57 | 0.39 | 0.46 | 0.39 | 0.57 | 0.45 | 0.545 | 0.28 | 0.455 | 0.265 | 0.455 | 0.39 | 0.433333333 | 0.343333333 | 0.474 |
| Expenditure | 0.63 | 0.4 | 0.47 | 0.51 | 0.53 | 0.49 | 0.57 | 0.38 | 0.55 | 0.345 | 0.57 | 0.24 | 0.56 | 0.47 | 0.543333333 | 0.34 | 0.526 |
| Export cost, Doc Complce | 0.62 | 0.29 | 0.8 | 0.88 | 0.58 | 0.59 | 0.82 | 0.55 | 0.71 | 0.315 | 0.75 | 0.295 | 0.605 | 0.29 | 0.696666667 | 0.293333333 | 0.766666667 |
| Export G & S | 0.82 | 0.62 | 0.8 | 0.87 | 0.5 | 1 | 0.85 | 0.69 | 0.81 | 0.5 | 0.845 | 0.435 | 0.91 | 0.685 | 0.896666667 | 0.54 | 0.8 |
| Export High Incomes | 0.48 | 0.32 | 0.61 | 0.63 | 0.5 | 0.56 | 0.67 | 0.62 | 0.545 | 0.41 | 0.555 | 0.285 | 0.52 | 0.4 | 0.556666667 | 0.35 | 0.566 |
| Export Lead time | 0.47 | 0.17 | 0.5 | 0.47 | 0.25 | 0.37 | 0.42 | 0.43 | 0.485 | 0.25 | 0.47 | 0.125 | 0.42 | 0.275 | 0.436666667 | 0.21 | 0.47 |
| Export per Capita | 1 | 0.62 | 0.93 | 0.93 | 0.71 | 0.67 | 1 | 0.85 | 0.965 | 0.58 | 0.965 | 0.345 | 0.835 | 0.475 | 0.866666667 | 0.34 | 0.96 |
| Export Value Index | 0.36 | 0.32 | 0.49 | 0.4 | 0.31 | 0.43 | 0.41 | 0.53 | 0.425 | 0.36 | 0.38 | 0.26 | 0.395 | 0.365 | 0.396666667 | 0.31 | 0.444 |
| Export Volume Index | 0.45 | 0.5 | 0.38 | 0.5 | 0.31 | 0.56 | 0.41 | 0.47 | 0.415 | 0.415 | 0.475 | 0.35 | 0.505 | 0.455 | 0.503333333 | 0.37 | 0.456 |
| Exports $US | 0.87 | 0.8 | 0.73 | 0.85 | 0.5 | 1 | 0.85 | 0.77 | 0.8 | 0.55 | 0.86 | 0.525 | 0.935 | 0.775 | 0.906666667 | 0.6 | 0.792 |
| Exports %GDP | 0.92 | 0.5 | 0.62 | 0.51 | 0.44 | 0.39 | 0.52 | 0.62 | 0.77 | 0.4 | 0.715 | 0.31 | 0.655 | 0.425 | 0.606666667 | 0.323333333 | 0.598 |
| Exports %Growth | 0.57 | 0.23 | 0.49 | 0.48 | 0.47 | 0.38 | 0.49 | 0.43 | 0.53 | 0.23 | 0.525 | 0.15 | 0.475 | 0.265 | 0.476666667 | 0.2 | 0.54 |
| Exports 2010 US$ | 0.82 | 0.62 | 0.73 | 0.83 | 0.5 | 1 | 0.85 | 0.69 | 0.775 | 0.46 | 0.825 | 0.435 | 0.91 | 0.62 | 0.883333333 | 0.496666667 | 0.806 |
| Exports BoP$ | 0.77 | 0.75 | 0.8 | 0.92 | 0.44 | 1 | 0.92 | 0.85 | 0.785 | 0.565 | 0.845 | 0.5 | 0.885 | 0.75 | 0.896666667 | 0.583333333 | 0.798 |
| Exports capcty to Import | 0.65 | 0.67 | 0.46 | 0.53 | 0.4 | 0.52 | 0.5 | 0.47 | 0.555 | 0.545 | 0.59 | 0.46 | 0.585 | 0.605 | 0.566666667 | 0.486666667 | 0.504 |
| Exports C-LCU | 0.71 | 0.67 | 0.43 | 0.46 | 0.4 | 0.46 | 0.5 | 0.47 | 0.57 | 0.545 | 0.585 | 0.46 | 0.585 | 0.605 | 0.543333333 | 0.486666667 | 0.51 |
| Exports ICT %Ex | 0.31 | 0.35 | 0.38 | 0.51 | 0.53 | 0.26 | 0.28 | 0.41 | 0.345 | 0.325 | 0.41 | 0.3 | 0.285 | 0.41 | 0.36 | 0.356666667 | 0.43 |
| Exports ICT US$ | 0.65 | 0.42 | 0.86 | 0.92 | 0.41 | 0.76 | 0.92 | 0.79 | 0.755 | 0.42 | 0.785 | 0.335 | 0.705 | 0.355 | 0.776666667 | 0.32 | 0.708 |
| Exports LCU | 0.69 | 0.54 | 0.4 | 0.49 | 0.24 | 0.39 | 0.5 | 0.56 | 0.545 | 0.48 | 0.59 | 0.395 | 0.54 | 0.53 | 0.523333333 | 0.436666667 | 0.47 |
| Exports Merch $US | 0.72 | 0.42 | 0.77 | 0.75 | 0.5 | 0.94 | 0.85 | 0.56 | 0.745 | 0.35 | 0.735 | 0.335 | 0.83 | 0.5 | 0.803333333 | 0.416666667 | 0.734 |
| Exports Service | 0.72 | 0.47 | 0.87 | 0.87 | 0.4 | 0.71 | 0.92 | 0.85 | 0.795 | 0.425 | 0.795 | 0.36 | 0.715 | 0.37 | 0.766666667 | 0.33 | 0.804 |
| Exports to LI | 0.5 | 0.25 | 0.44 | 0.43 | 0.47 | 0.67 | 0.6 | 0.44 | 0.47 | 0.275 | 0.465 | 0.315 | 0.585 | 0.26 | 0.533333333 | 0.3 | 0.496 |
| Exports to low mid MidEast | 0.55 | 0.42 | 0.56 | 0.62 | 0.53 | 0.37 | 0.56 | 0.5 | 0.555 | 0.37 | 0.585 | 0.27 | 0.46 | 0.48 | 0.513333333 | 0.36 | 0.458 |
| Exports Transport Service | 0.36 | 0.24 | 0.43 | 0.48 | 0.38 | 0.36 | 0.34 | 0.43 | 0.395 | 0.33 | 0.42 | 0.22 | 0.36 | 0.31 | 0.4 | 0.273333333 | 0.38 |
| Exports Travel Services | 0.52 | 0.38 | 0.69 | 0.61 | 0.53 | 0.38 | 0.6 | 0.43 | 0.605 | 0.255 | 0.565 | 0.315 | 0.45 | 0.345 | 0.503333333 | 0.313333333 | 0.552 |
| Ext Debt Stocks | 0.44 | 0 | 0.29 | 0.36 | 0.18 | 0.44 | 0.25 | 0.25 | 0.365 | 0 | 0.4 | 0 | 0.44 | 0 | 0.413333333 | 0 | 0.398 |
| Ext Debt Stocks | 0.54 | 0 | 0.23 | 0.24 | 0.15 | 0.32 | 0.42 | 0.12 | 0.385 | 0 | 0.39 | 0 | 0.43 | 0 | 0.366666667 | 0 | 0.382 |
| Ext Debt Stocks | 0.54 | 0 | 0.31 | 0.38 | 0.38 | 0.4 | 0.33 | 0.07 | 0.425 | 0 | 0.46 | 0 | 0.47 | 0 | 0.44 | 0 | 0.43 |
| Ext Debt Stocks | 0.55 | 0 | 0.3 | 0.31 | 0.23 | 0.39 | 0.5 | 0.21 | 0.425 | 0 | 0.43 | 0 | 0.47 | 0 | 0.416666667 | 0 | 0.412 |
| Ext. Debt % Exports | 0.38 | 0 | 0.27 | 0.41 | 0.33 | 0.46 | 0.33 | 0.15 | 0.325 | 0 | 0.395 | 0 | 0.42 | 0 | 0.416666667 | 0 | 0.353333333 |
| Ext. Debt %GNI | 0.42 | 0 | 0.38 | 0.43 | 0.38 | 0.37 | 0.62 | 0.38 | 0.4 | 0 | 0.425 | 0 | 0.395 | 0 | 0.406666667 | 0 | 0.41 |
| Ext. Debt US$ | 0.44 | 0 | 0.29 | 0.36 | 0.16 | 0.38 | 0.25 | 0.13 | 0.365 | 0 | 0.4 | 0 | 0.41 | 0 | 0.393333333 | 0 | 0.363333333 |
| External Debt Creditors | 0.32 | 0 | 0.5 | 0.5 | 0.25 | 0.56 | 0.62 | 0.44 | 0.41 | 0 | 0.41 | 0 | 0.44 | 0 | 0.46 | 0 | 0.472 |
| External Debt Private | 0.27 | 0 | 0.22 | 0.44 | 0.3 | 0.5 | 0.3 | 0.12 | 0.245 | 0 | 0.355 | 0 | 0.385 | 0 | 0.403333333 | 0 | 0.36 |
| External Debt Total | 0.32 | 0 | 0.62 | 0.62 | 0.31 | 0.67 | 0.62 | 0.44 | 0.47 | 0 | 0.47 | 0 | 0.495 | 0 | 0.536666667 | 0 | 0.508 |
| Family Workers | 0.74 | 0.34 | 0.9 | 0.9 | 0.47 | 0.78 | 0.9 | 0.88 | 0.82 | 0.32 | 0.82 | 0.295 | 0.76 | 0.38 | 0.806666667 | 0.336666667 | 0.78 |
| FDI In (US$) | 0.65 | 0.5 | 0.7 | 0.85 | 0.7 | 0.71 | 0.8 | 0.63 | 0.675 | 0.48 | 0.75 | 0.405 | 0.68 | 0.48 | 0.736666667 | 0.423333333 | 0.73 |
| FDI Inflows %GDP | 0.42 | 0.28 | 0.52 | 0.46 | 0.54 | 0.37 | 0.48 | 0.48 | 0.47 | 0.305 | 0.44 | 0.265 | 0.395 | 0.215 | 0.416666667 | 0.226666667 | 0.464 |
| FDI Net Out | 0.8 | 0.49 | 0.77 | 0.81 | 0.38 | 0.76 | 0.92 | 0.77 | 0.785 | 0.395 | 0.805 | 0.37 | 0.78 | 0.49 | 0.79 | 0.41 | 0.794 |
| FDI Net US$ | 0.81 | 0.29 | 1 | 0.94 | 0.37 | 0.82 | 0.92 | 0.85 | 0.905 | 0.355 | 0.875 | 0.23 | 0.815 | 0.29 | 0.856666667 | 0.25 | 0.852 |
| FDI Outflows % GDP | 0.74 | 0.5 | 0.68 | 0.7 | 0.3 | 0.37 | 0.85 | 0.73 | 0.71 | 0.32 | 0.72 | 0.375 | 0.555 | 0.355 | 0.603333333 | 0.32 | 0.698 |
| Fed Gov Debt | 0.39 | 0.38 | 0.43 | 0.52 | 0.36 | 0.32 | 0.54 | 0.47 | 0.41 | 0.335 | 0.455 | 0.27 | 0.355 | 0.38 | 0.41 | 0.306666667 | 0.334 |
| Fem Married at 18 | 0.39 | 0 | 0.38 | 0.75 | 0.33 | 0.3 | 0.27 | 0.5 | 0.385 | 0 | 0.57 | 0 | 0.345 | 0 | 0.48 | 0 | 0.4625 |
| Female %Pop 25-29 | 0.48 | 0.24 | 0.8 | 0.78 | 0.35 | 0.43 | 0.84 | 0.7 | 0.64 | 0.195 | 0.63 | 0.205 | 0.455 | 0.325 | 0.563333333 | 0.273333333 | 0.686 |
| Female %Pop 55-59 | 0.62 | 0.31 | 0.73 | 0.93 | 0.47 | 0.68 | 0.81 | 0.62 | 0.675 | 0.305 | 0.775 | 0.305 | 0.65 | 0.395 | 0.743333333 | 0.363333333 | 0.682 |
| Female Headed Hsehlds | 0.36 | 0 | 0.15 | 0.25 | 0.3 | 0.36 | 0.25 | 0.08 | 0.255 | 0 | 0.305 | 0 | 0.36 | 0 | 0.323333333 | 0 | 0.253333333 |
| Female Mutilation | 0.03 | 0 | 0 | 0 | 0 | 0.03 | 0 | 0.09 | 0.015 | 0 | 0.015 | 0 | 0.03 | 0 | 0.02 | 0 | 0.01 |
| Female Top Mgr | 0.39 | 0 | 0.33 | 0.38 | 0.22 | 0.36 | 0.26 | 0.29 | 0.36 | 0 | 0.385 | 0 | 0.375 | 0 | 0.376666667 | 0 | 0.3575 |
| Females Out of School | 0.66 | 0.25 | 0.71 | 0.76 | 0.44 | 0.59 | 0.67 | 0.71 | 0.685 | 0.27 | 0.71 | 0.315 | 0.625 | 0.375 | 0.67 | 0.376666667 | 0.594 |
| Fertility Age 15-19 | 0.78 | 0.55 | 0.9 | 0.94 | 0.6 | 0.57 | 1 | 1 | 0.84 | 0.465 | 0.86 | 0.375 | 0.675 | 0.48 | 0.763333333 | 0.386666667 | 0.788 |
| Fertility Rate | 0.68 | 0.5 | 0.82 | 0.82 | 0.47 | 0.49 | 0.76 | 0.6 | 0.75 | 0.36 | 0.75 | 0.305 | 0.585 | 0.5 | 0.663333333 | 0.37 | 0.724 |
| Fertilizer Consumption | 0.67 | 0.42 | 0.46 | 0.47 | 0.31 | 0.24 | 0.42 | 0.81 | 0.565 | 0.285 | 0.57 | 0.3 | 0.455 | 0.285 | 0.46 | 0.25 | 0.532 |
| Fertilizer per Acre | 0.64 | 0.21 | 0.73 | 0.75 | 0.36 | 0.33 | 0.49 | 0.44 | 0.685 | 0.21 | 0.695 | 0.23 | 0.485 | 0.255 | 0.573333333 | 0.253333333 | 0.614 |
| Final | 0.55 | 0.23 | 0.59 | 0.6 | 0.32 | 0.35 | 0.57 | 0.6 | 0.57 | 0.22 | 0.575 | 0.24 | 0.45 | 0.275 | 0.5 | 0.266666667 | 0.536 |
| Financial Account US$ | 0.89 | 0.75 | 0.92 | 0.85 | 0.31 | 0.87 | 0.85 | 0.77 | 0.905 | 0.515 | 0.87 | 0.46 | 0.88 | 0.645 | 0.87 | 0.486666667 | 0.886 |
| Financials % Export | 0.45 | 0.43 | 0.4 | 0.33 | 0.44 | 0.48 | 0.53 | 0.56 | 0.425 | 0.325 | 0.39 | 0.34 | 0.465 | 0.265 | 0.42 | 0.26 | 0.402 |
| Fish Threatened | 0.25 | 0.44 | 0.65 | 0.59 | 0.5 | 0.42 | 0.39 | 0.41 | 0.45 | 0.385 | 0.42 | 0.345 | 0.335 | 0.48 | 0.42 | 0.403333333 | 0.496666667 |
| Fixed Broadband | 0.81 | 0.32 | 0.92 | 1 | 0.57 | 0.52 | 1 | 0.85 | 0.865 | 0.41 | 0.905 | 0.285 | 0.665 | 0.32 | 0.776666667 | 0.296666667 | 0.81 |
| Fixed Phones | 0.65 | 0.28 | 0.85 | 0.92 | 0.43 | 0.54 | 0.92 | 0.8 | 0.75 | 0.255 | 0.785 | 0.265 | 0.595 | 0.315 | 0.703333333 | 0.293333333 | 0.758 |
| Fixed Phones | 0.67 | 0.42 | 0.67 | 0.77 | 0.38 | 0.65 | 0.73 | 0.54 | 0.67 | 0.325 | 0.72 | 0.335 | 0.66 | 0.35 | 0.696666667 | 0.316666667 | 0.674 |
| Food | 0.5 | 0.3 | 0.76 | 0.76 | 0.29 | 0.26 | 0.65 | 0.53 | 0.63 | 0.31 | 0.63 | 0.3 | 0.38 | 0.365 | 0.506666667 | 0.343333333 | 0.636 |
| Food | 0.81 | 0.45 | 0.76 | 0.81 | 0.53 | 0.54 | 0.88 | 0.76 | 0.785 | 0.385 | 0.81 | 0.35 | 0.675 | 0.375 | 0.72 | 0.333333333 | 0.746 |
| Food Exports | 0.57 | 0.31 | 0.56 | 0.62 | 0.41 | 0.57 | 0.65 | 0.59 | 0.565 | 0.405 | 0.595 | 0.305 | 0.57 | 0.25 | 0.586666667 | 0.266666667 | 0.57 |
| Food Index | 0.47 | 0.06 | 0.46 | 0.67 | 0.34 | 0.39 | 0.65 | 0.59 | 0.465 | 0.2 | 0.57 | 0.155 | 0.43 | 0.21 | 0.51 | 0.223333333 | 0.45 |
| Food Insecurity % | 0.91 | 0.3 | 0.93 | 0.93 | 0.6 | 0.52 | 1 | 0.67 | 0.92 | 0.4 | 0.92 | 0.275 | 0.715 | 0.255 | 0.786666667 | 0.253333333 | 0.923333333 |
| Foreign Assets LCU | 0.39 | 0.33 | 0.38 | 0.41 | 0.21 | 0.24 | 0.43 | 0.49 | 0.385 | 0.19 | 0.4 | 0.2 | 0.315 | 0.305 | 0.346666667 | 0.226666667 | 0.356 |
| Forest % land | 0.49 | 0.47 | 0.44 | 0.43 | 0.28 | 0.48 | 0.31 | 0.64 | 0.465 | 0.26 | 0.46 | 0.28 | 0.485 | 0.525 | 0.466666667 | 0.38 | 0.516 |
| Forest %GDP | 0.69 | 0.29 | 0.7 | 0.82 | 0.47 | 0.6 | 0.82 | 0.9 | 0.695 | 0.305 | 0.755 | 0.295 | 0.645 | 0.29 | 0.703333333 | 0.293333333 | 0.728 |
| Forest Depltn | 0.9 | 0.36 | 0.7 | 0.8 | 0.4 | 0.8 | 0.8 | 0.9 | 0.8 | 0.225 | 0.85 | 0.215 | 0.85 | 0.36 | 0.833333333 | 0.263333333 | 0.806 |
| Forest sq kms | 0.58 | 0.32 | 0.34 | 0.35 | 0.53 | 0.43 | 0.21 | 0.68 | 0.46 | 0.25 | 0.465 | 0.245 | 0.505 | 0.385 | 0.453333333 | 0.313333333 | 0.5 |
| Fossil Fuel consumptn | 0.61 | 0.32 | 0.67 | 0.6 | 0.31 | 0.64 | 0.52 | 0.55 | 0.64 | 0.32 | 0.605 | 0.245 | 0.625 | 0.37 | 0.616666667 | 0.303333333 | 0.568 |
| Freshwater per Cap | 0.42 | 0.5 | 0.37 | 0.4 | 0.41 | 0.4 | 0.31 | 0.63 | 0.395 | 0.46 | 0.41 | 0.375 | 0.41 | 0.43 | 0.406666667 | 0.37 | 0.396666667 |
| Freshwater Resources | 0.35 | 0.5 | 0.29 | 0.31 | 0.41 | 0.43 | 0.31 | 0.64 | 0.32 | 0.275 | 0.33 | 0.375 | 0.39 | 0.5 | 0.363333333 | 0.416666667 | 0.316666667 |
| Freshwater Withdrawal Ag. | 0.57 | 0.55 | 0.7 | 0.67 | 0.54 | 0.46 | 0.72 | 0.63 | 0.635 | 0.525 | 0.62 | 0.375 | 0.515 | 0.465 | 0.566666667 | 0.376666667 | 0.646666667 |
| Freshwater Withdrwl | 0.3 | 0.44 | 0.43 | 0.4 | 0.21 | 0.49 | 0.48 | 0.27 | 0.365 | 0.245 | 0.35 | 0.345 | 0.395 | 0.44 | 0.396666667 | 0.376666667 | 0.376666667 |
| Freshwater Withdrwl | 0.35 | 0.47 | 0.54 | 0.55 | 0.25 | 0.36 | 0.31 | 0.34 | 0.445 | 0.445 | 0.45 | 0.36 | 0.355 | 0.425 | 0.42 | 0.366666667 | 0.48 |
| Freshwater Withdrwl | 0.47 | 0.38 | 0.5 | 0.62 | 0.47 | 0.33 | 0.43 | 0.5 | 0.485 | 0.215 | 0.545 | 0.225 | 0.4 | 0.44 | 0.473333333 | 0.316666667 | 0.53 |
| Freshwater Withdrwl | 0.69 | 0.16 | 0.92 | 0.82 | 0.63 | 0.52 | 0.82 | 0.67 | 0.805 | 0.33 | 0.755 | 0.165 | 0.605 | 0.225 | 0.676666667 | 0.206666667 | 0.81 |
| Fuel Imports | 0.56 | 0.26 | 0.53 | 0.46 | 0.47 | 0.41 | 0.53 | 0.47 | 0.545 | 0.34 | 0.51 | 0.28 | 0.485 | 0.31 | 0.476666667 | 0.306666667 | 0.5 |
| GDP $US | 0.73 | 0.75 | 0.69 | 0.85 | 0.44 | 0.92 | 0.77 | 0.62 | 0.71 | 0.515 | 0.79 | 0.565 | 0.825 | 0.71 | 0.833333333 | 0.6 | 0.74 |
| GDP %Growth | 0.56 | 0.47 | 0.59 | 0.66 | 0.35 | 0.31 | 0.51 | 0.59 | 0.575 | 0.26 | 0.61 | 0.36 | 0.435 | 0.57 | 0.51 | 0.463333333 | 0.542 |
| GDP 2010US$ | 0.79 | 0.5 | 0.69 | 0.85 | 0.41 | 0.92 | 0.8 | 0.62 | 0.74 | 0.45 | 0.82 | 0.44 | 0.855 | 0.5 | 0.853333333 | 0.46 | 0.728 |
| GDP ConstLCU | 0.54 | 0.45 | 0.52 | 0.52 | 0.29 | 0.41 | 0.62 | 0.38 | 0.53 | 0.375 | 0.53 | 0.35 | 0.475 | 0.33 | 0.49 | 0.303333333 | 0.532 |
| GDP Deflator | 0.63 | 0.45 | 0.65 | 0.68 | 0.41 | 0.43 | 0.7 | 0.65 | 0.64 | 0.435 | 0.655 | 0.375 | 0.53 | 0.525 | 0.58 | 0.45 | 0.652 |
| GDP Deflator: linked | 0.63 | 0.43 | 0.65 | 0.68 | 0.41 | 0.36 | 0.7 | 0.65 | 0.64 | 0.425 | 0.655 | 0.365 | 0.495 | 0.515 | 0.556666667 | 0.443333333 | 0.616 |
| GDP Growth $10yr | 0.48 | 0.5 | 0.74 | 0.68 | 0.18 | 0.86 | 0.74 | 0.84 | 0.61 | 0.34 | 0.58 | 0.365 | 0.67 | 0.5 | 0.673333333 | 0.41 | 0.668 |
| GDP Growth$/Cap 10yr | 0.86 | 0.5 | 0.74 | 0.86 | 0.32 | 0.42 | 0.94 | 0.92 | 0.8 | 0.355 | 0.86 | 0.365 | 0.64 | 0.56 | 0.713333333 | 0.45 | 0.808 |
| GDP Growth% 10yr | 0.49 | 0.62 | 0.76 | 0.67 | 0.46 | 0.48 | 0.82 | 0.59 | 0.625 | 0.47 | 0.58 | 0.37 | 0.485 | 0.685 | 0.546666667 | 0.496666667 | 0.586 |
| GDP Growth%/Cap 10yr | 0.5 | 0.35 | 0.75 | 0.62 | 0.29 | 0.54 | 0.76 | 0.59 | 0.625 | 0.385 | 0.56 | 0.375 | 0.52 | 0.39 | 0.553333333 | 0.393333333 | 0.622 |
| GDP LCU | 0.54 | 0.35 | 0.43 | 0.42 | 0.29 | 0.39 | 0.52 | 0.5 | 0.485 | 0.28 | 0.48 | 0.3 | 0.465 | 0.275 | 0.45 | 0.266666667 | 0.446 |
| GDP market | 0.61 | 0.33 | 0.49 | 0.49 | 0.29 | 0.33 | 0.46 | 0.5 | 0.55 | 0.27 | 0.55 | 0.29 | 0.47 | 0.27 | 0.476666667 | 0.263333333 | 0.522 |
| GDP per Cap $ | 0.92 | 0.66 | 0.93 | 1 | 0.58 | 0.61 | 1 | 1 | 0.925 | 0.54 | 0.96 | 0.455 | 0.765 | 0.555 | 0.843333333 | 0.453333333 | 0.918 |
| GDP PPP Cap Grth 5yr | 0.6 | 0.24 | 0.62 | 0.5 | 0.57 | 0.62 | 0.44 | 0.43 | 0.61 | 0.235 | 0.55 | 0.18 | 0.61 | 0.265 | 0.573333333 | 0.216666667 | 0.552 |
| GDP-Cap %Growth | 0.29 | 0.54 | 0.59 | 0.45 | 0.44 | 0.48 | 0.43 | 0.44 | 0.44 | 0.48 | 0.37 | 0.37 | 0.385 | 0.495 | 0.406666667 | 0.396666667 | 0.436 |
| GDP-Cap 2010$US | 0.92 | 0.5 | 0.93 | 1 | 0.51 | 0.59 | 1 | 1 | 0.925 | 0.52 | 0.96 | 0.44 | 0.755 | 0.49 | 0.836666667 | 0.453333333 | 0.902 |
| GDP-Cap Const-LCU | 0.44 | 0.21 | 0.46 | 0.56 | 0.35 | 0.3 | 0.56 | 0.5 | 0.45 | 0.415 | 0.5 | 0.295 | 0.37 | 0.365 | 0.433333333 | 0.37 | 0.456 |
| GDP-Cap LCU | 0.33 | 0.2 | 0.5 | 0.49 | 0.37 | 0.44 | 0.53 | 0.53 | 0.415 | 0.41 | 0.41 | 0.29 | 0.385 | 0.375 | 0.42 | 0.376666667 | 0.518 |
| GDP-PPP $int | 0.67 | 0.42 | 0.67 | 0.73 | 0.62 | 0.93 | 0.69 | 0.4 | 0.67 | 0.315 | 0.7 | 0.335 | 0.8 | 0.42 | 0.776666667 | 0.363333333 | 0.654 |
| GDP-PPP $Int | 0.71 | 0.42 | 0.67 | 0.73 | 0.62 | 0.93 | 0.69 | 0.43 | 0.69 | 0.315 | 0.72 | 0.335 | 0.82 | 0.42 | 0.79 | 0.363333333 | 0.64 |
| GDP-PPP/Cap 2011$ | 0.92 | 0.42 | 0.87 | 1 | 0.46 | 0.59 | 1 | 1 | 0.895 | 0.42 | 0.96 | 0.335 | 0.755 | 0.355 | 0.836666667 | 0.32 | 0.904 |
| GDP-PPP/Cap 2011$ | 0.93 | 0.42 | 1 | 1 | 0.57 | 0.55 | 1 | 1 | 0.965 | 0.52 | 0.965 | 0.335 | 0.74 | 0.325 | 0.826666667 | 0.3 | 0.896 |
| GDP-PPP/Cap Int$ | 0.93 | 0.42 | 1 | 1 | 0.57 | 0.51 | 1 | 1 | 0.965 | 0.52 | 0.965 | 0.335 | 0.72 | 0.33 | 0.813333333 | 0.303333333 | 0.918 |
| GNE 2010US$ | 0.81 | 0.3 | 0.67 | 0.83 | 0.5 | 0.88 | 0.8 | 0.67 | 0.74 | 0.3 | 0.82 | 0.34 | 0.845 | 0.34 | 0.84 | 0.353333333 | 0.702 |
| GNE LCU | 0.53 | 0.19 | 0.49 | 0.49 | 0.27 | 0.36 | 0.52 | 0.53 | 0.51 | 0.2 | 0.51 | 0.22 | 0.445 | 0.2 | 0.46 | 0.216666667 | 0.514 |
| GNE US$ | 0.66 | 0.42 | 0.69 | 0.85 | 0.38 | 0.77 | 0.77 | 0.62 | 0.675 | 0.4 | 0.755 | 0.335 | 0.715 | 0.425 | 0.76 | 0.366666667 | 0.696 |
| GNI - LCU | 0.56 | 0.33 | 0.43 | 0.42 | 0.35 | 0.34 | 0.52 | 0.44 | 0.495 | 0.27 | 0.49 | 0.29 | 0.45 | 0.285 | 0.44 | 0.273333333 | 0.514 |
| GNI $US | 0.79 | 0.62 | 0.69 | 0.85 | 0.44 | 0.93 | 0.77 | 0.62 | 0.74 | 0.45 | 0.82 | 0.5 | 0.86 | 0.62 | 0.856666667 | 0.54 | 0.748 |
| GNI Atlas US$ | 0.78 | 0.67 | 0.69 | 0.85 | 0.41 | 0.93 | 0.8 | 0.62 | 0.735 | 0.475 | 0.815 | 0.46 | 0.855 | 0.675 | 0.853333333 | 0.533333333 | 0.732 |
| GNI c2010 $US | 0.74 | 0.88 | 0.71 | 0.86 | 0.44 | 0.725 | 0.58 | 0.8 | 0.565 | 0.74 | 0.88 | 0.8 | 0.565 | 0.728 | |||
| GNI CLCU | 0.46 | 0.42 | 0.53 | 0.47 | 0.32 | 0.34 | 0.56 | 0.41 | 0.495 | 0.36 | 0.465 | 0.335 | 0.4 | 0.35 | 0.423333333 | 0.316666667 | 0.46 |
| GNI Growth % | 0.51 | 0.33 | 0.5 | 0.67 | 0.4 | 0.33 | 0.62 | 0.34 | 0.505 | 0.27 | 0.59 | 0.21 | 0.42 | 0.325 | 0.503333333 | 0.246666667 | 0.46 |
| GNI LCU | 0.69 | 0.41 | 0.43 | 0.42 | 0.35 | 0.41 | 0.52 | 0.5 | 0.56 | 0.31 | 0.555 | 0.33 | 0.55 | 0.305 | 0.506666667 | 0.286666667 | 0.53 |
| GNI per Capita $US | 0.88 | 0.42 | 0.93 | 1 | 0.44 | 0.61 | 1 | 1 | 0.905 | 0.47 | 0.94 | 0.4 | 0.745 | 0.36 | 0.83 | 0.366666667 | 0.872 |
| GNI per Capita $US | 0.92 | 0.42 | 0.93 | 1 | 0.58 | 0.65 | 1 | 1 | 0.925 | 0.52 | 0.96 | 0.4 | 0.785 | 0.39 | 0.856666667 | 0.386666667 | 0.868 |
| GNI per Capita % | 0.51 | 0.28 | 0.37 | 0.33 | 0.21 | 0.51 | 0.47 | 0.34 | 0.44 | 0.265 | 0.42 | 0.24 | 0.51 | 0.33 | 0.45 | 0.286666667 | 0.41 |
| GNI per Capita cLCU | 0.34 | 0.28 | 0.41 | 0.53 | 0.32 | 0.43 | 0.56 | 0.53 | 0.375 | 0.45 | 0.435 | 0.33 | 0.385 | 0.345 | 0.433333333 | 0.356666667 | 0.382 |
| GNI per Capita LCU | 0.41 | 0.2 | 0.5 | 0.49 | 0.37 | 0.31 | 0.59 | 0.47 | 0.455 | 0.41 | 0.45 | 0.29 | 0.36 | 0.34 | 0.403333333 | 0.353333333 | 0.498 |
| GNI per Capita PPP | 0.88 | 0.34 | 1 | 1 | 0.57 | 0.51 | 1 | 1 | 0.94 | 0.48 | 0.94 | 0.295 | 0.695 | 0.285 | 0.796666667 | 0.273333333 | 0.902 |
| GNI/Cap PPP 2017$ | 0.93 | 0.41 | 1 | 1 | 0.57 | 0.55 | 1 | 1 | 0.965 | 0.515 | 0.965 | 0.33 | 0.74 | 0.32 | 0.826666667 | 0.296666667 | 0.894 |
| GNI-PPP | 0.67 | 0.42 | 0.6 | 0.67 | 0.56 | 0.88 | 0.69 | 0.44 | 0.635 | 0.315 | 0.67 | 0.335 | 0.775 | 0.42 | 0.74 | 0.363333333 | 0.636 |
| GNI-PPP | 0.71 | 0.42 | 0.6 | 0.67 | 0.56 | 0.93 | 0.69 | 0.43 | 0.655 | 0.315 | 0.69 | 0.335 | 0.82 | 0.44 | 0.77 | 0.376666667 | 0.644 |
| Gold Production | 0.39 | 0 | 0.38 | 0.56 | 0.38 | 0.02 | 0.42 | 0.5 | 0.385 | 0 | 0.475 | 0 | 0.205 | 0 | 0.323333333 | 0 | 0.443333333 |
| Goods Exports | 0.71 | 0.62 | 0.8 | 0.81 | 0.56 | 1 | 0.85 | 0.69 | 0.755 | 0.5 | 0.76 | 0.435 | 0.855 | 0.63 | 0.84 | 0.503333333 | 0.736 |
| Government Debt | 0.5 | 0.25 | 0.39 | 0.31 | 0.31 | 0.33 | 0.33 | 0.41 | 0.445 | 0.27 | 0.405 | 0.205 | 0.415 | 0.175 | 0.38 | 0.17 | 0.306 |
| Government Effectiveness | 0.77 | 0.42 | 0.92 | 0.94 | 0.65 | 0.6 | 1 | 1 | 0.845 | 0.35 | 0.855 | 0.365 | 0.685 | 0.39 | 0.77 | 0.363333333 | 0.7375 |
| Govmt Reg. Time | 0.36 | 0 | 0.2 | 0.43 | 0.18 | 0.31 | 0.32 | 0.24 | 0.28 | 0 | 0.395 | 0 | 0.335 | 0 | 0.366666667 | 0 | 0.38 |
| Govt consumption | 0.88 | 0.3 | 0.71 | 0.83 | 0.47 | 0.88 | 0.8 | 0.67 | 0.795 | 0.36 | 0.855 | 0.34 | 0.88 | 0.36 | 0.863333333 | 0.366666667 | 0.766 |
| Govt consumptn %GDP | 0.51 | 0.28 | 0.56 | 0.61 | 0.37 | 0.43 | 0.46 | 0.57 | 0.535 | 0.515 | 0.56 | 0.265 | 0.47 | 0.32 | 0.516666667 | 0.296666667 | 0.53 |
| Govt Consumptn cLCU | 0.43 | 0.3 | 0.4 | 0.42 | 0.34 | 0.4 | 0.46 | 0.53 | 0.415 | 0.3 | 0.425 | 0.275 | 0.415 | 0.22 | 0.416666667 | 0.23 | 0.446 |
| Govt Consumptn LCU | 0.55 | 0.21 | 0.67 | 0.63 | 0.26 | 0.3 | 0.59 | 0.43 | 0.61 | 0.13 | 0.59 | 0.19 | 0.425 | 0.265 | 0.493333333 | 0.233333333 | 0.562 |
| Govt consumptn US$ | 0.82 | 0.62 | 0.8 | 0.85 | 0.44 | 0.82 | 0.87 | 0.62 | 0.81 | 0.52 | 0.835 | 0.5 | 0.82 | 0.515 | 0.83 | 0.47 | 0.794 |
| Govt. Spend on Families | 0.5 | 0.43 | 0.62 | 0.38 | 0.63 | 0.45 | 0.25 | 0.38 | 0.56 | 0.465 | 0.44 | 0.285 | 0.475 | 0.365 | 0.443333333 | 0.29 | 0.44 |
| Grade 1 Female | 0.74 | 0.38 | 0.42 | 0.57 | 0.47 | 0.39 | 0.47 | 0.58 | 0.58 | 0.38 | 0.655 | 0.39 | 0.565 | 0.33 | 0.566666667 | 0.353333333 | 0.53 |
| Grade 1 Intake All | 0.61 | 0.38 | 0.53 | 0.64 | 0.34 | 0.39 | 0.5 | 0.58 | 0.57 | 0.355 | 0.625 | 0.39 | 0.5 | 0.33 | 0.546666667 | 0.353333333 | 0.5225 |
| Grade 1 Male | 0.42 | 0.38 | 0.4 | 0.53 | 0.4 | 0.39 | 0.43 | 0.5 | 0.41 | 0.355 | 0.475 | 0.39 | 0.405 | 0.33 | 0.446666667 | 0.353333333 | 0.395 |
| Grade 5 % Female | 0.71 | 0.15 | 0.75 | 0.83 | 0.41 | 0.48 | 0.86 | 0.67 | 0.73 | 0.21 | 0.77 | 0.085 | 0.595 | 0.165 | 0.673333333 | 0.116666667 | 0.738 |
| Grants - Technical | 0.41 | 0.18 | 0.27 | 0.39 | 0.21 | 0.7 | 0.49 | 0.6 | 0.34 | 0.09 | 0.4 | 0.09 | 0.555 | 0.34 | 0.5 | 0.226666667 | 0.342 |
| Grants US$ | 0.7 | 0.4 | 0.49 | 0.6 | 0.29 | 0.62 | 0.56 | 0.7 | 0.595 | 0.2 | 0.65 | 0.2 | 0.66 | 0.46 | 0.64 | 0.306666667 | 0.534 |
| Greenhouse emissions | 0.39 | 0.28 | 0.38 | 0.43 | 0.5 | 0.44 | 0.38 | 0.48 | 0.385 | 0.255 | 0.41 | 0.265 | 0.415 | 0.235 | 0.42 | 0.24 | 0.434 |
| Greenhouse emissions | 0.4 | 0.17 | 0.68 | 0.67 | 0.47 | 0.58 | 0.67 | 0.43 | 0.54 | 0.285 | 0.535 | 0.21 | 0.49 | 0.21 | 0.55 | 0.223333333 | 0.5525 |
| Greenhouse emissions | 0.47 | 0.06 | 0.33 | 0.53 | 0.38 | 0.43 | 0.52 | 0.36 | 0.4 | 0.125 | 0.5 | 0.13 | 0.45 | 0.095 | 0.476666667 | 0.13 | 0.4525 |
| Greenhouse emissions | 0.72 | 0.55 | 0.47 | 0.52 | 0.31 | 0.82 | 0.52 | 0.38 | 0.595 | 0.38 | 0.62 | 0.43 | 0.77 | 0.585 | 0.686666667 | 0.493333333 | 0.564 |
| Gross Saving US$ | 0.65 | 0.4 | 0.73 | 0.8 | 0.3 | 0.94 | 0.85 | 0.67 | 0.69 | 0.35 | 0.725 | 0.39 | 0.795 | 0.51 | 0.796666667 | 0.466666667 | 0.7 |
| Gross Savings | 0.8 | 0.5 | 0.53 | 0.34 | 0.38 | 0.59 | 0.69 | 0.36 | 0.665 | 0.56 | 0.57 | 0.375 | 0.695 | 0.425 | 0.576666667 | 0.366666667 | 0.504 |
| Gross Savings %GDP | 0.7 | 0.54 | 0.6 | 0.41 | 0.44 | 0.55 | 0.6 | 0.41 | 0.65 | 0.54 | 0.555 | 0.395 | 0.625 | 0.445 | 0.553333333 | 0.38 | 0.52 |
| Gross Savings LCU | 0.43 | 0.35 | 0.4 | 0.33 | 0.34 | 0.36 | 0.62 | 0.44 | 0.415 | 0.325 | 0.38 | 0.3 | 0.395 | 0.375 | 0.373333333 | 0.333333333 | 0.352 |
| Gross Spending %GDP | 1 | 0.89 | 0.82 | 0.68 | 0.41 | 0.41 | 0.71 | 0.65 | 0.91 | 0.655 | 0.84 | 0.49 | 0.705 | 0.665 | 0.696666667 | 0.473333333 | 0.678 |
| Gross VA CLCU | 0.46 | 0.32 | 0.46 | 0.46 | 0.3 | 0.28 | 0.57 | 0.53 | 0.46 | 0.265 | 0.46 | 0.285 | 0.37 | 0.33 | 0.4 | 0.303333333 | 0.484 |
| Gross VA Cost US$ | 0.73 | 0.4 | 0.77 | 0.85 | 0.43 | 0.87 | 0.71 | 0.69 | 0.75 | 0.405 | 0.79 | 0.39 | 0.8 | 0.47 | 0.816666667 | 0.44 | 0.742 |
| Gross Value Add US$ | 0.82 | 0.5 | 0.75 | 0.83 | 0.47 | 0.93 | 0.75 | 0.67 | 0.785 | 0.39 | 0.825 | 0.375 | 0.875 | 0.46 | 0.86 | 0.39 | 0.736 |
| Gun Homicides | 0.78 | 0.52 | 0.93 | 0.75 | 0.75 | 0.41 | 0.79 | 0.61 | 0.855 | 0.47 | 0.765 | 0.28 | 0.595 | 0.4 | 0.646666667 | 0.28 | 0.82 |
| HDI Human Development | 0.83 | 0.38 | 0.93 | 1 | 0.56 | 0.39 | 1 | 0.92 | 0.88 | 0.4 | 0.915 | 0.315 | 0.61 | 0.34 | 0.74 | 0.31 | 0.742 |
| Health Spending % | 0.48 | 0.28 | 0.71 | 0.67 | 0.33 | 0.36 | 0.57 | 0.4 | 0.595 | 0.28 | 0.575 | 0.265 | 0.42 | 0.29 | 0.503333333 | 0.276666667 | 0.585 |
| HFC Emissions | 0.65 | 0.5 | 0.62 | 0.56 | 0.46 | 0.65 | 0.6 | 0.66 | 0.635 | 0.46 | 0.605 | 0.365 | 0.65 | 0.44 | 0.62 | 0.37 | 0.61 |
| High Income Imports | 0.48 | 0.3 | 0.8 | 0.8 | 0.58 | 0.37 | 0.79 | 0.73 | 0.64 | 0.525 | 0.64 | 0.25 | 0.425 | 0.33 | 0.55 | 0.286666667 | 0.608 |
| HIV | 0.44 | 0 | 0.45 | 0.55 | 0.4 | 0.53 | 0.31 | 0.32 | 0.445 | 0 | 0.495 | 0 | 0.485 | 0 | 0.506666667 | 0 | 0.454 |
| HIV ages 15-24 | 0.15 | 0 | 0.5 | 0.5 | 0.39 | 0.3 | 0.33 | 0.25 | 0.325 | 0 | 0.325 | 0 | 0.225 | 0 | 0.316666667 | 0 | 0.362 |
| HIV per 1,000 | 0.24 | 0 | 0.53 | 0.59 | 0.41 | 0.25 | 0.38 | 0.3 | 0.385 | 0 | 0.415 | 0 | 0.245 | 0 | 0.36 | 0 | 0.442 |
| Home Ownership | 0.42 | 0.45 | 0.39 | 0.42 | 0.39 | 0.33 | 0.64 | 0.56 | 0.405 | 0.375 | 0.42 | 0.35 | 0.375 | 0.415 | 0.39 | 0.36 | 0.41 |
| Home Price2Income | 0.25 | 0.36 | 0.27 | 0.41 | 0.29 | 0.45 | 0.62 | 0.53 | 0.26 | 0.225 | 0.33 | 0.205 | 0.35 | 0.33 | 0.37 | 0.236666667 | 0.3025 |
| Home Price2Rent | 0.36 | 0.36 | 0.33 | 0.21 | 0.2 | 0.36 | 0.16 | 0.17 | 0.345 | 0.325 | 0.285 | 0.265 | 0.36 | 0.33 | 0.31 | 0.276666667 | 0.315 |
| Homelessness | 0.59 | 0.11 | 0.83 | 0.92 | 0.39 | 0.37 | 0.82 | 0.64 | 0.71 | 0.18 | 0.755 | 0.115 | 0.48 | 0.24 | 0.626666667 | 0.2 | 0.78 |
| Homicide | 0.69 | 0.56 | 0.76 | 0.88 | 0.47 | 0.49 | 0.94 | 0.8 | 0.725 | 0.54 | 0.785 | 0.43 | 0.59 | 0.475 | 0.686666667 | 0.416666667 | 0.708 |
| Household | 0.48 | 0.4 | 0.64 | 0.67 | 0.45 | 0.83 | 0.67 | 0.4 | 0.56 | 0.315 | 0.575 | 0.325 | 0.655 | 0.45 | 0.66 | 0.383333333 | 0.56 |
| Household Consumptn | 0.55 | 0.35 | 0.67 | 0.67 | 0.28 | 0.35 | 0.63 | 0.6 | 0.61 | 0.28 | 0.61 | 0.3 | 0.45 | 0.32 | 0.523333333 | 0.296666667 | 0.604 |
| Household Consumptn | 0.61 | 0.42 | 0.62 | 0.77 | 0.41 | 0.79 | 0.69 | 0.54 | 0.615 | 0.35 | 0.69 | 0.335 | 0.7 | 0.33 | 0.723333333 | 0.303333333 | 0.648 |
| Household Consumptn | 0.69 | 0.55 | 0.57 | 0.73 | 0.5 | 0.82 | 0.69 | 0.57 | 0.63 | 0.415 | 0.71 | 0.43 | 0.755 | 0.39 | 0.746666667 | 0.363333333 | 0.642 |
| Household Debt | 0.55 | 0.15 | 1 | 0.88 | 0.48 | 0.31 | 1 | 0.9 | 0.775 | 0.265 | 0.715 | 0.2 | 0.43 | 0.19 | 0.58 | 0.21 | 0.694 |
| Household spend PPP | 0.55 | 0.36 | 0.6 | 0.57 | 0.49 | 0.83 | 0.69 | 0.56 | 0.575 | 0.295 | 0.56 | 0.305 | 0.69 | 0.355 | 0.65 | 0.32 | 0.564 |
| Household/Cap US$ | 0.88 | 0.45 | 0.92 | 1 | 0.48 | 0.62 | 1 | 1 | 0.9 | 0.375 | 0.94 | 0.34 | 0.75 | 0.46 | 0.833333333 | 0.383333333 | 0.856 |
| Housing Bubbles | 0.24 | 0.36 | 0.15 | 0.15 | 0.32 | 0.55 | 0.25 | 0.35 | 0.195 | 0.325 | 0.195 | 0.25 | 0.395 | 0.395 | 0.313333333 | 0.31 | 0.1725 |
| Hsehld Consumption | 0.48 | 0.32 | 0.43 | 0.36 | 0.32 | 0.39 | 0.31 | 0.44 | 0.455 | 0.265 | 0.42 | 0.285 | 0.435 | 0.25 | 0.41 | 0.25 | 0.436 |
| Hsld Consumption | 0.42 | 0.23 | 0.46 | 0.49 | 0.44 | 0.36 | 0.69 | 0.43 | 0.44 | 0.305 | 0.455 | 0.215 | 0.39 | 0.345 | 0.423333333 | 0.296666667 | 0.426 |
| Human Capital Idx | 0.81 | 0.31 | 0.93 | 0.93 | 0.57 | 0.46 | 1 | 0.92 | 0.87 | 0.365 | 0.87 | 0.19 | 0.635 | 0.305 | 0.733333333 | 0.226666667 | 0.89 |
| Hydro Electricity | 0.48 | 0.28 | 0.59 | 0.6 | 0.46 | 0.35 | 0.58 | 0.68 | 0.535 | 0.31 | 0.54 | 0.265 | 0.415 | 0.275 | 0.476666667 | 0.266666667 | 0.574 |
| IBRD Loans Credits | 0.19 | 0 | 0.25 | 0.31 | 0.2 | 0.5 | 0.38 | 0.25 | 0.22 | 0 | 0.25 | 0 | 0.345 | 0 | 0.333333333 | 0 | 0.36 |
| IBRD PPG | 0.29 | 0 | 0.45 | 0.46 | 0.25 | 0.44 | 0.22 | 0.21 | 0.37 | 0 | 0.375 | 0 | 0.365 | 0 | 0.396666667 | 0 | 0.426 |
| ICT Goods Import %tot | 0.59 | 0.41 | 0.6 | 0.63 | 0.19 | 0.55 | 0.69 | 0.5 | 0.595 | 0.295 | 0.61 | 0.32 | 0.57 | 0.42 | 0.59 | 0.356666667 | 0.59 |
| IDA PPG | 0.31 | 0 | 0.31 | 0.46 | 0.25 | 0.43 | 0.38 | 0.12 | 0.31 | 0 | 0.385 | 0 | 0.37 | 0 | 0.4 | 0 | 0.376 |
| IMF Charges | 0.35 | 0 | 0.33 | 0.5 | 0.25 | 0.47 | 0.38 | 0.22 | 0.34 | 0 | 0.425 | 0 | 0.41 | 0 | 0.44 | 0 | 0.452 |
| IMF Credit | 0.47 | 0 | 0.21 | 0.36 | 0.13 | 0.32 | 0.31 | 0.13 | 0.34 | 0 | 0.415 | 0 | 0.395 | 0 | 0.383333333 | 0 | 0.362 |
| IMF Finance Index | 0.84 | 0.4 | 0.83 | 0.92 | 0.54 | 0.55 | 1 | 0.92 | 0.835 | 0.4 | 0.88 | 0.39 | 0.695 | 0.34 | 0.77 | 0.353333333 | 0.694 |
| Immigration | 0.67 | 0.35 | 0.67 | 0.81 | 0.5 | 0.75 | 0.73 | 0.8 | 0.67 | 0.445 | 0.74 | 0.425 | 0.71 | 0.505 | 0.743333333 | 0.503333333 | 0.716666667 |
| Immuniz 12-23 | 0.35 | 0.15 | 0.62 | 0.52 | 0.46 | 0.46 | 0.53 | 0.43 | 0.485 | 0.36 | 0.435 | 0.22 | 0.405 | 0.265 | 0.443333333 | 0.273333333 | 0.494 |
| Import Cost $US | 0.57 | 0.29 | 0.83 | 0.83 | 0.59 | 0.52 | 0.83 | 0.55 | 0.7 | 0.255 | 0.7 | 0.155 | 0.545 | 0.275 | 0.64 | 0.19 | 0.743333333 |
| Import Cost Border | 0.51 | 0.21 | 0.79 | 0.71 | 0.54 | 0.48 | 0.71 | 0.49 | 0.65 | 0.21 | 0.61 | 0.13 | 0.495 | 0.215 | 0.566666667 | 0.16 | 0.67 |
| Import goods srvs pri income | 0.88 | 0.62 | 0.8 | 0.85 | 0.44 | 0.93 | 0.85 | 0.77 | 0.84 | 0.5 | 0.865 | 0.435 | 0.905 | 0.56 | 0.886666667 | 0.456666667 | 0.778 |
| Import Index | 0.39 | 0.41 | 0.59 | 0.56 | 0.53 | 0.45 | 0.76 | 0.47 | 0.49 | 0.415 | 0.475 | 0.305 | 0.42 | 0.485 | 0.466666667 | 0.39 | 0.508 |
| Import lead time | 0.54 | 0 | 0.52 | 0.52 | 0.25 | 0.23 | 0.53 | 0.54 | 0.53 | 0 | 0.53 | 0 | 0.385 | 0.19 | 0.43 | 0.126666667 | 0.46 |
| Import Time at Border (hrs) | 0.73 | 0.39 | 0.85 | 0.75 | 0.6 | 0.71 | 0.85 | 0.65 | 0.79 | 0.195 | 0.74 | 0.195 | 0.72 | 0.39 | 0.73 | 0.26 | 0.776666667 |
| Import Value | 0.35 | 0.24 | 0.4 | 0.52 | 0.35 | 0.54 | 0.7 | 0.71 | 0.375 | 0.28 | 0.435 | 0.235 | 0.445 | 0.4 | 0.47 | 0.343333333 | 0.482 |
| Imports %GDP | 0.42 | 0.31 | 0.41 | 0.55 | 0.38 | 0.54 | 0.44 | 0.41 | 0.415 | 0.18 | 0.485 | 0.215 | 0.48 | 0.38 | 0.503333333 | 0.293333333 | 0.44 |
| Imports %Growth | 0.43 | 0.35 | 0.43 | 0.43 | 0.38 | 0.53 | 0.4 | 0.4 | 0.43 | 0.24 | 0.43 | 0.275 | 0.48 | 0.25 | 0.463333333 | 0.233333333 | 0.466 |
| Imports 2010US$ | 0.88 | 0.5 | 0.73 | 0.83 | 0.5 | 0.83 | 0.85 | 0.69 | 0.805 | 0.4 | 0.855 | 0.375 | 0.855 | 0.54 | 0.846666667 | 0.443333333 | 0.804 |
| Imports by Economy | 0.41 | 0.42 | 0.4 | 0.26 | 0.44 | 0.36 | 0.34 | 0.31 | 0.405 | 0.4 | 0.335 | 0.335 | 0.385 | 0.48 | 0.343333333 | 0.403333333 | 0.366 |
| Imports C-LCU | 0.53 | 0.67 | 0.34 | 0.53 | 0.34 | 0.25 | 0.4 | 0.53 | 0.435 | 0.545 | 0.53 | 0.46 | 0.39 | 0.6 | 0.436666667 | 0.483333333 | 0.508 |
| Imports Goods | 0.88 | 0.5 | 0.73 | 0.85 | 0.5 | 0.93 | 0.85 | 0.69 | 0.805 | 0.4 | 0.865 | 0.375 | 0.905 | 0.425 | 0.886666667 | 0.366666667 | 0.764 |
| Imports Goods Serv | 0.88 | 0.5 | 0.87 | 0.87 | 0.5 | 0.93 | 0.85 | 0.69 | 0.875 | 0.44 | 0.875 | 0.375 | 0.905 | 0.46 | 0.893333333 | 0.39 | 0.796 |
| Imports LCU | 0.42 | 0.45 | 0.37 | 0.63 | 0.29 | 0.41 | 0.62 | 0.47 | 0.395 | 0.4 | 0.525 | 0.35 | 0.415 | 0.405 | 0.486666667 | 0.353333333 | 0.41 |
| Imports low-mid in Region | 0.34 | 0 | 0.29 | 0.21 | 0.27 | 0.5 | 0.2 | 0.13 | 0.315 | 0 | 0.275 | 0 | 0.42 | 0 | 0.35 | 0 | 0.29 |
| Imports Low-Mid Mid East | 0.56 | 0.32 | 0.65 | 0.46 | 0.41 | 0.56 | 0.62 | 0.31 | 0.605 | 0.31 | 0.51 | 0.285 | 0.56 | 0.41 | 0.526666667 | 0.356666667 | 0.528 |
| Imports Low-Mid S. Aftrica | 0.55 | 0.53 | 0.62 | 0.62 | 0.41 | 0.43 | 0.69 | 0.5 | 0.585 | 0.355 | 0.585 | 0.365 | 0.49 | 0.505 | 0.533333333 | 0.403333333 | 0.564 |
| Imports Low-Mid S.Asia | 0.69 | 0.33 | 0.6 | 0.57 | 0.44 | 0.43 | 0.51 | 0.52 | 0.645 | 0.29 | 0.63 | 0.29 | 0.56 | 0.245 | 0.563333333 | 0.246666667 | 0.67 |
| Imports Low-Mid-Inc Asia | 0.42 | 0.25 | 0.58 | 0.52 | 0.38 | 0.56 | 0.53 | 0.53 | 0.5 | 0.285 | 0.47 | 0.315 | 0.49 | 0.32 | 0.5 | 0.34 | 0.518 |
| Imports Low-Mid-Inc Europe | 0.59 | 0.41 | 0.56 | 0.5 | 0.51 | 0.5 | 0.46 | 0.42 | 0.575 | 0.32 | 0.545 | 0.305 | 0.545 | 0.515 | 0.53 | 0.41 | 0.488 |
| Imports Low-Mid-Inc Latin | 0.28 | 0.56 | 0.62 | 0.69 | 0.35 | 0.41 | 0.59 | 0.47 | 0.45 | 0.49 | 0.485 | 0.405 | 0.345 | 0.515 | 0.46 | 0.426666667 | 0.466 |
| Imports Merch | 0.61 | 0.29 | 0.59 | 0.49 | 0.41 | 0.25 | 0.52 | 0.34 | 0.6 | 0.445 | 0.55 | 0.245 | 0.43 | 0.325 | 0.45 | 0.283333333 | 0.516 |
| Imports Merch US$ | 0.93 | 0.53 | 0.69 | 0.85 | 0.5 | 0.93 | 0.85 | 0.62 | 0.81 | 0.405 | 0.89 | 0.39 | 0.93 | 0.515 | 0.903333333 | 0.426666667 | 0.784 |
| Imports Service | 0.82 | 0.42 | 0.93 | 0.93 | 0.32 | 0.95 | 0.92 | 0.73 | 0.875 | 0.4 | 0.875 | 0.335 | 0.885 | 0.52 | 0.9 | 0.43 | 0.846 |
| Imports US$ | 0.87 | 0.88 | 0.8 | 0.87 | 0.56 | 0.92 | 0.85 | 0.69 | 0.835 | 0.59 | 0.87 | 0.565 | 0.895 | 0.69 | 0.886666667 | 0.543333333 | 0.81 |
| Incarceration Rates | 0.51 | 0.6 | 0.43 | 0.52 | 0.53 | 0.39 | 0.4 | 0.29 | 0.47 | 0.55 | 0.515 | 0.425 | 0.45 | 0.565 | 0.473333333 | 0.46 | 0.4875 |
| Income | 0.63 | 0.62 | 0.92 | 0.82 | 1 | 0.36 | 0.91 | 0.6 | 0.775 | 0.62 | 0.725 | 0.435 | 0.495 | 0.41 | 0.603333333 | 0.356666667 | 0.632 |
| Income % Growth | 0.47 | 0.26 | 0.43 | 0.4 | 0.43 | 0.49 | 0.62 | 0.47 | 0.45 | 0.245 | 0.435 | 0.23 | 0.48 | 0.355 | 0.453333333 | 0.303333333 | 0.472 |
| Income 4th 20% | 0.58 | 0.44 | 0.88 | 0.94 | 0.5 | 0.43 | 0.73 | 0.55 | 0.73 | 0.34 | 0.76 | 0.355 | 0.505 | 0.32 | 0.65 | 0.303333333 | 0.7 |
| Income Equality GINI | 0.51 | 0.58 | 0.8 | 0.74 | 0.9 | 0.33 | 0.71 | 0.5 | 0.655 | 0.6 | 0.625 | 0.415 | 0.42 | 0.39 | 0.526666667 | 0.343333333 | 0.628 |
| Income High 20% | 0.51 | 0.5 | 0.88 | 0.8 | 0.9 | 0.33 | 0.65 | 0.6 | 0.695 | 0.625 | 0.655 | 0.44 | 0.42 | 0.35 | 0.546666667 | 0.36 | 0.666 |
| Income Low 10% | 0.36 | 0 | 0.86 | 0.43 | 1 | 0.34 | 0.49 | 0.38 | 0.61 | 0 | 0.395 | 0 | 0.35 | 0.145 | 0.376666667 | 0.096666667 | 0.574 |
| Income Lowest 20% | 0.49 | 0 | 0.91 | 0.67 | 1 | 0.33 | 0.6 | 0.5 | 0.7 | 0 | 0.58 | 0 | 0.41 | 0.145 | 0.496666667 | 0.096666667 | 0.622 |
| Income Lowest 40% | 0.51 | 0.5 | 0.92 | 0.76 | 1 | 0.36 | 0.69 | 0.43 | 0.715 | 0.625 | 0.635 | 0.375 | 0.435 | 0.35 | 0.543333333 | 0.316666667 | 0.658 |
| Income of 3rd 20% | 0.53 | 0.5 | 0.89 | 1 | 0.78 | 0.33 | 0.8 | 0.58 | 0.71 | 0.585 | 0.765 | 0.44 | 0.43 | 0.35 | 0.62 | 0.36 | 0.632 |
| Income Paymts | 0.76 | 0.61 | 0.77 | 0.85 | 0.34 | 0.77 | 0.92 | 0.85 | 0.765 | 0.495 | 0.805 | 0.495 | 0.765 | 0.57 | 0.793333333 | 0.506666667 | 0.74 |
| Income per Capita | 0.85 | 0.53 | 0.93 | 1 | 0.48 | 0.57 | 1 | 1 | 0.89 | 0.535 | 0.925 | 0.455 | 0.71 | 0.445 | 0.806666667 | 0.423333333 | 0.86 |
| Income per Capita | 0.93 | 0.39 | 0.93 | 1 | 0.64 | 0.52 | 1 | 1 | 0.93 | 0.405 | 0.965 | 0.32 | 0.725 | 0.34 | 0.816666667 | 0.31 | 0.908 |
| Income Taxes %rev | 0.57 | 0.2 | 0.47 | 0.45 | 0.49 | 0.37 | 0.48 | 0.52 | 0.52 | 0.135 | 0.51 | 0.19 | 0.47 | 0.29 | 0.463333333 | 0.253333333 | 0.506 |
| Income Taxes %tax | 0.5 | 0.36 | 0.51 | 0.68 | 0.22 | 0.44 | 0.56 | 0.51 | 0.505 | 0.36 | 0.59 | 0.315 | 0.47 | 0.33 | 0.54 | 0.31 | 0.544 |
| Income Taxes LCU | 0.42 | 0.27 | 0.6 | 0.35 | 0.27 | 0.44 | 0.42 | 0.67 | 0.51 | 0.34 | 0.385 | 0.26 | 0.43 | 0.235 | 0.403333333 | 0.24 | 0.432 |
| Income Top-10% | 0.57 | 0.56 | 0.94 | 0.87 | 0.9 | 0.33 | 0.76 | 0.6 | 0.755 | 0.545 | 0.72 | 0.405 | 0.45 | 0.38 | 0.59 | 0.336666667 | 0.672 |
| Income under 50% | 0.53 | 0.47 | 0.49 | 0.48 | 0.8 | 0.26 | 0.56 | 0.31 | 0.51 | 0.52 | 0.505 | 0.36 | 0.395 | 0.37 | 0.423333333 | 0.33 | 0.536 |
| Income/Cap Growth | 0.43 | 0.38 | 0.5 | 0.48 | 0.34 | 0.72 | 0.5 | 0.4 | 0.465 | 0.215 | 0.455 | 0.25 | 0.575 | 0.415 | 0.543333333 | 0.316666667 | 0.448 |
| Income/Capita | 0.82 | 0.53 | 1 | 0.88 | 0.48 | 0.59 | 1 | 1 | 0.91 | 0.575 | 0.85 | 0.39 | 0.705 | 0.365 | 0.763333333 | 0.326666667 | 0.9 |
| Industry %GDP | 0.73 | 0.58 | 0.25 | 0.42 | 0.28 | 0.37 | 0.36 | 0.48 | 0.49 | 0.405 | 0.575 | 0.375 | 0.55 | 0.525 | 0.506666667 | 0.406666667 | 0.464 |
| Industry c2010 US$ | 0.81 | 0.32 | 0.67 | 0.87 | 0.5 | 0.93 | 0.8 | 0.67 | 0.74 | 0.32 | 0.84 | 0.285 | 0.87 | 0.35 | 0.87 | 0.316666667 | 0.726 |
| Industry US$ | 0.79 | 0.42 | 0.62 | 0.87 | 0.34 | 1 | 0.77 | 0.6 | 0.705 | 0.35 | 0.83 | 0.335 | 0.895 | 0.585 | 0.886666667 | 0.473333333 | 0.708 |
| Infant Deaths | 0.55 | 0.42 | 0.7 | 0.74 | 0.41 | 0.84 | 0.6 | 0.8 | 0.625 | 0.315 | 0.645 | 0.325 | 0.695 | 0.335 | 0.71 | 0.3 | 0.58 |
| Infant Deaths | 0.71 | 0.36 | 0.9 | 0.9 | 0.6 | 0.57 | 0.9 | 0.9 | 0.805 | 0.415 | 0.805 | 0.285 | 0.64 | 0.33 | 0.726666667 | 0.29 | 0.774 |
| Inflation % | 0.32 | 0.37 | 0.69 | 0.67 | 0.44 | 0.41 | 0.62 | 0.56 | 0.505 | 0.395 | 0.495 | 0.335 | 0.365 | 0.29 | 0.466666667 | 0.293333333 | 0.518 |
| Inflation GDP deflator % | 0.49 | 0.46 | 0.47 | 0.51 | 0.19 | 0.45 | 0.47 | 0.6 | 0.48 | 0.44 | 0.5 | 0.29 | 0.47 | 0.395 | 0.483333333 | 0.303333333 | 0.5 |
| Inflation, GDP deflator | 0.36 | 0.34 | 0.47 | 0.51 | 0.21 | 0.37 | 0.46 | 0.5 | 0.415 | 0.38 | 0.435 | 0.23 | 0.365 | 0.335 | 0.413333333 | 0.263333333 | 0.478 |
| Informal | 0.33 | 0 | 0.36 | 0.39 | 0.32 | 0.31 | 0.38 | 0.18 | 0.345 | 0 | 0.36 | 0 | 0.32 | 0 | 0.343333333 | 0 | 0.315 |
| Inheritance Tax | 0.22 | 0.31 | 0.07 | 0.12 | 0.2 | 0.3 | 0.16 | 0.31 | 0.145 | 0.185 | 0.17 | 0.225 | 0.26 | 0.31 | 0.213333333 | 0.253333333 | 0.136666667 |
| Injury Deaths % | 0.6 | 0.28 | 0.82 | 0.75 | 0.47 | 0.41 | 0.82 | 0.59 | 0.71 | 0.285 | 0.675 | 0.175 | 0.505 | 0.285 | 0.586666667 | 0.213333333 | 0.723333333 |
| Innovation Index | 0.72 | 0.27 | 0.78 | 0.82 | 0.54 | 0.49 | 1 | 0.9 | 0.75 | 0.385 | 0.77 | 0.235 | 0.605 | 0.28 | 0.676666667 | 0.253333333 | 0.773333333 |
| Insur & Finl Srvc %ServImp | 0.33 | 0.33 | 0.37 | 0.4 | 0.35 | 0.34 | 0.4 | 0.38 | 0.35 | 0.27 | 0.365 | 0.25 | 0.335 | 0.4 | 0.356666667 | 0.323333333 | 0.328 |
| Insurance % | 0.39 | 0.11 | 0.4 | 0.48 | 0.27 | 0.39 | 0.5 | 0.37 | 0.395 | 0.065 | 0.435 | 0.06 | 0.39 | 0.245 | 0.42 | 0.166666667 | 0.435 |
| Insurance Financial | 0.23 | 0.22 | 0.37 | 0.47 | 0.28 | 0.24 | 0.34 | 0.28 | 0.3 | 0.215 | 0.35 | 0.195 | 0.235 | 0.345 | 0.313333333 | 0.286666667 | 0.332 |
| Int Paymts % Expse | 0.35 | 0.41 | 0.67 | 0.65 | 0.44 | 0.4 | 0.43 | 0.46 | 0.51 | 0.38 | 0.5 | 0.315 | 0.375 | 0.305 | 0.466666667 | 0.276666667 | 0.538 |
| Int Paymts % Rev | 0.36 | 0.41 | 0.6 | 0.59 | 0.44 | 0.4 | 0.56 | 0.43 | 0.48 | 0.38 | 0.475 | 0.315 | 0.38 | 0.305 | 0.45 | 0.276666667 | 0.472 |
| Interest | 0.15 | 0 | 0.14 | 0.2 | 0.07 | 0.15 | 0.12 | 0.04 | 0.145 | 0 | 0.175 | 0 | 0.15 | 0 | 0.166666667 | 0 | 0.128 |
| Interest Ext. Debt | 0.21 | 0 | 0.25 | 0.22 | 0.27 | 0.43 | 0.38 | 0.12 | 0.23 | 0 | 0.215 | 0 | 0.32 | 0 | 0.286666667 | 0 | 0.312 |
| Interest on Ext. Debt | 0.38 | 0 | 0.44 | 0.44 | 0.38 | 0.36 | 0.62 | 0.44 | 0.41 | 0 | 0.41 | 0 | 0.37 | 0 | 0.393333333 | 0 | 0.444 |
| Interest Payments | 0.44 | 0.26 | 0.54 | 0.6 | 0.27 | 0.5 | 0.39 | 0.6 | 0.49 | 0.32 | 0.52 | 0.32 | 0.47 | 0.25 | 0.513333333 | 0.293333333 | 0.554 |
| Interest Rate | 0.47 | 0.11 | 0.75 | 0.81 | 0.23 | 0.4 | 0.56 | 0.56 | 0.61 | 0.055 | 0.64 | 0.055 | 0.435 | 0.16 | 0.56 | 0.106666667 | 0.57 |
| Interest rate diff | 0.48 | 0.18 | 0.6 | 0.8 | 0.33 | 0.39 | 0.53 | 0.47 | 0.54 | 0.09 | 0.64 | 0.09 | 0.435 | 0.23 | 0.556666667 | 0.153333333 | 0.542 |
| Internet Access % | 0.92 | 0.88 | 0.92 | 1 | 0.44 | 0.48 | 1 | 0.93 | 0.92 | 0.64 | 0.96 | 0.565 | 0.7 | 0.65 | 0.8 | 0.516666667 | 0.844 |
| Inventory Changes | 0.34 | 0.26 | 0.38 | 0.59 | 0.32 | 0.41 | 0.4 | 0.47 | 0.36 | 0.19 | 0.465 | 0.255 | 0.375 | 0.185 | 0.446666667 | 0.206666667 | 0.404 |
| IP Charges | 0.87 | 0.3 | 0.85 | 0.92 | 0.42 | 0.86 | 1 | 0.91 | 0.86 | 0.3 | 0.895 | 0.275 | 0.865 | 0.295 | 0.883333333 | 0.28 | 0.824 |
| IP Receipts | 0.79 | 0.62 | 0.92 | 0.86 | 0.51 | 0.87 | 1 | 1 | 0.855 | 0.5 | 0.825 | 0.435 | 0.83 | 0.62 | 0.84 | 0.496666667 | 0.808 |
| Labor Contribution | 0.63 | 0.3 | 0.77 | 0.75 | 0.3 | 0.51 | 0.69 | 0.5 | 0.7 | 0.265 | 0.69 | 0.235 | 0.57 | 0.36 | 0.63 | 0.296666667 | 0.72 |
| Labor Part M:F Rate | 0.44 | 0.5 | 0.67 | 0.55 | 0.44 | 0.58 | 0.57 | 0.67 | 0.555 | 0.44 | 0.495 | 0.365 | 0.51 | 0.46 | 0.523333333 | 0.383333333 | 0.528 |
| Labor Participation | 0.38 | 0.5 | 0.54 | 0.54 | 0.35 | 0.39 | 0.55 | 0.38 | 0.46 | 0.345 | 0.46 | 0.335 | 0.385 | 0.41 | 0.436666667 | 0.33 | 0.548 |
| Labor Participation | 0.48 | 0.35 | 0.56 | 0.44 | 0.35 | 0.55 | 0.46 | 0.46 | 0.52 | 0.325 | 0.46 | 0.29 | 0.515 | 0.385 | 0.49 | 0.333333333 | 0.454 |
| Labour Participation | 0.45 | 0.23 | 0.5 | 0.62 | 0.33 | 0.39 | 0.69 | 0.5 | 0.475 | 0.23 | 0.535 | 0.24 | 0.42 | 0.275 | 0.486666667 | 0.266666667 | 0.528 |
| Labour Participation Jobs | 0.67 | 0.35 | 0.41 | 0.35 | 0.21 | 0.57 | 0.41 | 0.44 | 0.54 | 0.315 | 0.51 | 0.33 | 0.62 | 0.365 | 0.53 | 0.346666667 | 0.442 |
| Labour Utilization | 0.52 | 0.39 | 0.4 | 0.28 | 0.75 | 0.3 | 0.23 | 0.16 | 0.46 | 0.385 | 0.4 | 0.295 | 0.41 | 0.3 | 0.366666667 | 0.266666667 | 0.442 |
| Land < 5m | 0.37 | 0.45 | 0.37 | 0.38 | 0.34 | 0.4 | 0.27 | 0.45 | 0.37 | 0.345 | 0.375 | 0.36 | 0.385 | 0.37 | 0.383333333 | 0.336666667 | 0.373333333 |
| Land Area | 0.61 | 0.35 | 0.5 | 0.69 | 0.25 | 0.35 | 0.47 | 0.6 | 0.555 | 0.27 | 0.65 | 0.26 | 0.48 | 0.34 | 0.55 | 0.283333333 | 0.556 |
| Legal Right Strength | 0.71 | 0.26 | 0.94 | 0.81 | 0.4 | 0.36 | 0.77 | 0.62 | 0.825 | 0.2 | 0.76 | 0.165 | 0.535 | 0.28 | 0.626666667 | 0.21 | 0.82 |
| Lending Banks | 0.55 | 0 | 0.3 | 0.3 | 0.21 | 0.55 | 0.27 | 0.15 | 0.425 | 0 | 0.425 | 0 | 0.55 | 0 | 0.466666667 | 0 | 0.454 |
| Lending Int Rate% | 0.74 | 0.21 | 1 | 0.93 | 0.35 | 0.43 | 0.88 | 0.78 | 0.87 | 0.105 | 0.835 | 0.105 | 0.585 | 0.255 | 0.7 | 0.17 | 0.754 |
| Lg Asset Investment | 0.36 | 0.15 | 0.36 | 0.59 | 0.33 | 0.35 | 0.42 | 0.59 | 0.36 | 0.18 | 0.475 | 0.265 | 0.355 | 0.255 | 0.433333333 | 0.296666667 | 0.382 |
| Life Expectancy Female | 0.86 | 0.58 | 0.9 | 0.9 | 0.5 | 0.62 | 1 | 0.91 | 0.88 | 0.49 | 0.88 | 0.375 | 0.74 | 0.54 | 0.793333333 | 0.416666667 | 0.802 |
| Life Expectancy Male | 0.88 | 0.5 | 0.92 | 0.93 | 0.44 | 0.49 | 1 | 1 | 0.9 | 0.395 | 0.905 | 0.44 | 0.685 | 0.5 | 0.766666667 | 0.46 | 0.78 |
| Listed Companies | 0.5 | 0.21 | 0.48 | 0.66 | 0.32 | 0.42 | 0.66 | 0.58 | 0.49 | 0.13 | 0.58 | 0.23 | 0.46 | 0.285 | 0.526666667 | 0.273333333 | 0.492 |
| Literacy | 0.55 | 0.28 | 0.6 | 0.67 | 0.38 | 0.33 | 0.6 | 0.33 | 0.575 | 0.14 | 0.61 | 0.14 | 0.44 | 0.29 | 0.516666667 | 0.193333333 | 0.59 |
| Literacy | 0.56 | 0.08 | 0.55 | 0.73 | 0.38 | 0.37 | 0.47 | 0.53 | 0.555 | 0.04 | 0.645 | 0.04 | 0.465 | 0.19 | 0.553333333 | 0.126666667 | 0.59 |
| Literacy | 0.59 | 0.18 | 0.56 | 0.62 | 0.19 | 0.44 | 0.53 | 0.38 | 0.575 | 0.09 | 0.605 | 0.09 | 0.515 | 0.24 | 0.55 | 0.16 | 0.565 |
| Literacy Adults | 0.59 | 0.08 | 0.67 | 0.73 | 0.38 | 0.34 | 0.44 | 0.4 | 0.63 | 0.04 | 0.66 | 0.04 | 0.465 | 0.19 | 0.553333333 | 0.126666667 | 0.67 |
| Literacy Female 15-24 | 0.65 | 0.13 | 0.58 | 0.53 | 0.31 | 0.33 | 0.53 | 0.5 | 0.615 | 0.065 | 0.59 | 0.065 | 0.49 | 0.17 | 0.503333333 | 0.113333333 | 0.59 |
| Literacy Male >15 | 0.5 | 0.18 | 0.64 | 0.79 | 0.38 | 0.33 | 0.47 | 0.4 | 0.57 | 0.09 | 0.645 | 0.09 | 0.415 | 0.24 | 0.54 | 0.16 | 0.6375 |
| Literacy Male 15-24 | 0.75 | 0.11 | 0.5 | 0.71 | 0.38 | 0.33 | 0.53 | 0.42 | 0.625 | 0.055 | 0.73 | 0.055 | 0.54 | 0.16 | 0.596666667 | 0.106666667 | 0.61 |
| Livestock Index | 0.62 | 0.38 | 0.53 | 0.35 | 0.35 | 0.43 | 0.53 | 0.47 | 0.575 | 0.295 | 0.485 | 0.275 | 0.525 | 0.405 | 0.466666667 | 0.326666667 | 0.518 |
| Logistics Index | 0.7 | 0.45 | 0.92 | 0.88 | 0.48 | 0.47 | 0.95 | 1 | 0.81 | 0.435 | 0.79 | 0.415 | 0.585 | 0.415 | 0.683333333 | 0.403333333 | 0.7425 |
| Logistics Index | 0.81 | 0.45 | 0.85 | 0.92 | 0.38 | 0.47 | 1 | 0.92 | 0.83 | 0.425 | 0.865 | 0.415 | 0.64 | 0.415 | 0.733333333 | 0.403333333 | 0.75 |
| Logistics Index | 0.81 | 0.36 | 0.83 | 0.93 | 0.5 | 0.47 | 1 | 0.92 | 0.82 | 0.285 | 0.87 | 0.37 | 0.64 | 0.37 | 0.736666667 | 0.373333333 | 0.755 |
| Logistics Index | 0.85 | 0.36 | 0.83 | 0.93 | 0.52 | 0.47 | 1 | 0.92 | 0.84 | 0.32 | 0.89 | 0.37 | 0.66 | 0.37 | 0.75 | 0.373333333 | 0.73 |
| Logistics Index | 0.88 | 0.33 | 0.83 | 0.92 | 0.38 | 0.53 | 0.94 | 0.79 | 0.855 | 0.28 | 0.9 | 0.355 | 0.705 | 0.355 | 0.776666667 | 0.363333333 | 0.8125 |
| Logistics Index | 0.92 | 0.24 | 0.83 | 0.93 | 0.52 | 0.53 | 1 | 0.92 | 0.875 | 0.235 | 0.925 | 0.205 | 0.725 | 0.31 | 0.793333333 | 0.263333333 | 0.785 |
| Logistics Index | 0.93 | 0.27 | 0.92 | 1 | 0.31 | 0.47 | 1 | 1 | 0.925 | 0.325 | 0.965 | 0.325 | 0.7 | 0.325 | 0.8 | 0.343333333 | 0.8175 |
| Longevity | 0.88 | 0.58 | 0.92 | 0.93 | 0.44 | 0.55 | 1 | 0.92 | 0.9 | 0.44 | 0.905 | 0.48 | 0.715 | 0.54 | 0.786666667 | 0.486666667 | 0.776 |
| Loss to Electric Outage | 0.37 | 0 | 0.4 | 0.5 | 0.44 | 0.41 | 0.5 | 0.33 | 0.385 | 0 | 0.435 | 0 | 0.39 | 0 | 0.426666667 | 0 | 0.4125 |
| Lower Sec. Female | 0.71 | 0.28 | 0.86 | 0.8 | 0.58 | 0.59 | 0.75 | 0.64 | 0.785 | 0.34 | 0.755 | 0.225 | 0.65 | 0.33 | 0.7 | 0.276666667 | 0.685 |
| Lowest-40% Incomes | 0.91 | 0.75 | 0.91 | 1 | 0.8 | 0.57 | 1 | 1 | 0.91 | 0.7 | 0.955 | 0.565 | 0.74 | 0.475 | 0.826666667 | 0.443333333 | 0.94 |
| Machinery Transport | 0.56 | 0.36 | 0.86 | 0.86 | 0.52 | 0.68 | 0.93 | 0.68 | 0.71 | 0.39 | 0.71 | 0.305 | 0.62 | 0.37 | 0.7 | 0.33 | 0.624 |
| Malaria | 0.42 | 0 | 0.27 | 0.4 | 0.29 | 0.33 | 0.43 | 0.25 | 0.345 | 0 | 0.41 | 0 | 0.375 | 0 | 0.383333333 | 0 | 0.35 |
| Malaria Fever Drug Use | 0.36 | 0 | 0.12 | 0.17 | 0.25 | 0.43 | 0.25 | 0 | 0.24 | 0 | 0.265 | 0 | 0.395 | 0 | 0.32 | 0 | 0.216666667 |
| Mammals Threatened | 0.42 | 0.32 | 0.67 | 0.66 | 0.47 | 0.49 | 0.64 | 0.57 | 0.545 | 0.36 | 0.54 | 0.285 | 0.455 | 0.42 | 0.523333333 | 0.363333333 | 0.583333333 |
| Manu Exports | 0.67 | 0.3 | 0.73 | 0.61 | 0.37 | 0.48 | 0.57 | 0.48 | 0.7 | 0.29 | 0.64 | 0.265 | 0.575 | 0.365 | 0.586666667 | 0.32 | 0.584 |
| Manuf %GDP | 0.79 | 0.58 | 0.57 | 0.63 | 0.31 | 0.56 | 0.67 | 0.39 | 0.68 | 0.52 | 0.71 | 0.405 | 0.675 | 0.47 | 0.66 | 0.39 | 0.538 |
| Manuf CLCU | 0.43 | 0.3 | 0.41 | 0.33 | 0.32 | 0.54 | 0.56 | 0.53 | 0.42 | 0.3 | 0.38 | 0.275 | 0.485 | 0.29 | 0.433333333 | 0.276666667 | 0.386 |
| Manufactg Imports | 0.8 | 0.36 | 0.52 | 0.63 | 0.31 | 0.45 | 0.69 | 0.54 | 0.66 | 0.37 | 0.715 | 0.305 | 0.625 | 0.395 | 0.626666667 | 0.346666667 | 0.604 |
| Manufacturing | 0.82 | 0.4 | 0.86 | 0.8 | 0.41 | 0.94 | 0.86 | 0.67 | 0.84 | 0.35 | 0.81 | 0.325 | 0.88 | 0.39 | 0.853333333 | 0.343333333 | 0.758 |
| Manufacturing Grth% | 0.49 | 0.19 | 0.43 | 0.36 | 0.31 | 0.4 | 0.56 | 0.56 | 0.46 | 0.235 | 0.425 | 0.18 | 0.445 | 0.255 | 0.416666667 | 0.226666667 | 0.4 |
| Manufacturing US$ | 0.82 | 0.5 | 0.73 | 0.74 | 0.38 | 0.93 | 0.87 | 0.67 | 0.775 | 0.4 | 0.78 | 0.375 | 0.875 | 0.535 | 0.83 | 0.44 | 0.698 |
| Marine Protected | 0.42 | 0.32 | 0.5 | 0.68 | 0.26 | 0.26 | 0.77 | 0.62 | 0.46 | 0.35 | 0.55 | 0.31 | 0.34 | 0.32 | 0.453333333 | 0.313333333 | 0.533333333 |
| Market Cap %GDP | 0.34 | 0.19 | 0.44 | 0.49 | 0.41 | 0.45 | 0.66 | 0.78 | 0.39 | 0.185 | 0.415 | 0.155 | 0.395 | 0.195 | 0.426666667 | 0.17 | 0.446 |
| Market Cap US$ | 0.49 | 0.28 | 0.44 | 0.53 | 0.34 | 0.61 | 0.76 | 0.68 | 0.465 | 0.215 | 0.51 | 0.2 | 0.55 | 0.21 | 0.543333333 | 0.18 | 0.474 |
| Marriage Rate | 0.32 | 0.28 | 0.42 | 0.32 | 0.63 | 0.38 | 0.4 | 0.37 | 0.37 | 0.355 | 0.32 | 0.285 | 0.35 | 0.28 | 0.34 | 0.283333333 | 0.336 |
| Maternal Death | 0.75 | 0.43 | 0.92 | 1 | 0.69 | 0.64 | 0.94 | 0.8 | 0.835 | 0.5 | 0.875 | 0.36 | 0.695 | 0.335 | 0.796666667 | 0.32 | 0.79 |
| Maternal Death % | 0.82 | 0.28 | 0.88 | 1 | 0.71 | 0.57 | 0.94 | 0.82 | 0.85 | 0.39 | 0.91 | 0.265 | 0.695 | 0.245 | 0.796666667 | 0.246666667 | 0.835 |
| Maternal Death Lifetime | 0.76 | 0.24 | 0.86 | 1 | 0.6 | 0.71 | 0.92 | 0.85 | 0.81 | 0.39 | 0.88 | 0.245 | 0.735 | 0.33 | 0.823333333 | 0.303333333 | 0.84 |
| Maternal Death Ratio | 0.72 | 0.36 | 0.85 | 1 | 0.54 | 0.54 | 0.92 | 0.85 | 0.785 | 0.43 | 0.86 | 0.315 | 0.63 | 0.325 | 0.753333333 | 0.306666667 | 0.8375 |
| Maternal Deaths | 0.62 | 0.42 | 0.85 | 0.84 | 0.44 | 0.82 | 0.56 | 0.8 | 0.735 | 0.26 | 0.73 | 0.3 | 0.72 | 0.485 | 0.76 | 0.383333333 | 0.74 |
| Mean Wealth US$ | 1 | 0.08 | 0.93 | 0.93 | 0.67 | 0.8 | 1 | 1 | 0.965 | 0.35 | 0.965 | 0.23 | 0.9 | 0.25 | 0.91 | 0.293333333 | 0.953333333 |
| Merchandise exports$ | 0.86 | 0.54 | 0.77 | 0.79 | 0.44 | 1 | 0.85 | 0.62 | 0.815 | 0.41 | 0.825 | 0.395 | 0.93 | 0.645 | 0.883333333 | 0.513333333 | 0.782 |
| Methane Emissions | 0.52 | 0.42 | 0.55 | 0.55 | 0.28 | 0.77 | 0.46 | 0.56 | 0.535 | 0.35 | 0.535 | 0.335 | 0.645 | 0.46 | 0.613333333 | 0.39 | 0.536 |
| Methane Emissions | 0.62 | 0.56 | 0.63 | 0.41 | 0.35 | 0.56 | 0.31 | 0.4 | 0.625 | 0.44 | 0.515 | 0.405 | 0.59 | 0.575 | 0.53 | 0.466666667 | 0.575 |
| Migrant Stock % | 0.67 | 0.34 | 0.67 | 0.74 | 0.44 | 0.37 | 0.85 | 0.85 | 0.67 | 0.24 | 0.705 | 0.205 | 0.52 | 0.345 | 0.593333333 | 0.253333333 | 0.702 |
| Migrant Workers | 0.65 | 0.62 | 0.77 | 0.77 | 0.21 | 0.57 | 0.77 | 0.77 | 0.71 | 0.415 | 0.71 | 0.435 | 0.61 | 0.505 | 0.663333333 | 0.42 | 0.73 |
| Migration per Pop | 0.75 | 0.66 | 0.77 | 0.8 | 0.5 | 0.76 | 1 | 0.85 | 0.76 | 0.64 | 0.775 | 0.58 | 0.755 | 0.565 | 0.77 | 0.543333333 | 0.686 |
| Military %GDP | 0.43 | 0.33 | 0.35 | 0.39 | 0.38 | 0.35 | 0.41 | 0.51 | 0.39 | 0.415 | 0.41 | 0.29 | 0.39 | 0.31 | 0.39 | 0.29 | 0.432 |
| Military %Gov Spending | 0.63 | 0.55 | 0.49 | 0.42 | 0.44 | 0.36 | 0.55 | 0.59 | 0.56 | 0.575 | 0.525 | 0.425 | 0.495 | 0.375 | 0.47 | 0.35 | 0.49 |
| Military Spending LCU | 0.44 | 0.29 | 0.4 | 0.4 | 0.33 | 0.35 | 0.46 | 0.4 | 0.42 | 0.21 | 0.42 | 0.23 | 0.395 | 0.235 | 0.396666667 | 0.213333333 | 0.39 |
| Mineral %GDP | 0.54 | 0.38 | 0.62 | 0.61 | 0.38 | 0.73 | 0.61 | 0.54 | 0.58 | 0.47 | 0.575 | 0.3 | 0.635 | 0.38 | 0.626666667 | 0.326666667 | 0.532 |
| Mineral Depletion | 0.48 | 0.32 | 0.37 | 0.69 | 0.46 | 0.61 | 0.46 | 0.35 | 0.425 | 0.275 | 0.585 | 0.25 | 0.545 | 0.32 | 0.593333333 | 0.273333333 | 0.452 |
| Mineral Depltn | 0.54 | 0.23 | 0.69 | 0.69 | 0.36 | 0.55 | 0.69 | 0.46 | 0.615 | 0.395 | 0.615 | 0.225 | 0.545 | 0.305 | 0.593333333 | 0.276666667 | 0.582 |
| Mortality | 0.71 | 0.28 | 0.88 | 0.88 | 0.5 | 0.47 | 0.92 | 1 | 0.795 | 0.45 | 0.795 | 0.265 | 0.59 | 0.29 | 0.686666667 | 0.276666667 | 0.823333333 |
| Mortality | 0.85 | 0.3 | 0.9 | 0.94 | 0.53 | 0.52 | 1 | 0.9 | 0.875 | 0.36 | 0.895 | 0.3 | 0.685 | 0.405 | 0.77 | 0.37 | 0.756 |
| Mortality <5 | 0.73 | 0.38 | 0.9 | 0.9 | 0.6 | 0.57 | 0.9 | 0.9 | 0.815 | 0.425 | 0.815 | 0.29 | 0.65 | 0.38 | 0.733333333 | 0.32 | 0.786 |
| Mortality <5 Female | 0.76 | 0.3 | 0.9 | 0.9 | 0.6 | 0.48 | 0.9 | 0.9 | 0.83 | 0.355 | 0.83 | 0.265 | 0.62 | 0.34 | 0.713333333 | 0.303333333 | 0.772 |
| Mortality Infant Female | 0.72 | 0.36 | 0.9 | 0.9 | 0.6 | 0.47 | 0.9 | 0.9 | 0.81 | 0.405 | 0.81 | 0.205 | 0.595 | 0.37 | 0.696666667 | 0.263333333 | 0.778 |
| Mortality Infant Male | 0.71 | 0.45 | 0.91 | 0.94 | 0.64 | 0.57 | 0.9 | 0.91 | 0.81 | 0.475 | 0.825 | 0.31 | 0.64 | 0.33 | 0.74 | 0.276666667 | 0.853333333 |
| Mortality Male | 0.85 | 0.46 | 0.9 | 0.94 | 0.5 | 0.43 | 1 | 1 | 0.875 | 0.44 | 0.895 | 0.38 | 0.64 | 0.485 | 0.74 | 0.423333333 | 0.68 |
| Mortgage Rates | 0.65 | 0.36 | 0.77 | 0.81 | 0.54 | 0.52 | 0.91 | 0.86 | 0.71 | 0.305 | 0.73 | 0.2 | 0.585 | 0.31 | 0.66 | 0.22 | 0.743333333 |
| Muslim Religion | 0.45 | 0.31 | 0.59 | 0.65 | 0.29 | 0.27 | 0.52 | 0.44 | 0.52 | 0.365 | 0.55 | 0.345 | 0.36 | 0.285 | 0.456666667 | 0.316666667 | 0.563333333 |
| Nat Rsrc Depletion | 0.65 | 0.37 | 0.53 | 0.64 | 0.41 | 0.41 | 0.7 | 0.65 | 0.59 | 0.3 | 0.645 | 0.31 | 0.53 | 0.285 | 0.566666667 | 0.273333333 | 0.566 |
| National Income | 0.77 | 0.5 | 0.67 | 0.83 | 0.5 | 0.87 | 0.87 | 0.67 | 0.72 | 0.45 | 0.8 | 0.44 | 0.82 | 0.515 | 0.823333333 | 0.47 | 0.716 |
| National Income US$ | 0.81 | 0.44 | 0.69 | 0.85 | 0.47 | 0.93 | 0.8 | 0.62 | 0.75 | 0.36 | 0.83 | 0.345 | 0.87 | 0.425 | 0.863333333 | 0.366666667 | 0.742 |
| National Reserves $ | 0.53 | 0.08 | 0.67 | 0.75 | 0.44 | 0.82 | 0.86 | 0.6 | 0.6 | 0.145 | 0.64 | 0.165 | 0.675 | 0.29 | 0.7 | 0.276666667 | 0.63 |
| National Reserves % | 0.33 | 0 | 0.2 | 0.23 | 0.36 | 0.47 | 0.4 | 0.09 | 0.265 | 0 | 0.28 | 0 | 0.4 | 0 | 0.343333333 | 0 | 0.288 |
| National Savings $ | 0.65 | 0.54 | 0.67 | 0.61 | 0.28 | 0.94 | 0.87 | 0.67 | 0.66 | 0.52 | 0.63 | 0.46 | 0.795 | 0.52 | 0.733333333 | 0.473333333 | 0.628 |
| National Savings % | 0.52 | 0.54 | 0.62 | 0.59 | 0.38 | 0.47 | 0.5 | 0.44 | 0.57 | 0.54 | 0.555 | 0.46 | 0.495 | 0.445 | 0.526666667 | 0.423333333 | 0.492 |
| Natural Gas | 0.57 | 0.33 | 0.6 | 0.62 | 0.34 | 0.63 | 0.59 | 0.46 | 0.585 | 0.33 | 0.595 | 0.345 | 0.6 | 0.355 | 0.606666667 | 0.356666667 | 0.566 |
| Natural Gas Electricity | 0.59 | 0.38 | 0.63 | 0.68 | 0.5 | 0.59 | 0.55 | 0.71 | 0.61 | 0.35 | 0.635 | 0.34 | 0.59 | 0.395 | 0.62 | 0.363333333 | 0.628 |
| Natural Resources | 0.62 | 0.41 | 0.63 | 0.68 | 0.41 | 0.56 | 0.7 | 0.74 | 0.625 | 0.295 | 0.65 | 0.25 | 0.59 | 0.37 | 0.62 | 0.276666667 | 0.582 |
| NeoNatal Deaths | 0.42 | 0.42 | 0.7 | 0.74 | 0.47 | 0.68 | 0.6 | 0.8 | 0.56 | 0.235 | 0.58 | 0.335 | 0.55 | 0.39 | 0.613333333 | 0.343333333 | 0.59 |
| Neonatal Deaths | 0.83 | 0.36 | 0.92 | 0.92 | 0.67 | 0.57 | 0.91 | 0.83 | 0.875 | 0.39 | 0.875 | 0.295 | 0.7 | 0.33 | 0.773333333 | 0.296666667 | 0.79 |
| Net Capital BoP | 0.62 | 0.4 | 0.63 | 0.67 | 0.47 | 0.68 | 0.65 | 0.64 | 0.625 | 0.36 | 0.645 | 0.3 | 0.65 | 0.365 | 0.656666667 | 0.31 | 0.552 |
| Net Financial Assets | 0.47 | 0.27 | 0.46 | 0.29 | 0.32 | 0.48 | 0.26 | 0.31 | 0.465 | 0.25 | 0.38 | 0.155 | 0.475 | 0.315 | 0.413333333 | 0.223333333 | 0.456 |
| Net Liabilities | 0.15 | 0.16 | 0.41 | 0.44 | 0.17 | 0.28 | 0.32 | 0.46 | 0.28 | 0.09 | 0.295 | 0.115 | 0.215 | 0.185 | 0.29 | 0.146666667 | 0.29 |
| Net Worth | 0.05 | 0.12 | 0.28 | 0.25 | 0.2 | 0.28 | 0.25 | 0.4 | 0.165 | 0.2 | 0.15 | 0.185 | 0.165 | 0.2 | 0.193333333 | 0.216666667 | 0.2025 |
| New Business Density | 0.75 | 0.36 | 0.64 | 0.75 | 0.54 | 0.57 | 0.67 | 0.6 | 0.695 | 0.22 | 0.75 | 0.225 | 0.66 | 0.255 | 0.69 | 0.2 | 0.655 |
| New Businesses | 0.69 | 0.38 | 0.61 | 0.64 | 0.56 | 0.73 | 0.67 | 0.53 | 0.65 | 0.265 | 0.665 | 0.315 | 0.71 | 0.37 | 0.686666667 | 0.33 | 0.59 |
| NO Emission Energy | 0.41 | 0.67 | 0.54 | 0.5 | 0.38 | 0.75 | 0.56 | 0.32 | 0.475 | 0.475 | 0.455 | 0.46 | 0.58 | 0.62 | 0.553333333 | 0.496666667 | 0.438 |
| NO Emission Energy | 0.76 | 0.62 | 0.69 | 0.67 | 0.43 | 0.38 | 0.69 | 0.8 | 0.725 | 0.51 | 0.715 | 0.5 | 0.57 | 0.6 | 0.603333333 | 0.526666667 | 0.646 |
| NO Emissions | 0.37 | 0.41 | 0.38 | 0.37 | 0.29 | 0.5 | 0.4 | 0.32 | 0.375 | 0.385 | 0.37 | 0.36 | 0.435 | 0.34 | 0.413333333 | 0.33 | 0.456 |
| NO Emissions Agri | 0.33 | 0.35 | 0.38 | 0.34 | 0.41 | 0.5 | 0.4 | 0.41 | 0.355 | 0.28 | 0.335 | 0.29 | 0.415 | 0.335 | 0.39 | 0.3 | 0.374 |
| NO Emissions Agri | 0.54 | 0.47 | 0.46 | 0.55 | 0.35 | 0.43 | 0.59 | 0.53 | 0.5 | 0.3 | 0.545 | 0.335 | 0.485 | 0.475 | 0.506666667 | 0.383333333 | 0.496 |
| NO Emissions Chg | 0.56 | 0.42 | 0.59 | 0.42 | 0.47 | 0.45 | 0.55 | 0.41 | 0.575 | 0.42 | 0.49 | 0.31 | 0.505 | 0.405 | 0.476666667 | 0.336666667 | 0.515 |
| Nom Housing Prices | 0.29 | 0.23 | 0.17 | 0.24 | 0.12 | 0.53 | 0.19 | 0.19 | 0.23 | 0.28 | 0.265 | 0.225 | 0.41 | 0.305 | 0.353333333 | 0.276666667 | 0.18 |
| Nuclear Electricity | 0.33 | 0.21 | 0.6 | 0.37 | 0.57 | 0.31 | 0.46 | 0.36 | 0.465 | 0.28 | 0.35 | 0.2 | 0.32 | 0.325 | 0.336666667 | 0.28 | 0.35 |
| Nuclear Energy | 0.49 | 0.64 | 0.68 | 0.68 | 0.58 | 0.49 | 0.6 | 0.66 | 0.585 | 0.55 | 0.585 | 0.435 | 0.49 | 0.395 | 0.553333333 | 0.34 | 0.526 |
| Nurses | 0.86 | 0.16 | 0.85 | 1 | 0.57 | 0.61 | 1 | 0.85 | 0.855 | 0.35 | 0.93 | 0.205 | 0.735 | 0.16 | 0.823333333 | 0.19 | 0.698 |
| ODA % Cap Formtn | 0.9 | 0 | 0.5 | 0.75 | 0.2 | 0.7 | 0.62 | 0.47 | 0.7 | 0 | 0.825 | 0 | 0.8 | 0 | 0.783333333 | 0 | 0.608 |
| ODA Received %GNI | 0.9 | 0 | 0.5 | 0.75 | 0.2 | 0.8 | 0.56 | 0.44 | 0.7 | 0 | 0.825 | 0 | 0.85 | 0 | 0.816666667 | 0 | 0.612 |
| ODA Received %Import | 0.9 | 0 | 0.5 | 0.62 | 0.47 | 0.7 | 0.62 | 0.56 | 0.7 | 0 | 0.76 | 0 | 0.8 | 0 | 0.74 | 0 | 0.624 |
| Oil Electricity | 0.46 | 0.38 | 0.57 | 0.53 | 0.36 | 0.44 | 0.55 | 0.43 | 0.515 | 0.38 | 0.495 | 0.25 | 0.45 | 0.38 | 0.476666667 | 0.293333333 | 0.474 |
| Oil Rents %GDP | 0.56 | 0.44 | 0.41 | 0.53 | 0.55 | 0.63 | 0.63 | 0.45 | 0.485 | 0.35 | 0.545 | 0.375 | 0.595 | 0.405 | 0.573333333 | 0.373333333 | 0.494 |
| Oil, Gas, Coal Electricity | 0.4 | 0.24 | 0.26 | 0.33 | 0.36 | 0.32 | 0.57 | 0.63 | 0.33 | 0.225 | 0.365 | 0.155 | 0.36 | 0.265 | 0.35 | 0.2 | 0.388 |
| Op License Time | 0.32 | 0 | 0.31 | 0.37 | 0.33 | 0.43 | 0.36 | 0.19 | 0.315 | 0 | 0.345 | 0 | 0.375 | 0 | 0.373333333 | 0 | 0.4175 |
| Ores & Metal Export | 0.5 | 0.12 | 0.61 | 0.54 | 0.35 | 0.68 | 0.63 | 0.48 | 0.555 | 0.165 | 0.52 | 0.185 | 0.59 | 0.295 | 0.573333333 | 0.28 | 0.512 |
| Ores Metal Imports | 0.49 | 0.62 | 0.75 | 0.7 | 0.53 | 0.45 | 0.56 | 0.37 | 0.62 | 0.56 | 0.595 | 0.5 | 0.47 | 0.585 | 0.546666667 | 0.516666667 | 0.532 |
| Other - % Expense | 0.5 | 0.18 | 0.42 | 0.53 | 0.4 | 0.46 | 0.42 | 0.5 | 0.46 | 0.195 | 0.515 | 0.2 | 0.48 | 0.295 | 0.496666667 | 0.27 | 0.43 |
| Other Manuftg | 0.68 | 0.42 | 0.62 | 0.69 | 0.48 | 0.55 | 0.73 | 0.58 | 0.65 | 0.37 | 0.685 | 0.335 | 0.615 | 0.4 | 0.64 | 0.35 | 0.576 |
| Palma Ratio | 0.5 | 0.33 | 1 | 0.6 | 1 | 0.4 | 0.6 | 0.79 | 0.75 | 0.33 | 0.55 | 0.25 | 0.45 | 0.315 | 0.5 | 0.266666667 | 0.575 |
| Patent Applications | 0.56 | 0.4 | 0.79 | 0.75 | 0.47 | 0.69 | 0.83 | 0.52 | 0.675 | 0.39 | 0.655 | 0.315 | 0.625 | 0.275 | 0.666666667 | 0.26 | 0.596 |
| Patent Apps NRs | 0.63 | 0.3 | 0.6 | 0.62 | 0.38 | 0.69 | 0.69 | 0.52 | 0.615 | 0.24 | 0.625 | 0.235 | 0.66 | 0.2 | 0.646666667 | 0.19 | 0.558 |
| Pensions Index | 0.5 | 0 | 0.63 | 0.52 | 0.62 | 0.75 | 0.5 | 0.88 | 0.565 | 0 | 0.51 | 0 | 0.625 | 0 | 0.59 | 0 | 0.55 |
| Persistence | 0.76 | 0.15 | 0.83 | 0.74 | 0.4 | 0.45 | 0.92 | 0.77 | 0.795 | 0.21 | 0.75 | 0.12 | 0.605 | 0.115 | 0.65 | 0.106666667 | 0.712 |
| Personal Freedom Idx | 0.76 | 0.42 | 0.93 | 0.93 | 0.61 | 0.45 | 0.93 | 1 | 0.845 | 0.4 | 0.845 | 0.285 | 0.605 | 0.4 | 0.713333333 | 0.316666667 | 0.873333333 |
| Personal Remittance | 0.39 | 0.21 | 0.5 | 0.54 | 0.41 | 0.48 | 0.5 | 0.37 | 0.445 | 0.295 | 0.465 | 0.23 | 0.435 | 0.365 | 0.47 | 0.326666667 | 0.444 |
| Personal Transfers | 0.79 | 0.36 | 0.45 | 0.65 | 0.49 | 0.79 | 0.72 | 0.78 | 0.62 | 0.325 | 0.72 | 0.245 | 0.79 | 0.315 | 0.743333333 | 0.253333333 | 0.576 |
| Physicians | 0.85 | 0.5 | 0.87 | 0.75 | 0.62 | 0.59 | 0.8 | 0.73 | 0.86 | 0.45 | 0.8 | 0.4 | 0.72 | 0.43 | 0.73 | 0.386666667 | 0.754 |
| Plants Threatened | 0.46 | 0.47 | 0.46 | 0.5 | 0.48 | 0.36 | 0.53 | 0.61 | 0.46 | 0.535 | 0.48 | 0.335 | 0.41 | 0.585 | 0.44 | 0.456666667 | 0.473333333 |
| PNG Banks + | 0.68 | 0 | 0.25 | 0.42 | 0.31 | 0.55 | 0.3 | 0.23 | 0.465 | 0 | 0.55 | 0 | 0.615 | 0 | 0.55 | 0 | 0.536 |
| Pop %Female | 0.54 | 0.43 | 0.35 | 0.48 | 0.41 | 0.47 | 0.21 | 0.64 | 0.445 | 0.375 | 0.51 | 0.415 | 0.505 | 0.455 | 0.496666667 | 0.436666667 | 0.516 |
| Pop < 5m | 0.5 | 0.42 | 0.53 | 0.44 | 0.33 | 0.48 | 0.47 | 0.47 | 0.515 | 0.33 | 0.47 | 0.32 | 0.49 | 0.39 | 0.473333333 | 0.333333333 | 0.49 |
| Pop >65 | 0.57 | 0.5 | 1 | 1 | 0.56 | 0.62 | 0.87 | 0.63 | 0.785 | 0.46 | 0.785 | 0.31 | 0.595 | 0.455 | 0.73 | 0.343333333 | 0.758 |
| Pop 0-4 Female | 0.62 | 0.36 | 0.82 | 0.94 | 0.59 | 0.5 | 0.8 | 0.59 | 0.72 | 0.34 | 0.78 | 0.265 | 0.56 | 0.42 | 0.686666667 | 0.336666667 | 0.642 |
| Pop 0-4 Male | 0.74 | 0.48 | 0.89 | 0.89 | 0.53 | 0.815 | 0.49 | 0.815 | 0.365 | 0.74 | 0.48 | 0.815 | 0.365 | 0.706 | |||
| Pop 10-14 Female | 0.87 | 0.36 | 0.81 | 0.94 | 0.53 | 0.45 | 0.8 | 0.6 | 0.84 | 0.34 | 0.905 | 0.37 | 0.66 | 0.42 | 0.753333333 | 0.406666667 | 0.73 |
| Pop 10-14 Male | 0.89 | 0.55 | 0.88 | 0.82 | 0.47 | 0.45 | 0.9 | 0.9 | 0.885 | 0.435 | 0.855 | 0.36 | 0.67 | 0.515 | 0.72 | 0.4 | 0.674 |
| Pop 15-64 | 0.7 | 0.38 | 0.54 | 0.77 | 0.29 | 0.41 | 0.69 | 0.69 | 0.62 | 0.285 | 0.735 | 0.305 | 0.555 | 0.395 | 0.626666667 | 0.34 | 0.696 |
| Pop 20-24 Male | 0.84 | 0.33 | 0.88 | 0.82 | 0.71 | 0.43 | 0.76 | 0.7 | 0.86 | 0.375 | 0.83 | 0.265 | 0.635 | 0.405 | 0.696666667 | 0.336666667 | 0.744 |
| Pop 40-44 Female | 1 | 0.38 | 0.85 | 0.92 | 0.43 | 0.46 | 0.85 | 0.85 | 0.925 | 0.36 | 0.96 | 0.235 | 0.73 | 0.395 | 0.793333333 | 0.293333333 | 0.762 |
| Pop 40-44 Male | 0.93 | 0.5 | 0.77 | 0.85 | 0.43 | 0.51 | 0.69 | 0.77 | 0.85 | 0.355 | 0.89 | 0.335 | 0.72 | 0.455 | 0.763333333 | 0.36 | 0.696 |
| Pop 45-49 Male | 0.93 | 0.5 | 0.87 | 0.85 | 0.38 | 0.57 | 0.85 | 0.67 | 0.9 | 0.4 | 0.89 | 0.375 | 0.75 | 0.455 | 0.783333333 | 0.386666667 | 0.728 |
| Pop 50-64 Female | 0.6 | 0.31 | 0.87 | 0.87 | 0.47 | 0.57 | 0.88 | 0.69 | 0.735 | 0.305 | 0.735 | 0.305 | 0.585 | 0.395 | 0.68 | 0.363333333 | 0.718 |
| Pop 55-59 Female | 0.56 | 0.24 | 0.8 | 0.93 | 0.37 | 0.57 | 0.75 | 0.69 | 0.68 | 0.28 | 0.745 | 0.32 | 0.565 | 0.36 | 0.686666667 | 0.373333333 | 0.654 |
| Pop 5-9 Male | 0.87 | 0.46 | 0.82 | 0.88 | 0.47 | 0.5 | 1 | 0.8 | 0.845 | 0.38 | 0.875 | 0.355 | 0.685 | 0.47 | 0.75 | 0.396666667 | 0.68 |
| Pop 65-69 Male | 0.62 | 0.31 | 0.8 | 0.93 | 0.5 | 0.62 | 0.8 | 0.67 | 0.71 | 0.365 | 0.775 | 0.215 | 0.62 | 0.395 | 0.723333333 | 0.303333333 | 0.678 |
| Pop 75-79 | 0.76 | 0.43 | 0.85 | 0.92 | 0.5 | 0.46 | 1 | 0.86 | 0.805 | 0.39 | 0.84 | 0.26 | 0.61 | 0.42 | 0.713333333 | 0.31 | 0.704 |
| Pop 75-79 Female | 0.59 | 0.43 | 0.87 | 0.93 | 0.6 | 0.57 | 0.77 | 0.67 | 0.73 | 0.425 | 0.76 | 0.365 | 0.58 | 0.42 | 0.696666667 | 0.38 | 0.678 |
| Pop 80+ female | 0.65 | 0.57 | 0.87 | 1 | 0.6 | 0.51 | 0.85 | 0.62 | 0.76 | 0.495 | 0.825 | 0.435 | 0.58 | 0.44 | 0.72 | 0.393333333 | 0.708 |
| Pop Cities > 1-mil | 0.35 | 0.5 | 0.48 | 0.66 | 0.52 | 0.81 | 0.38 | 0.35 | 0.415 | 0.52 | 0.505 | 0.365 | 0.58 | 0.45 | 0.606666667 | 0.376666667 | 0.486 |
| Pop Cities>1-mil % | 0.81 | 0.4 | 0.46 | 0.54 | 0.47 | 0.47 | 0.38 | 0.5 | 0.635 | 0.425 | 0.675 | 0.29 | 0.64 | 0.34 | 0.606666667 | 0.286666667 | 0.572 |
| Pop Largest City | 0.42 | 0.5 | 0.45 | 0.35 | 0.31 | 0.61 | 0.31 | 0.31 | 0.435 | 0.34 | 0.385 | 0.375 | 0.515 | 0.3 | 0.46 | 0.283333333 | 0.444 |
| Pop Largest City | 0.49 | 0.1 | 0.56 | 0.61 | 0.38 | 0.23 | 0.7 | 0.37 | 0.525 | 0.425 | 0.55 | 0.3 | 0.36 | 0.165 | 0.443333333 | 0.276666667 | 0.576 |
| Popln 25-29 Male | 0.52 | 0.2 | 0.76 | 0.78 | 0.35 | 0.48 | 0.9 | 0.8 | 0.64 | 0.4 | 0.65 | 0.25 | 0.5 | 0.305 | 0.593333333 | 0.303333333 | 0.692 |
| Popln Female 15-19 | 0.61 | 0.24 | 0.88 | 0.94 | 0.59 | 0.4 | 0.82 | 0.59 | 0.745 | 0.37 | 0.775 | 0.245 | 0.505 | 0.36 | 0.65 | 0.323333333 | 0.676 |
| Population | 0.46 | 0.5 | 0.38 | 0.51 | 0.19 | 0.7 | 0.44 | 0.54 | 0.42 | 0.365 | 0.485 | 0.375 | 0.58 | 0.465 | 0.556666667 | 0.393333333 | 0.514 |
| Population age 0-14 | 0.77 | 0.46 | 0.81 | 0.82 | 0.53 | 0.5 | 1 | 0.8 | 0.79 | 0.345 | 0.795 | 0.315 | 0.635 | 0.47 | 0.696666667 | 0.37 | 0.664 |
| Population Density | 0.34 | 0.28 | 0.38 | 0.37 | 0.29 | 0.5 | 0.5 | 0.34 | 0.36 | 0.32 | 0.355 | 0.175 | 0.42 | 0.375 | 0.403333333 | 0.273333333 | 0.39 |
| Population Growth | 0.55 | 0.52 | 0.71 | 0.69 | 0.44 | 0.38 | 0.65 | 0.5 | 0.63 | 0.435 | 0.62 | 0.45 | 0.465 | 0.53 | 0.54 | 0.48 | 0.594 |
| Population Total | 0.46 | 0.5 | 0.38 | 0.51 | 0.19 | 0 | 0.5 | 0.5 | 0.42 | 0.365 | 0.485 | 0.375 | 0.23 | 0.25 | 0.323333333 | 0.25 | 0.514 |
| Populn 70-74 Male | 0.6 | 0.31 | 0.93 | 1 | 0.47 | 0.57 | 0.86 | 0.79 | 0.765 | 0.405 | 0.8 | 0.27 | 0.585 | 0.36 | 0.723333333 | 0.316666667 | 0.756 |
| Port Infrastructure | 0.86 | 0.38 | 0.86 | 0.83 | 0.51 | 0.5 | 1 | 1 | 0.86 | 0.37 | 0.845 | 0.305 | 0.68 | 0.38 | 0.73 | 0.33 | 0.7525 |
| Portfolio | 0.38 | 0 | 0.25 | 0.47 | 0.33 | 0.56 | 0.5 | 0.12 | 0.315 | 0 | 0.425 | 0 | 0.47 | 0 | 0.47 | 0 | 0.386 |
| Portfolio Investmt | 0.82 | 0.35 | 0.73 | 0.84 | 0.43 | 0.77 | 0.91 | 0.75 | 0.775 | 0.215 | 0.83 | 0.26 | 0.795 | 0.42 | 0.81 | 0.336666667 | 0.788 |
| Poverty | 0.54 | 0.46 | 0.69 | 0.88 | 0.5 | 0.35 | 0.69 | 0.5 | 0.615 | 0.39 | 0.71 | 0.29 | 0.445 | 0.445 | 0.59 | 0.336666667 | 0.6975 |
| Poverty | 0.63 | 0.43 | 0.81 | 0.89 | 0.56 | 0.53 | 0.74 | 0.59 | 0.72 | 0.37 | 0.76 | 0.325 | 0.58 | 0.435 | 0.683333333 | 0.363333333 | 0.786 |
| Poverty %Pop | 0.73 | 0 | 0.91 | 1 | 0.49 | 0.22 | 0.92 | 0.42 | 0.82 | 0 | 0.865 | 0 | 0.475 | 0 | 0.65 | 0 | 0.735 |
| PPG Creditors | 0.3 | 0 | 0.47 | 0.36 | 0.33 | 0.34 | 0.21 | 0.13 | 0.385 | 0 | 0.33 | 0 | 0.32 | 0 | 0.333333333 | 0 | 0.422 |
| PPG Priv.Creditors | 0.44 | 0 | 0.33 | 0.4 | 0.31 | 0.44 | 0.31 | 0.2 | 0.385 | 0 | 0.42 | 0 | 0.44 | 0 | 0.426666667 | 0 | 0.454 |
| PPG TDS | 0.35 | 0 | 0.38 | 0.38 | 0.18 | 0.35 | 0.5 | 0.25 | 0.365 | 0 | 0.365 | 0 | 0.35 | 0 | 0.36 | 0 | 0.328 |
| PPG, Creditors | 0.39 | 0 | 0.22 | 0.36 | 0.19 | 0.27 | 0.2 | 0.13 | 0.305 | 0 | 0.375 | 0 | 0.33 | 0 | 0.34 | 0 | 0.344 |
| PPG, IBRD | 0.46 | 0 | 0.33 | 0.4 | 0.29 | 0.39 | 0.38 | 0.09 | 0.395 | 0 | 0.43 | 0 | 0.425 | 0 | 0.416666667 | 0 | 0.422 |
| PPG, IDA | 0.55 | 0 | 0.15 | 0.23 | 0.5 | 0.62 | 0.17 | 0.08 | 0.35 | 0 | 0.39 | 0 | 0.585 | 0 | 0.466666667 | 0 | 0.26 |
| PPP Conversion | 0.22 | 0.16 | 0.43 | 0.35 | 0.37 | 0.35 | 0.47 | 0.65 | 0.325 | 0.33 | 0.285 | 0.27 | 0.285 | 0.29 | 0.306666667 | 0.32 | 0.304 |
| PPP conversion factpr | 0.55 | 0.14 | 0.76 | 0.75 | 0.35 | 0.62 | 0.64 | 0.65 | 0.655 | 0.38 | 0.65 | 0.26 | 0.585 | 0.28 | 0.64 | 0.313333333 | 0.636 |
| Pregnant Prenatal | 0.52 | 0.41 | 0.69 | 0.58 | 0.36 | 0.43 | 0.8 | 0.62 | 0.605 | 0.205 | 0.55 | 0.205 | 0.475 | 0.355 | 0.51 | 0.236666667 | 0.468 |
| Preprimary Schl | 0.78 | 0.62 | 0.69 | 0.67 | 0.44 | 0.41 | 0.69 | 0.69 | 0.735 | 0.5 | 0.725 | 0.4 | 0.595 | 0.485 | 0.62 | 0.383333333 | 0.56 |
| Prevalence | 0.88 | 0.18 | 0.89 | 0.86 | 0.5 | 0.75 | 0.88 | 0.5 | 0.885 | 0.29 | 0.87 | 0.165 | 0.815 | 0.235 | 0.83 | 0.206666667 | 0.876666667 |
| Pri School female % | 0.54 | 0.21 | 0.92 | 1 | 0.46 | 0.49 | 0.92 | 0.83 | 0.73 | 0.295 | 0.77 | 0.23 | 0.515 | 0.21 | 0.676666667 | 0.223333333 | 0.658 |
| Pri School Repeat | 0.6 | 0.41 | 0.8 | 0.8 | 0.33 | 0.34 | 0.63 | 0.8 | 0.7 | 0.405 | 0.7 | 0.33 | 0.47 | 0.355 | 0.58 | 0.32 | 0.688 |
| Pri. Females Out School | 0.49 | 0.18 | 0.69 | 0.62 | 0.33 | 0.78 | 0.63 | 0.9 | 0.59 | 0.23 | 0.555 | 0.215 | 0.635 | 0.205 | 0.63 | 0.22 | 0.524 |
| Pri. Out of School | 0.69 | 0.34 | 0.7 | 0.75 | 0.41 | 0.43 | 0.7 | 0.8 | 0.695 | 0.235 | 0.72 | 0.255 | 0.56 | 0.32 | 0.623333333 | 0.27 | 0.574 |
| Pri. Out of School% | 0.6 | 0.23 | 0.9 | 0.9 | 0.6 | 0.54 | 0.7 | 0.71 | 0.75 | 0.275 | 0.75 | 0.24 | 0.57 | 0.265 | 0.68 | 0.26 | 0.706 |
| Pri. School Enrollment | 0.87 | 0.41 | 0.77 | 0.77 | 0.57 | 0.51 | 0.85 | 0.69 | 0.82 | 0.23 | 0.82 | 0.33 | 0.69 | 0.32 | 0.716666667 | 0.296666667 | 0.646 |
| Pri. School Male | 0.56 | 0.18 | 0.75 | 0.83 | 0.54 | 0.41 | 0.83 | 0.75 | 0.655 | 0.255 | 0.695 | 0.18 | 0.485 | 0.195 | 0.6 | 0.19 | 0.62 |
| Pri. School Male % | 0.51 | 0.32 | 0.75 | 0.83 | 0.47 | 0.39 | 0.75 | 0.83 | 0.63 | 0.35 | 0.67 | 0.25 | 0.45 | 0.265 | 0.576666667 | 0.236666667 | 0.584 |
| Price Level Ratio PPP | 0.63 | 0.2 | 0.86 | 0.94 | 0.43 | 0.41 | 0.85 | 0.92 | 0.745 | 0.37 | 0.785 | 0.255 | 0.52 | 0.215 | 0.66 | 0.246666667 | 0.772 |
| Primary Income | 0.69 | 0.25 | 0.79 | 0.8 | 0.5 | 0.89 | 0.86 | 0.85 | 0.74 | 0.295 | 0.745 | 0.25 | 0.79 | 0.34 | 0.793333333 | 0.31 | 0.726 |
| Primary Incomes | 0.66 | 0.42 | 0.87 | 0.92 | 0.47 | 0.77 | 1 | 0.92 | 0.765 | 0.46 | 0.79 | 0.4 | 0.715 | 0.38 | 0.783333333 | 0.38 | 0.784 |
| PriSchl. Male Repeaters | 0.6 | 0.3 | 0.8 | 0.73 | 0.33 | 0.36 | 0.63 | 0.8 | 0.7 | 0.35 | 0.665 | 0.25 | 0.48 | 0.255 | 0.563333333 | 0.236666667 | 0.67 |
| Private Cred Bur | 0.65 | 0.11 | 0.57 | 0.51 | 0.26 | 0.67 | 0.44 | 0.45 | 0.61 | 0.325 | 0.58 | 0.17 | 0.66 | 0.145 | 0.61 | 0.173333333 | 0.5775 |
| Private Debt | 0.8 | 0.13 | 1 | 1 | 0.65 | 0.67 | 1 | 0.92 | 0.9 | 0.255 | 0.9 | 0.255 | 0.735 | 0.215 | 0.823333333 | 0.27 | 0.858 |
| Profit Tax | 0.5 | 0.25 | 0.48 | 0.67 | 0.59 | 0.21 | 0.44 | 0.38 | 0.49 | 0.25 | 0.585 | 0.16 | 0.355 | 0.24 | 0.46 | 0.183333333 | 0.525 |
| Protected Area % | 0.42 | 0.15 | 0.5 | 0.44 | 0.31 | 0.36 | 0.44 | 0.38 | 0.46 | 0.215 | 0.43 | 0.2 | 0.39 | 0.425 | 0.406666667 | 0.366666667 | 0.453333333 |
| Pump Price Diesel | 0.71 | 0.15 | 0.82 | 0.75 | 0.46 | 0.47 | 0.66 | 0.74 | 0.765 | 0.27 | 0.73 | 0.19 | 0.59 | 0.28 | 0.643333333 | 0.263333333 | 0.582 |
| Pump Price Gas | 0.62 | 0.22 | 0.7 | 0.67 | 0.4 | 0.41 | 0.76 | 0.8 | 0.66 | 0.3 | 0.645 | 0.225 | 0.515 | 0.32 | 0.566666667 | 0.29 | 0.578 |
| Pupil-teacher | 0.74 | 0.48 | 0.75 | 1 | 0.35 | 0.43 | 0.9 | 0.8 | 0.745 | 0.345 | 0.87 | 0.365 | 0.585 | 0.52 | 0.723333333 | 0.43 | 0.678 |
| Pupil-Teacher Ratio | 0.69 | 0.33 | 0.62 | 0.53 | 0.35 | 0.54 | 0.4 | 0.4 | 0.655 | 0.295 | 0.61 | 0.28 | 0.615 | 0.405 | 0.586666667 | 0.346666667 | 0.578 |
| Pupil-Teacher Ratio Sec. | 0.68 | 0.67 | 0.69 | 0.81 | 0.35 | 0.39 | 0.69 | 0.69 | 0.685 | 0.44 | 0.745 | 0.46 | 0.535 | 0.57 | 0.626666667 | 0.463333333 | 0.58 |
| R&D Techs | 0.8 | 0.29 | 1 | 1 | 0.83 | 0.71 | 1 | 0.92 | 0.9 | 0.455 | 0.9 | 0.335 | 0.755 | 0.2 | 0.836666667 | 0.26 | 0.895 |
| Rail Infrastructure | 0.72 | 0.4 | 0.85 | 0.73 | 0.54 | 0.65 | 0.86 | 0.71 | 0.785 | 0.39 | 0.725 | 0.39 | 0.685 | 0.51 | 0.7 | 0.466666667 | 0.612 |
| Rail Lines | 0.55 | 0.5 | 0.65 | 0.59 | 0.41 | 0.73 | 0.74 | 0.47 | 0.6 | 0.44 | 0.57 | 0.375 | 0.64 | 0.295 | 0.623333333 | 0.28 | 0.526 |
| Rail Traffic | 0.55 | 0.29 | 0.59 | 0.61 | 0.31 | 0.87 | 0.71 | 0.57 | 0.57 | 0.22 | 0.58 | 0.155 | 0.71 | 0.285 | 0.676666667 | 0.196666667 | 0.546 |
| Rain /yr | 0.29 | 0.21 | 0.52 | 0.42 | 0.29 | 0.33 | 0.36 | 0.57 | 0.405 | 0.265 | 0.355 | 0.205 | 0.31 | 0.17 | 0.346666667 | 0.18 | 0.41 |
| Real Housing Prices | 0.28 | 0.21 | 0.23 | 0.2 | 0.3 | 0.53 | 0.4 | 0.35 | 0.255 | 0.325 | 0.24 | 0.215 | 0.405 | 0.295 | 0.336666667 | 0.27 | 0.222 |
| Refugee Population | 0.37 | 0.25 | 0.53 | 0.75 | 0.28 | 0.39 | 0.6 | 0.41 | 0.45 | 0.295 | 0.56 | 0.315 | 0.38 | 0.29 | 0.503333333 | 0.32 | 0.522 |
| Refugees | 0.61 | 0.36 | 0.72 | 0.61 | 0.54 | 0.74 | 0.74 | 0.9 | 0.665 | 0.345 | 0.61 | 0.295 | 0.675 | 0.245 | 0.653333333 | 0.24 | 0.598 |
| Remits Received %GDP | 0.78 | 0.3 | 0.69 | 0.68 | 0.47 | 0.52 | 0.71 | 0.56 | 0.735 | 0.23 | 0.73 | 0.26 | 0.65 | 0.36 | 0.66 | 0.313333333 | 0.768 |
| Renewable Consptn % | 0.54 | 0.18 | 0.65 | 0.8 | 0.44 | 0.52 | 0.7 | 0.9 | 0.595 | 0.26 | 0.67 | 0.19 | 0.53 | 0.205 | 0.62 | 0.203333333 | 0.692 |
| Renewable Electricity % | 0.33 | 0.36 | 0.57 | 0.53 | 0.38 | 0.42 | 0.73 | 0.62 | 0.45 | 0.255 | 0.43 | 0.33 | 0.375 | 0.255 | 0.426666667 | 0.27 | 0.448 |
| Renewable Electricity % | 0.43 | 0.11 | 0.41 | 0.5 | 0.38 | 0.53 | 0.52 | 0.5 | 0.42 | 0.225 | 0.465 | 0.18 | 0.48 | 0.22 | 0.486666667 | 0.23 | 0.468 |
| Renewable Electricity % | 0.48 | 0.41 | 0.49 | 0.67 | 0.44 | 0.64 | 0.83 | 0.59 | 0.485 | 0.31 | 0.575 | 0.36 | 0.56 | 0.385 | 0.596666667 | 0.36 | 0.504 |
| Rent Housing Prices | 0.07 | 0.08 | 0.44 | 0.36 | 0.25 | 0.5 | 0.27 | 0.67 | 0.255 | 0.105 | 0.215 | 0.11 | 0.285 | 0.19 | 0.31 | 0.173333333 | 0.314 |
| Research | 0.62 | 0.4 | 0.92 | 1 | 0.58 | 0.5 | 1 | 0.87 | 0.77 | 0.41 | 0.81 | 0.325 | 0.56 | 0.315 | 0.706666667 | 0.293333333 | 0.8075 |
| Researchers | 0.89 | 0.5 | 0.92 | 0.92 | 0.73 | 0.61 | 1 | 0.92 | 0.905 | 0.455 | 0.905 | 0.335 | 0.75 | 0.355 | 0.806666667 | 0.293333333 | 0.9125 |
| Reserve in Months Import | 0.53 | 0.42 | 0.5 | 0.43 | 0.44 | 0.44 | 0.63 | 0.54 | 0.515 | 0.375 | 0.48 | 0.335 | 0.485 | 0.42 | 0.466666667 | 0.363333333 | 0.498 |
| Reserves US$ | 0.5 | 0.23 | 0.63 | 0.61 | 0.29 | 0.51 | 0.48 | 0.54 | 0.565 | 0.325 | 0.555 | 0.365 | 0.505 | 0.3 | 0.54 | 0.366666667 | 0.62 |
| Risk on Lending | 0.77 | 0 | 0.54 | 0.61 | 0.38 | 0.39 | 0.54 | 0.5 | 0.655 | 0 | 0.69 | 0 | 0.58 | 0 | 0.59 | 0 | 0.62 |
| Rule of Law | 0.71 | 0.42 | 0.86 | 0.86 | 0.63 | 0.67 | 1 | 1 | 0.785 | 0.35 | 0.785 | 0.325 | 0.69 | 0.425 | 0.746666667 | 0.36 | 0.6925 |
| Rural < 5m % | 0.31 | 0.5 | 0.36 | 0.31 | 0.27 | 0.29 | 0.5 | 0.32 | 0.335 | 0.475 | 0.31 | 0.385 | 0.3 | 0.44 | 0.303333333 | 0.383333333 | 0.326666667 |
| Rural < 5m kms | 0.38 | 0.43 | 0.3 | 0.49 | 0.4 | 0.29 | 0.4 | 0.41 | 0.34 | 0.34 | 0.435 | 0.35 | 0.335 | 0.445 | 0.386666667 | 0.386666667 | 0.39 |
| Rural <5m % Pop | 0.38 | 0.15 | 0.3 | 0.32 | 0.26 | 0.39 | 0.36 | 0.18 | 0.34 | 0.15 | 0.35 | 0.21 | 0.385 | 0.29 | 0.363333333 | 0.283333333 | 0.333333333 |
| Rural Land | 0.61 | 0.15 | 0.64 | 0.63 | 0.2 | 0.71 | 0.46 | 0.55 | 0.625 | 0.195 | 0.62 | 0.165 | 0.66 | 0.345 | 0.65 | 0.29 | 0.626666667 |
| Rural Pop Growth | 0.55 | 0.38 | 0.59 | 0.8 | 0.34 | 0.49 | 0.65 | 0.44 | 0.57 | 0.34 | 0.675 | 0.315 | 0.52 | 0.4 | 0.613333333 | 0.35 | 0.55 |
| Rural Population | 0.33 | 0.29 | 0.42 | 0.42 | 0.23 | 0.58 | 0.24 | 0.73 | 0.375 | 0.25 | 0.375 | 0.27 | 0.455 | 0.31 | 0.443333333 | 0.29 | 0.496 |
| S&P Equity | 0.67 | 0.25 | 0.39 | 0.46 | 0.25 | 0.39 | 0.81 | 0.69 | 0.53 | 0.245 | 0.565 | 0.25 | 0.53 | 0.24 | 0.506666667 | 0.243333333 | 0.498 |
| Safety Net %Welfare | 0.36 | 0 | 0.31 | 0.46 | 0.24 | 0.35 | 0.31 | 0.15 | 0.335 | 0 | 0.41 | 0 | 0.355 | 0 | 0.39 | 0 | 0.376666667 |
| Safety Net 1st 20% | 0.58 | 0 | 0.31 | 0.5 | 0.36 | 0.36 | 0.25 | 0.17 | 0.445 | 0 | 0.54 | 0 | 0.47 | 0 | 0.48 | 0 | 0.4325 |
| Safety Net 2nd 20% | 0.29 | 0 | 0.31 | 0.43 | 0.36 | 0.32 | 0.29 | 0.17 | 0.3 | 0 | 0.36 | 0 | 0.305 | 0 | 0.346666667 | 0 | 0.3075 |
| Safety Net 3rd 20% | 0.34 | 0 | 0.29 | 0.43 | 0.29 | 0.36 | 0.29 | 0.17 | 0.315 | 0 | 0.385 | 0 | 0.35 | 0 | 0.376666667 | 0 | 0.315 |
| Safety Net 4th 20% | 0.42 | 0 | 0.38 | 0.46 | 0.36 | 0.3 | 0.36 | 0.17 | 0.4 | 0 | 0.44 | 0 | 0.36 | 0 | 0.393333333 | 0 | 0.37 |
| Safety Net Top 20% | 0.35 | 0 | 0.31 | 0.38 | 0.33 | 0.3 | 0.31 | 0.15 | 0.33 | 0 | 0.365 | 0 | 0.325 | 0 | 0.343333333 | 0 | 0.2775 |
| Safety Nets | 0.35 | 0 | 0.31 | 0.5 | 0.29 | 0.36 | 0.25 | 0.17 | 0.33 | 0 | 0.425 | 0 | 0.355 | 0 | 0.403333333 | 0 | 0.345 |
| Salaried Male %employed | 0.73 | 0.23 | 0.85 | 0.92 | 0.38 | 0.49 | 0.8 | 0.85 | 0.79 | 0.29 | 0.825 | 0.2 | 0.61 | 0.275 | 0.713333333 | 0.24 | 0.696 |
| Salaries per GDP | 0.62 | 0.35 | 0.4 | 0.25 | 0.29 | 0.43 | 0.48 | 0.27 | 0.51 | 0.33 | 0.435 | 0.325 | 0.525 | 0.275 | 0.433333333 | 0.283333333 | 0.5 |
| Salaries per GDP US$ | 0.62 | 0.35 | 0.4 | 0.25 | 0.29 | 0.43 | 0.48 | 0.27 | 0.51 | 0.33 | 0.435 | 0.325 | 0.525 | 0.275 | 0.433333333 | 0.283333333 | 0.5 |
| Salary per Pop PPP | 0.85 | 0.45 | 0.83 | 0.83 | 0.47 | 0.69 | 0.92 | 1 | 0.84 | 0.355 | 0.84 | 0.36 | 0.77 | 0.27 | 0.79 | 0.27 | 0.734 |
| Salary per Population US$ | 0.79 | 0.36 | 1 | 1 | 0.62 | 0.62 | 1 | 1 | 0.895 | 0.37 | 0.895 | 0.315 | 0.705 | 0.225 | 0.803333333 | 0.24 | 0.824 |
| Salt Consumption | 0.25 | 0 | 0.25 | 0.43 | 0.31 | 0.31 | 0.33 | 0.2 | 0.25 | 0 | 0.34 | 0 | 0.28 | 0 | 0.33 | 0 | 0.31 |
| Savings %GNI | 0.75 | 0.88 | 0.65 | 0.59 | 0.44 | 0.7 | 0.75 | 0.67 | 0.63 | 0.75 | 0.88 | 0.67 | 0.63 | 0.566 | |||
| Savings Emission $US | 0.44 | 0.36 | 0.5 | 0.5 | 0.23 | 0.65 | 0.42 | 0.34 | 0.47 | 0.295 | 0.47 | 0.295 | 0.545 | 0.35 | 0.53 | 0.31 | 0.488 |
| Savings Emission Damage | 0.69 | 0.42 | 0.75 | 0.87 | 0.34 | 0.94 | 0.83 | 0.64 | 0.72 | 0.42 | 0.78 | 0.335 | 0.815 | 0.4 | 0.833333333 | 0.35 | 0.708 |
| Savings Energy Loss | 0.64 | 0.29 | 0.69 | 0.57 | 0.37 | 0.8 | 0.47 | 0.47 | 0.665 | 0.355 | 0.605 | 0.31 | 0.72 | 0.335 | 0.67 | 0.333333333 | 0.63 |
| Savings Growth $US | 0.59 | 0.27 | 0.54 | 0.61 | 0.28 | 0.63 | 0.56 | 0.41 | 0.565 | 0.24 | 0.6 | 0.22 | 0.61 | 0.305 | 0.61 | 0.26 | 0.584 |
| Savings Growth 2018 | 0.77 | 0.2 | 0.77 | 0.85 | 0.5 | 0.95 | 0.85 | 0.77 | 0.77 | 0.24 | 0.81 | 0.215 | 0.86 | 0.31 | 0.856666667 | 0.283333333 | 0.77 |
| Savings Growth GDP | 0.52 | 0.33 | 0.52 | 0.73 | 0.25 | 0.43 | 0.63 | 0.4 | 0.52 | 0.415 | 0.625 | 0.33 | 0.475 | 0.37 | 0.56 | 0.356666667 | 0.54 |
| Savings Grth 10-year | 1 | 0.75 | 0.6 | 0.59 | 0.38 | 0.87 | 0.85 | 0.67 | 0.8 | 0.645 | 0.795 | 0.565 | 0.935 | 0.585 | 0.82 | 0.516666667 | 0.682 |
| Savings w. Emission %GNI | 0.55 | 0.3 | 0.67 | 0.63 | 0.3 | 0.46 | 0.73 | 0.41 | 0.61 | 0.42 | 0.59 | 0.34 | 0.505 | 0.33 | 0.546666667 | 0.346666667 | 0.51 |
| Savings wo. Emiss %GNI | 0.57 | 0.55 | 0.6 | 0.5 | 0.4 | 0.48 | 0.73 | 0.47 | 0.585 | 0.545 | 0.535 | 0.465 | 0.525 | 0.525 | 0.516666667 | 0.476666667 | 0.48 |
| Savings: CO2 Damage | 0.56 | 0.33 | 0.53 | 0.59 | 0.43 | 0.45 | 0.47 | 0.64 | 0.545 | 0.335 | 0.575 | 0.29 | 0.505 | 0.4 | 0.533333333 | 0.35 | 0.574 |
| Savings: CO2 Damage | 0.93 | 0.42 | 0.73 | 0.73 | 0.41 | 0.87 | 0.73 | 0.5 | 0.83 | 0.35 | 0.83 | 0.335 | 0.9 | 0.36 | 0.843333333 | 0.323333333 | 0.734 |
| Savings: Education | 0.88 | 0.42 | 0.69 | 0.85 | 0.34 | 0.93 | 0.77 | 0.62 | 0.785 | 0.42 | 0.865 | 0.335 | 0.905 | 0.48 | 0.886666667 | 0.403333333 | 0.76 |
| Savings: Forest | 0.68 | 0.36 | 0.5 | 0.6 | 0.4 | 0.91 | 0.5 | 0.7 | 0.59 | 0.225 | 0.64 | 0.215 | 0.795 | 0.36 | 0.73 | 0.263333333 | 0.586 |
| School Comp Female | 0.65 | 0.26 | 0.6 | 0.67 | 0.28 | 0.41 | 0.67 | 0.6 | 0.625 | 0.22 | 0.66 | 0.265 | 0.53 | 0.28 | 0.576666667 | 0.276666667 | 0.606 |
| School Complete Primary | 0.67 | 0.21 | 0.8 | 0.73 | 0.57 | 0.52 | 0.75 | 0.67 | 0.735 | 0.355 | 0.7 | 0.185 | 0.595 | 0.27 | 0.64 | 0.233333333 | 0.6375 |
| School Completed Pri Male | 0.73 | 0.21 | 0.8 | 0.8 | 0.51 | 0.52 | 0.75 | 0.67 | 0.765 | 0.355 | 0.765 | 0.185 | 0.625 | 0.27 | 0.683333333 | 0.233333333 | 0.695 |
| School Enroll | 0.65 | 0.19 | 0.6 | 0.73 | 0.27 | 0.51 | 0.53 | 0.62 | 0.625 | 0.145 | 0.69 | 0.145 | 0.58 | 0.21 | 0.63 | 0.173333333 | 0.536 |
| School Enroll Primary | 0.45 | 0.2 | 0.69 | 0.69 | 0.41 | 0.41 | 0.62 | 0.56 | 0.57 | 0.41 | 0.57 | 0.225 | 0.43 | 0.215 | 0.516666667 | 0.226666667 | 0.604 |
| School Enroll Pri-Sec | 0.43 | 0.27 | 0.47 | 0.48 | 0.29 | 0.47 | 0.56 | 0.44 | 0.45 | 0.275 | 0.455 | 0.18 | 0.45 | 0.25 | 0.46 | 0.196666667 | 0.514 |
| School Enroll, Sec | 0.32 | 0.17 | 0.69 | 0.75 | 0.31 | 0.52 | 0.56 | 0.56 | 0.505 | 0.255 | 0.535 | 0.25 | 0.42 | 0.2 | 0.53 | 0.243333333 | 0.606 |
| School Enrolmt Tertiary | 0.65 | 0.3 | 0.87 | 0.8 | 0.6 | 0.62 | 0.77 | 0.6 | 0.76 | 0.355 | 0.725 | 0.25 | 0.635 | 0.36 | 0.69 | 0.306666667 | 0.758 |
| School Enrolmt Tertiary F | 0.65 | 0.38 | 0.87 | 0.75 | 0.54 | 0.62 | 0.8 | 0.62 | 0.76 | 0.35 | 0.7 | 0.24 | 0.635 | 0.4 | 0.673333333 | 0.3 | 0.726 |
| School Enrolmt Tertiary M | 0.65 | 0.23 | 0.67 | 0.83 | 0.47 | 0.57 | 0.77 | 0.62 | 0.66 | 0.225 | 0.74 | 0.165 | 0.61 | 0.325 | 0.683333333 | 0.25 | 0.65 |
| School Sec. Enrlmt Male | 0.87 | 0.29 | 0.85 | 0.85 | 0.57 | 0.51 | 0.92 | 0.77 | 0.86 | 0.26 | 0.86 | 0.27 | 0.69 | 0.26 | 0.743333333 | 0.256666667 | 0.708 |
| Scientific Articles | 0.55 | 0.5 | 0.69 | 0.85 | 0.5 | 0.76 | 0.87 | 0.56 | 0.62 | 0.39 | 0.7 | 0.375 | 0.655 | 0.415 | 0.72 | 0.36 | 0.6625 |
| SCP | 1 | 0.62 | 1 | 1 | 0.75 | 0.56 | 1 | 0.85 | 1 | 0.685 | 1 | 0.56 | 0.78 | 0.39 | 0.853333333 | 0.426666667 | 0.858 |
| SCP 2 | 1 | 0.62 | 0.93 | 1 | 0.54 | 0.75 | 1 | 0.87 | 0.965 | 0.71 | 1 | 0.5 | 0.875 | 0.485 | 0.916666667 | 0.45 | 0.736 |
| SCP 3 | 1 | 0.62 | 0.93 | 0.86 | 0.67 | 0.65 | 1 | 0.75 | 0.965 | 0.56 | 0.93 | 0.435 | 0.825 | 0.485 | 0.836666667 | 0.406666667 | 0.76 |
| Sec School Female | 0.49 | 0.46 | 0.71 | 0.79 | 0.53 | 0.36 | 0.67 | 0.53 | 0.6 | 0.48 | 0.64 | 0.42 | 0.425 | 0.305 | 0.546666667 | 0.33 | 0.638 |
| Sec. Education Yrs | 0.68 | 0.17 | 0.95 | 0.84 | 0.95 | 0.37 | 0.88 | 0.79 | 0.815 | 0.185 | 0.76 | 0.16 | 0.525 | 0.24 | 0.63 | 0.21 | 0.512 |
| Sec.School Female | 0.62 | 0.3 | 0.86 | 0.86 | 0.44 | 0.45 | 0.86 | 0.79 | 0.74 | 0.3 | 0.74 | 0.25 | 0.535 | 0.3 | 0.643333333 | 0.266666667 | 0.666 |
| Secondary Income | 0.64 | 0.54 | 0.87 | 0.87 | 0.47 | 0.64 | 0.92 | 0.77 | 0.755 | 0.46 | 0.755 | 0.46 | 0.64 | 0.475 | 0.716666667 | 0.443333333 | 0.762 |
| Secondary Income | 0.78 | 0.55 | 0.84 | 0.88 | 0.65 | 0.94 | 0.94 | 1 | 0.81 | 0.625 | 0.83 | 0.475 | 0.86 | 0.55 | 0.866666667 | 0.5 | 0.796 |
| Secondary Incomes | 0.64 | 0.15 | 0.61 | 0.63 | 0.35 | 0.64 | 0.67 | 0.54 | 0.625 | 0.2 | 0.635 | 0.12 | 0.64 | 0.3 | 0.636666667 | 0.23 | 0.528 |
| Secondary Private % | 0.32 | 0.24 | 0.47 | 0.4 | 0.43 | 0.41 | 0.28 | 0.38 | 0.395 | 0.295 | 0.36 | 0.31 | 0.365 | 0.26 | 0.376666667 | 0.3 | 0.482 |
| Secondary School % | 0.69 | 0.3 | 0.83 | 0.86 | 0.38 | 0.45 | 0.86 | 0.75 | 0.76 | 0.32 | 0.775 | 0.21 | 0.57 | 0.3 | 0.666666667 | 0.24 | 0.666 |
| Secondry School Male | 0.75 | 0.3 | 0.83 | 0.93 | 0.4 | 0.55 | 0.86 | 0.86 | 0.79 | 0.175 | 0.84 | 0.21 | 0.65 | 0.3 | 0.743333333 | 0.24 | 0.722 |
| Self Employed % | 0.69 | 0.28 | 0.8 | 0.9 | 0.41 | 0.6 | 0.82 | 0.8 | 0.745 | 0.35 | 0.795 | 0.24 | 0.645 | 0.3 | 0.73 | 0.266666667 | 0.66 |
| Self-employed, Female | 0.77 | 0.4 | 0.81 | 0.9 | 0.47 | 0.69 | 0.76 | 0.8 | 0.79 | 0.325 | 0.835 | 0.285 | 0.73 | 0.37 | 0.786666667 | 0.303333333 | 0.682 |
| Servers | 0.93 | 0.75 | 0.85 | 0.92 | 0.44 | 0.75 | 0.92 | 0.85 | 0.89 | 0.525 | 0.925 | 0.49 | 0.84 | 0.595 | 0.866666667 | 0.473333333 | 0.8575 |
| Servers /mil | 0.75 | 0.44 | 0.8 | 0.85 | 0.51 | 0.61 | 0.87 | 0.92 | 0.775 | 0.43 | 0.8 | 0.255 | 0.68 | 0.49 | 0.736666667 | 0.35 | 0.7725 |
| Service Exports | 0.72 | 0.47 | 0.87 | 0.87 | 0.4 | 0.6 | 0.92 | 0.77 | 0.795 | 0.425 | 0.795 | 0.36 | 0.66 | 0.37 | 0.73 | 0.33 | 0.804 |
| Service on Ext. Debt | 0.34 | 0 | 0.38 | 0.24 | 0.16 | 0.38 | 0.18 | 0.13 | 0.36 | 0 | 0.29 | 0 | 0.36 | 0 | 0.32 | 0 | 0.38 |
| Services Trade % GDP | 0.28 | 0.23 | 0.54 | 0.67 | 0.5 | 0.41 | 0.41 | 0.48 | 0.41 | 0.24 | 0.475 | 0.215 | 0.345 | 0.29 | 0.453333333 | 0.26 | 0.448 |
| Shipping Index | 0.67 | 0.31 | 0.63 | 0.73 | 0.67 | 0.47 | 1 | 0.66 | 0.65 | 0.275 | 0.7 | 0.29 | 0.57 | 0.39 | 0.623333333 | 0.35 | 0.59 |
| Short-term Debt | 0.38 | 0 | 0.29 | 0.45 | 0.29 | 0.38 | 0.17 | 0.07 | 0.335 | 0 | 0.415 | 0 | 0.38 | 0 | 0.403333333 | 0 | 0.328 |
| Short-term Debt | 0.38 | 0 | 0.27 | 0.48 | 0.33 | 0.44 | 0.42 | 0.17 | 0.325 | 0 | 0.43 | 0 | 0.41 | 0 | 0.433333333 | 0 | 0.38 |
| Short-term Debt | 0.5 | 0 | 0.23 | 0.31 | 0.15 | 0.53 | 0.23 | 0.08 | 0.365 | 0 | 0.405 | 0 | 0.515 | 0 | 0.446666667 | 0 | 0.33 |
| Slums %Urban Pop | 0.59 | 0 | 0.78 | 0.89 | 0.37 | 0.75 | 0.89 | 0.67 | 0.685 | 0 | 0.74 | 0 | 0.67 | 0 | 0.743333333 | 0 | 0.61 |
| Smart Cities Index 2020 | 0.8 | 0.19 | 0.79 | 0.88 | 0.38 | 0.39 | 0.88 | 0.89 | 0.795 | 0.2 | 0.84 | 0.15 | 0.595 | 0.245 | 0.69 | 0.2 | 0.823333333 |
| Social Contract | 1 | 0.36 | 0.85 | 1 | 0.32 | 0.65 | 1 | 1 | 0.925 | 0.37 | 1 | 0.37 | 0.825 | 0.325 | 0.883333333 | 0.343333333 | 0.75 |
| Social Contract 3 | 1 | 0.64 | 0.87 | 0.93 | 0.56 | 0.67 | 1 | 0.92 | 0.935 | 0.63 | 0.965 | 0.51 | 0.835 | 0.44 | 0.866666667 | 0.42 | 0.76 |
| Social Contract 3 | 1 | 0.62 | 1 | 1 | 0.83 | 0.51 | 1 | 0.85 | 1 | 0.585 | 1 | 0.49 | 0.755 | 0.41 | 0.836666667 | 0.393333333 | 0.766 |
| Social Contract Loss | 0.6 | 0.58 | 0.52 | 0.41 | 0.35 | 1 | 0.31 | 0.8 | 0.56 | 0.405 | 0.505 | 0.375 | 0.8 | 0.61 | 0.67 | 0.463333333 | 0.592 |
| Social Contract Product | 1 | 0.62 | 1 | 1 | 0.75 | 0.56 | 1 | 1 | 1 | 0.685 | 1 | 0.56 | 0.78 | 0.39 | 0.853333333 | 0.426666667 | 0.834 |
| Social contribs | 0.25 | 0.19 | 0.71 | 0.64 | 0.47 | 0.4 | 0.64 | 0.25 | 0.48 | 0.24 | 0.445 | 0.22 | 0.325 | 0.325 | 0.43 | 0.3 | 0.408 |
| Social Contribution | 0.5 | 0.18 | 0.89 | 0.86 | 0.48 | 0.5 | 0.66 | 0.67 | 0.695 | 0.34 | 0.68 | 0.27 | 0.5 | 0.235 | 0.62 | 0.276666667 | 0.668 |
| Social Ins. 1st 20% | 0.4 | 0 | 0.64 | 0.62 | 0.54 | 0.4 | 0.31 | 0.2 | 0.52 | 0 | 0.51 | 0 | 0.4 | 0 | 0.473333333 | 0 | 0.4825 |
| Social Ins. 2nd 20% | 0.5 | 0 | 0.64 | 0.55 | 0.46 | 0.4 | 0.33 | 0.08 | 0.57 | 0 | 0.525 | 0 | 0.45 | 0 | 0.483333333 | 0 | 0.44 |
| Social Ins. 3rd 20% | 0.5 | 0 | 0.64 | 0.64 | 0.42 | 0.5 | 0.33 | 0.08 | 0.57 | 0 | 0.57 | 0 | 0.5 | 0 | 0.546666667 | 0 | 0.5125 |
| Social Ins. 4th 20% | 0.47 | 0 | 0.73 | 0.64 | 0.42 | 0.44 | 0.31 | 0.08 | 0.6 | 0 | 0.555 | 0 | 0.455 | 0 | 0.516666667 | 0 | 0.5475 |
| Social Ins. Top 20% | 0.47 | 0 | 0.73 | 0.64 | 0.5 | 0.44 | 0.38 | 0.07 | 0.6 | 0 | 0.555 | 0 | 0.455 | 0 | 0.516666667 | 0 | 0.565 |
| Social Insurance | 0.38 | 0 | 0.82 | 0.73 | 0.5 | 0.38 | 0.33 | 0.08 | 0.6 | 0 | 0.555 | 0 | 0.38 | 0 | 0.496666667 | 0 | 0.525 |
| Social insurance | 0.6 | 0 | 0.55 | 0.64 | 0.33 | 0.32 | 0.45 | 0.12 | 0.575 | 0 | 0.62 | 0 | 0.46 | 0 | 0.52 | 0 | 0.615 |
| Social Mobility | 0.78 | 0.5 | 1 | 0.88 | 0.82 | 0.65 | 1 | 0.75 | 0.89 | 0.5 | 0.83 | 0.375 | 0.715 | 0.395 | 0.77 | 0.346666667 | 0.886666667 |
| Spending G & S | 0.56 | 0.27 | 0.6 | 0.71 | 0.44 | 0.48 | 0.55 | 0.53 | 0.58 | 0.3 | 0.635 | 0.27 | 0.52 | 0.325 | 0.583333333 | 0.306666667 | 0.566 |
| Spending G & S | 0.62 | 0.18 | 0.33 | 0.47 | 0.16 | 0.34 | 0.56 | 0.47 | 0.475 | 0.21 | 0.545 | 0.215 | 0.48 | 0.18 | 0.476666667 | 0.203333333 | 0.422 |
| Spending Gov Consumptn | 0.36 | 0.25 | 0.49 | 0.36 | 0.32 | 0.5 | 0.46 | 0.5 | 0.425 | 0.23 | 0.36 | 0.25 | 0.43 | 0.225 | 0.406666667 | 0.233333333 | 0.41 |
| Staff Tertiary Education F | 0.65 | 0.28 | 0.67 | 0.8 | 0.42 | 0.39 | 0.6 | 0.53 | 0.66 | 0.35 | 0.725 | 0.29 | 0.52 | 0.29 | 0.613333333 | 0.293333333 | 0.544 |
| Stocks Domestic % | 0.5 | 0.24 | 0.77 | 0.69 | 0.24 | 0.52 | 0.92 | 0.58 | 0.635 | 0.3 | 0.595 | 0.18 | 0.51 | 0.265 | 0.57 | 0.216666667 | 0.562 |
| Stocks traded %GDP | 0.58 | 0.24 | 0.59 | 0.66 | 0.23 | 0.65 | 0.84 | 0.58 | 0.585 | 0.26 | 0.62 | 0.245 | 0.615 | 0.3 | 0.63 | 0.283333333 | 0.53 |
| Stocks traded US$ | 0.56 | 0.44 | 0.48 | 0.79 | 0.34 | 0.63 | 0.91 | 0.58 | 0.52 | 0.36 | 0.675 | 0.345 | 0.595 | 0.365 | 0.66 | 0.326666667 | 0.536 |
| Stunting Male% | 0.32 | 0 | 0.44 | 0.56 | 0.5 | 0.24 | 0.29 | 0.2 | 0.38 | 0 | 0.44 | 0 | 0.28 | 0 | 0.373333333 | 0 | 0.3475 |
| Subsidies | 0.52 | 0.29 | 0.73 | 0.62 | 0.27 | 0.5 | 0.49 | 0.25 | 0.625 | 0.35 | 0.57 | 0.335 | 0.51 | 0.265 | 0.546666667 | 0.303333333 | 0.548 |
| Subsidies | 0.66 | 0.27 | 1 | 0.76 | 0.44 | 0.42 | 0.77 | 0.58 | 0.83 | 0.325 | 0.71 | 0.26 | 0.54 | 0.325 | 0.613333333 | 0.3 | 0.678 |
| Suicide | 0.6 | 0.22 | 0.64 | 0.61 | 0.53 | 0.57 | 0.61 | 0.5 | 0.62 | 0.225 | 0.605 | 0.26 | 0.585 | 0.3 | 0.593333333 | 0.3 | 0.616666667 |
| Suicide M:F Ratio | 0.33 | 0.36 | 0.5 | 0.31 | 0.3 | 0.58 | 0.4 | 0.25 | 0.415 | 0.43 | 0.32 | 0.28 | 0.455 | 0.325 | 0.406666667 | 0.283333333 | 0.38 |
| Suicide Rankings | 0.44 | 0.24 | 0.58 | 0.52 | 0.67 | 0.45 | 0.56 | 0.67 | 0.51 | 0.34 | 0.48 | 0.285 | 0.445 | 0.31 | 0.47 | 0.316666667 | 0.4775 |
| Surface sq. km | 0.5 | 0.35 | 0.56 | 0.75 | 0.25 | 0.48 | 0.58 | 0.54 | 0.53 | 0.27 | 0.625 | 0.29 | 0.49 | 0.295 | 0.576666667 | 0.273333333 | 0.592 |
| Surgeons | 0.73 | 0.24 | 0.8 | 0.85 | 0.44 | 0.67 | 0.67 | 0.69 | 0.765 | 0.265 | 0.79 | 0.205 | 0.7 | 0.31 | 0.75 | 0.263333333 | 0.793333333 |
| Surgery Cost | 0.69 | 0.33 | 1 | 0.93 | 0.75 | 0.74 | 0.92 | 0.83 | 0.845 | 0.45 | 0.81 | 0.31 | 0.715 | 0.34 | 0.786666667 | 0.323333333 | 0.8175 |
| Surgical Care Risk | 0.8 | 0.34 | 1 | 1 | 0.75 | 0.72 | 0.95 | 0.85 | 0.9 | 0.48 | 0.9 | 0.36 | 0.76 | 0.3 | 0.84 | 0.326666667 | 0.91 |
| Survival to 65 female | 0.82 | 0.27 | 0.93 | 1 | 0.53 | 0.41 | 1 | 0.93 | 0.875 | 0.405 | 0.91 | 0.325 | 0.615 | 0.34 | 0.743333333 | 0.353333333 | 0.82 |
| Tariff | 0.6 | 0 | 0.63 | 0.58 | 0.42 | 0.49 | 0.54 | 0.41 | 0.615 | 0.055 | 0.59 | 0.025 | 0.545 | 0.15 | 0.556666667 | 0.116666667 | 0.57 |
| Tariff | 0.62 | 0 | 0.81 | 0.77 | 0.5 | 0.43 | 0.74 | 0.7 | 0.715 | 0.105 | 0.695 | 0.025 | 0.525 | 0.115 | 0.606666667 | 0.093333333 | 0.706 |
| Tariff | 0.63 | 0.13 | 0.79 | 0.79 | 0.43 | 0.42 | 0.75 | 0.64 | 0.71 | 0.185 | 0.71 | 0.075 | 0.525 | 0.215 | 0.613333333 | 0.15 | 0.678 |
| Tariff | 0.63 | 0.19 | 0.69 | 0.57 | 0.41 | 0.5 | 0.69 | 0.52 | 0.66 | 0.18 | 0.6 | 0.11 | 0.565 | 0.245 | 0.566666667 | 0.173333333 | 0.59 |
| Tariff | 0.63 | 0.13 | 0.76 | 0.79 | 0.47 | 0.38 | 0.57 | 0.54 | 0.695 | 0.15 | 0.71 | 0.08 | 0.505 | 0.315 | 0.6 | 0.22 | 0.678 |
| Tariff | 0.67 | 0.21 | 0.79 | 0.78 | 0.44 | 0.46 | 0.82 | 0.7 | 0.73 | 0.32 | 0.725 | 0.12 | 0.565 | 0.185 | 0.636666667 | 0.133333333 | 0.736 |
| Tariff | 0.73 | 0 | 0.65 | 0.7 | 0.52 | 0.52 | 0.7 | 0.72 | 0.69 | 0 | 0.715 | 0 | 0.625 | 0.115 | 0.65 | 0.076666667 | 0.686 |
| Tariff rate | 0.63 | 0 | 0.68 | 0.73 | 0.47 | 0.46 | 0.72 | 0.68 | 0.655 | 0.125 | 0.68 | 0.015 | 0.545 | 0.15 | 0.606666667 | 0.11 | 0.696 |
| Tariff Rate | 0.67 | 0.16 | 0.77 | 0.74 | 0.44 | 0.51 | 0.83 | 0.64 | 0.72 | 0.2 | 0.705 | 0.09 | 0.59 | 0.195 | 0.64 | 0.136666667 | 0.7 |
| Tax | 0.7 | 0.29 | 0.62 | 0.69 | 0.39 | 0.46 | 0.6 | 0.64 | 0.66 | 0.17 | 0.695 | 0.155 | 0.58 | 0.335 | 0.616666667 | 0.23 | 0.6375 |
| Tax - Products | 0.57 | 0.28 | 0.69 | 0.77 | 0.44 | 0.77 | 0.75 | 0.61 | 0.63 | 0.28 | 0.67 | 0.265 | 0.67 | 0.37 | 0.703333333 | 0.33 | 0.662 |
| Tax $LCU | 0.33 | 0.27 | 0.67 | 0.47 | 0.27 | 0.42 | 0.45 | 0.4 | 0.5 | 0.28 | 0.4 | 0.26 | 0.375 | 0.21 | 0.406666667 | 0.223333333 | 0.404 |
| Tax % GDP | 0.45 | 0.09 | 0.75 | 0.66 | 0.32 | 0.33 | 0.55 | 0.64 | 0.6 | 0.185 | 0.555 | 0.17 | 0.39 | 0.09 | 0.48 | 0.143333333 | 0.612 |
| Tax Commercial | 0.42 | 0.33 | 0.52 | 0.68 | 0.25 | 0.36 | 0.33 | 0.42 | 0.47 | 0.34 | 0.55 | 0.345 | 0.39 | 0.375 | 0.486666667 | 0.37 | 0.56 |
| Tax Other | 0.57 | 0.3 | 0.4 | 0.33 | 0.33 | 0.42 | 0.38 | 0.24 | 0.485 | 0.34 | 0.45 | 0.275 | 0.495 | 0.265 | 0.44 | 0.26 | 0.422 |
| Taxes Goods & Serv | 0.38 | 0.15 | 0.46 | 0.47 | 0.29 | 0.36 | 0.36 | 0.4 | 0.42 | 0.21 | 0.425 | 0.2 | 0.37 | 0.15 | 0.403333333 | 0.183333333 | 0.414 |
| Taxes Goods & Serv | 0.5 | 0.4 | 0.6 | 0.43 | 0.37 | 0.34 | 0.56 | 0.53 | 0.55 | 0.345 | 0.465 | 0.245 | 0.42 | 0.305 | 0.423333333 | 0.233333333 | 0.542 |
| Taxes Goods & Serv | 0.53 | 0.3 | 0.39 | 0.37 | 0.4 | 0.37 | 0.36 | 0.5 | 0.46 | 0.25 | 0.45 | 0.195 | 0.45 | 0.245 | 0.423333333 | 0.193333333 | 0.484 |
| Taxes Int Trade | 0.55 | 0.3 | 0.89 | 0.75 | 0.49 | 0.68 | 0.93 | 0.8 | 0.72 | 0.375 | 0.65 | 0.285 | 0.615 | 0.22 | 0.66 | 0.236666667 | 0.534 |
| Taxes Int Trade | 0.68 | 0.11 | 0.89 | 0.89 | 0.49 | 0.67 | 1 | 0.7 | 0.785 | 0.175 | 0.785 | 0.1 | 0.675 | 0.11 | 0.746666667 | 0.103333333 | 0.654 |
| Teachers Female | 0.4 | 0 | 0.23 | 0.36 | 0.21 | 0.3 | 0.23 | 0.21 | 0.315 | 0 | 0.38 | 0 | 0.35 | 0 | 0.353333333 | 0 | 0.3525 |
| Teachers Male | 0.4 | 0 | 0.21 | 0.38 | 0.17 | 0.36 | 0.28 | 0.21 | 0.305 | 0 | 0.39 | 0 | 0.38 | 0 | 0.38 | 0 | 0.32 |
| Teachers Sec. Female | 0.48 | 0.36 | 0.87 | 0.93 | 0.43 | 0.36 | 0.67 | 0.6 | 0.675 | 0.38 | 0.705 | 0.38 | 0.42 | 0.33 | 0.59 | 0.353333333 | 0.612 |
| Teachers, Secondary | 0.47 | 0.41 | 0.5 | 0.5 | 0.21 | 0.39 | 0.48 | 0.32 | 0.485 | 0.31 | 0.485 | 0.33 | 0.43 | 0.455 | 0.453333333 | 0.386666667 | 0.512 |
| Teenage Mothers | 0.28 | 0 | 0.56 | 0.67 | 0.36 | 0.33 | 0.44 | 0.22 | 0.42 | 0 | 0.475 | 0 | 0.305 | 0 | 0.426666667 | 0 | 0.503333333 |
| Theft. Arson Loss | 0.6 | 0 | 0.5 | 0.55 | 0.31 | 0.38 | 0.46 | 0.33 | 0.55 | 0 | 0.575 | 0 | 0.49 | 0 | 0.51 | 0 | 0.4575 |
| Time to Export | 0.6 | 0.16 | 0.88 | 0.92 | 0.58 | 0.49 | 0.92 | 0.67 | 0.74 | 0.225 | 0.76 | 0.18 | 0.545 | 0.205 | 0.67 | 0.203333333 | 0.8 |
| Time to Export | 0.81 | 0.45 | 0.93 | 0.85 | 0.64 | 0.79 | 1 | 0.71 | 0.87 | 0.225 | 0.83 | 0.225 | 0.8 | 0.37 | 0.816666667 | 0.246666667 | 0.863333333 |
| Time to Import (doctn hrs) | 0.63 | 0.12 | 0.78 | 0.75 | 0.52 | 0.55 | 0.83 | 0.67 | 0.705 | 0.29 | 0.69 | 0.135 | 0.59 | 0.175 | 0.643333333 | 0.166666667 | 0.72 |
| Tot Factor Productivity | 0.68 | 0.24 | 0.75 | 0.76 | 0.67 | 0.44 | 0.83 | 0.77 | 0.715 | 0.285 | 0.72 | 0.285 | 0.56 | 0.235 | 0.626666667 | 0.266666667 | 0.6 |
| Total Debt Service | 0.32 | 0 | 0.27 | 0.31 | 0.31 | 0.5 | 0.38 | 0.38 | 0.295 | 0 | 0.315 | 0 | 0.41 | 0 | 0.376666667 | 0 | 0.316 |
| Total Fisheries | 0.35 | 0.41 | 0.41 | 0.34 | 0.29 | 0.41 | 0.35 | 0.44 | 0.38 | 0.335 | 0.345 | 0.32 | 0.38 | 0.435 | 0.366666667 | 0.366666667 | 0.442 |
| Tourism Arrivals | 0.66 | 0.54 | 0.67 | 0.79 | 0.56 | 0.49 | 0.92 | 0.63 | 0.665 | 0.385 | 0.725 | 0.395 | 0.575 | 0.48 | 0.646666667 | 0.403333333 | 0.6775 |
| Tourism Departs | 0.58 | 0.62 | 0.79 | 0.79 | 0.47 | 0.81 | 0.81 | 0.5 | 0.685 | 0.45 | 0.685 | 0.435 | 0.695 | 0.62 | 0.726666667 | 0.496666667 | 0.7325 |
| Tourism Items US$ | 0.72 | 0.62 | 0.75 | 0.83 | 0.44 | 0.87 | 0.85 | 0.75 | 0.735 | 0.56 | 0.775 | 0.5 | 0.795 | 0.52 | 0.806666667 | 0.473333333 | 0.72 |
| Tourism rcpts US$ | 0.61 | 0.47 | 0.67 | 0.83 | 0.5 | 0.5 | 0.92 | 0.67 | 0.64 | 0.445 | 0.72 | 0.425 | 0.555 | 0.355 | 0.646666667 | 0.363333333 | 0.656 |
| Tourism Receipts | 0.49 | 0.45 | 0.65 | 0.46 | 0.53 | 0.47 | 0.42 | 0.37 | 0.57 | 0.385 | 0.475 | 0.35 | 0.48 | 0.44 | 0.473333333 | 0.376666667 | 0.542 |
| Tourism Receipts | 0.65 | 0.42 | 0.71 | 0.82 | 0.35 | 0.69 | 0.93 | 0.8 | 0.68 | 0.355 | 0.735 | 0.4 | 0.67 | 0.315 | 0.72 | 0.336666667 | 0.6725 |
| Tourism Receipts US$ | 0.69 | 0.66 | 0.67 | 0.85 | 0.38 | 0.49 | 0.92 | 0.69 | 0.68 | 0.445 | 0.77 | 0.52 | 0.59 | 0.435 | 0.676666667 | 0.416666667 | 0.69 |
| Tourism Spending | 0.41 | 0.38 | 0.61 | 0.57 | 0.32 | 0.41 | 0.52 | 0.47 | 0.51 | 0.35 | 0.49 | 0.235 | 0.41 | 0.425 | 0.463333333 | 0.313333333 | 0.446 |
| Tourism Spending US$ | 0.66 | 0.62 | 0.85 | 0.92 | 0.44 | 0.82 | 0.92 | 0.77 | 0.755 | 0.51 | 0.79 | 0.5 | 0.74 | 0.56 | 0.8 | 0.5 | 0.78 |
| Tourism Transport US$ | 0.69 | 0.32 | 0.57 | 0.65 | 0.38 | 0.52 | 0.74 | 0.58 | 0.63 | 0.295 | 0.67 | 0.285 | 0.605 | 0.3 | 0.62 | 0.283333333 | 0.5975 |
| Trade % | 0.58 | 0.4 | 0.59 | 0.59 | 0.57 | 0.45 | 0.49 | 0.59 | 0.585 | 0.315 | 0.585 | 0.26 | 0.515 | 0.425 | 0.54 | 0.323333333 | 0.486 |
| Trade Balance $ | 1 | 1 | 0.8 | 0.79 | 0.44 | 1 | 0.92 | 0.73 | 0.9 | 0.69 | 0.895 | 0.655 | 1 | 1 | 0.93 | 0.77 | 0.892 |
| Trade Balance % GDP | 1 | 1 | 0.87 | 0.73 | 0.27 | 1 | 0.73 | 0.69 | 0.935 | 0.71 | 0.865 | 0.535 | 1 | 1 | 0.91 | 0.69 | 0.712 |
| Trade Balance cLCU | 1 | 0.75 | 0.66 | 0.73 | 0.47 | 1 | 0.8 | 0.79 | 0.83 | 0.58 | 0.865 | 0.5 | 1 | 0.75 | 0.91 | 0.583333333 | 0.838 |
| Trade Balance LCU | 1 | 1 | 0.73 | 0.67 | 0.34 | 1 | 0.74 | 0.75 | 0.865 | 0.71 | 0.835 | 0.535 | 1 | 1 | 0.89 | 0.69 | 0.832 |
| Trade Goods Services | 1 | 1 | 0.85 | 0.73 | 0.41 | 1 | 0.86 | 0.69 | 0.925 | 0.71 | 0.865 | 0.665 | 1 | 0.875 | 0.91 | 0.693333333 | 0.878 |
| Trade Goods US$ | 0.88 | 0.5 | 0.77 | 0.85 | 0.4 | 0.89 | 0.77 | 0.69 | 0.825 | 0.39 | 0.865 | 0.295 | 0.885 | 0.535 | 0.873333333 | 0.386666667 | 0.814 |
| Trade Merch % GDP | 0.73 | 0.58 | 0.54 | 0.5 | 0.5 | 0.59 | 0.56 | 0.36 | 0.635 | 0.355 | 0.615 | 0.39 | 0.66 | 0.53 | 0.606666667 | 0.42 | 0.548 |
| Trademark - NRs | 0.47 | 0.41 | 0.67 | 0.79 | 0.53 | 0.57 | 0.71 | 0.43 | 0.57 | 0.25 | 0.63 | 0.33 | 0.52 | 0.335 | 0.61 | 0.306666667 | 0.675 |
| Trademark - NRs | 0.69 | 0.21 | 0.62 | 0.77 | 0.44 | 0.76 | 0.69 | 0.4 | 0.655 | 0.165 | 0.73 | 0.23 | 0.725 | 0.275 | 0.74 | 0.266666667 | 0.66 |
| Trademark Apps | 0.39 | 0.42 | 0.58 | 0.69 | 0.34 | 0.85 | 0.75 | 0.35 | 0.485 | 0.33 | 0.54 | 0.335 | 0.62 | 0.39 | 0.643333333 | 0.343333333 | 0.5625 |
| Trademark Apps | 0.45 | 0.31 | 0.6 | 0.62 | 0.35 | 0.9 | 0.77 | 0.4 | 0.525 | 0.315 | 0.535 | 0.245 | 0.675 | 0.38 | 0.656666667 | 0.313333333 | 0.502 |
| Trademark Apps | 0.8 | 0.32 | 0.6 | 0.67 | 0.4 | 0.87 | 0.71 | 0.44 | 0.7 | 0.29 | 0.735 | 0.25 | 0.835 | 0.37 | 0.78 | 0.306666667 | 0.698 |
| Training Firms % | 0.34 | 0 | 0.5 | 0.58 | 0.4 | 0.19 | 0.37 | 0.31 | 0.42 | 0 | 0.46 | 0 | 0.265 | 0 | 0.37 | 0 | 0.4875 |
| Transfers from Abroad $US | 0.93 | 0.64 | 0.88 | 0.88 | 0.53 | 0.85 | 0.88 | 1 | 0.905 | 0.58 | 0.905 | 0.52 | 0.89 | 0.595 | 0.886666667 | 0.53 | 0.818 |
| Transfers from Abroad cLCU | 0.65 | 0.12 | 0.69 | 0.63 | 0.5 | 0.65 | 0.66 | 0.6 | 0.67 | 0.115 | 0.64 | 0.12 | 0.65 | 0.12 | 0.643333333 | 0.12 | 0.582 |
| Transfers from Abroad LCU | 0.85 | 0.43 | 0.82 | 0.82 | 0.47 | 0.81 | 0.76 | 0.88 | 0.835 | 0.475 | 0.835 | 0.415 | 0.83 | 0.49 | 0.826666667 | 0.46 | 0.826 |
| Transport | 0.45 | 0.41 | 0.69 | 0.61 | 0.34 | 0.47 | 0.53 | 0.6 | 0.57 | 0.505 | 0.53 | 0.355 | 0.46 | 0.41 | 0.51 | 0.373333333 | 0.574 |
| Transport % Export | 0.45 | 0.24 | 0.41 | 0.5 | 0.38 | 0.51 | 0.36 | 0.34 | 0.43 | 0.42 | 0.475 | 0.27 | 0.48 | 0.31 | 0.486666667 | 0.306666667 | 0.43 |
| Transport % svc. imports | 0.62 | 0.41 | 0.7 | 0.62 | 0.47 | 0.41 | 0.56 | 0.7 | 0.66 | 0.505 | 0.62 | 0.355 | 0.515 | 0.41 | 0.55 | 0.373333333 | 0.53 |
| Travel | 0.3 | 0.26 | 0.44 | 0.5 | 0.24 | 0.41 | 0.63 | 0.35 | 0.37 | 0.17 | 0.4 | 0.23 | 0.355 | 0.285 | 0.403333333 | 0.256666667 | 0.432 |
| Travel % svc. imports | 0.29 | 0.24 | 0.35 | 0.55 | 0.23 | 0.41 | 0.56 | 0.43 | 0.32 | 0.16 | 0.42 | 0.22 | 0.35 | 0.275 | 0.416666667 | 0.25 | 0.38 |
| Travel Services | 0.45 | 0.5 | 0.56 | 0.49 | 0.53 | 0.43 | 0.5 | 0.37 | 0.505 | 0.36 | 0.47 | 0.375 | 0.44 | 0.405 | 0.456666667 | 0.353333333 | 0.5 |
| Tuberculosis | 0.68 | 0.44 | 0.94 | 0.94 | 0.5 | 0.61 | 0.94 | 0.89 | 0.81 | 0.57 | 0.81 | 0.47 | 0.645 | 0.53 | 0.743333333 | 0.52 | 0.75 |
| Tuberculosis % | 0.48 | 0.17 | 0.75 | 0.63 | 0.27 | 0.54 | 0.75 | 0.54 | 0.615 | 0.155 | 0.555 | 0.155 | 0.51 | 0.345 | 0.55 | 0.276666667 | 0.59 |
| Under 5 Mortality | 0.77 | 0.3 | 0.9 | 0.9 | 0.6 | 0.57 | 0.9 | 0.9 | 0.835 | 0.46 | 0.835 | 0.245 | 0.67 | 0.34 | 0.746666667 | 0.29 | 0.794 |
| Undernourishment % | 0.74 | 0 | 0.79 | 0.84 | 0.47 | 0.62 | 0.79 | 0.58 | 0.765 | 0.1 | 0.79 | 0.06 | 0.68 | 0.19 | 0.733333333 | 0.166666667 | 0.7825 |
| Underweight Females | 0.27 | 0 | 0.5 | 0.7 | 0.38 | 0.44 | 0.36 | 0.2 | 0.385 | 0 | 0.485 | 0 | 0.355 | 0 | 0.47 | 0 | 0.45 |
| Unempl - Educated % | 0.69 | 0.28 | 0.61 | 0.59 | 0.43 | 0.5 | 0.6 | 0.65 | 0.65 | 0.305 | 0.64 | 0.225 | 0.595 | 0.33 | 0.593333333 | 0.276666667 | 0.61 |
| Unempl basic eductn | 0.41 | 0.34 | 0.56 | 0.57 | 0.42 | 0.31 | 0.47 | 0.44 | 0.485 | 0.38 | 0.49 | 0.23 | 0.36 | 0.22 | 0.43 | 0.186666667 | 0.432 |
| Unempl Educ Male | 0.72 | 0.4 | 0.61 | 0.59 | 0.43 | 0.42 | 0.6 | 0.69 | 0.665 | 0.305 | 0.655 | 0.325 | 0.57 | 0.385 | 0.576666667 | 0.34 | 0.63 |
| Unempl Educated Female | 0.78 | 0.42 | 0.75 | 0.58 | 0.53 | 0.53 | 0.65 | 0.56 | 0.765 | 0.37 | 0.68 | 0.325 | 0.655 | 0.42 | 0.63 | 0.356666667 | 0.628 |
| Unempl Poorest 20% | 0.49 | 0 | 0.5 | 0.38 | 0.38 | 0.44 | 0.36 | 0.09 | 0.495 | 0 | 0.435 | 0 | 0.465 | 0 | 0.436666667 | 0 | 0.456666667 |
| Unemploy Benefits | 0.34 | 0 | 0.21 | 0.33 | 0.29 | 0.37 | 0.38 | 0.08 | 0.275 | 0 | 0.335 | 0 | 0.355 | 0 | 0.346666667 | 0 | 0.293333333 |
| Unemployment % | 0.49 | 0.52 | 0.5 | 0.45 | 0.41 | 0.47 | 0.43 | 0.25 | 0.495 | 0.4 | 0.47 | 0.385 | 0.48 | 0.51 | 0.47 | 0.423333333 | 0.532 |
| Unemployment Male %male | 0.31 | 0.58 | 0.38 | 0.33 | 0.35 | 0.49 | 0.48 | 0.39 | 0.345 | 0.42 | 0.32 | 0.39 | 0.4 | 0.45 | 0.376666667 | 0.366666667 | 0.354 |
| Unemployment WP | 0.45 | 0.67 | 0.56 | 0.6 | 0.38 | 0.36 | 0.49 | 0.36 | 0.505 | 0.415 | 0.525 | 0.435 | 0.405 | 0.645 | 0.47 | 0.496666667 | 0.536666667 |
| Unemploymt Poorest 20% | 0.43 | 0 | 0.46 | 0.19 | 0.3 | 0.29 | 0.25 | 0.08 | 0.445 | 0 | 0.31 | 0 | 0.36 | 0 | 0.303333333 | 0 | 0.36 |
| Unemplymt Ttl ILO | 0.42 | 0.42 | 0.48 | 0.42 | 0.47 | 0.47 | 0.46 | 0.38 | 0.45 | 0.3 | 0.42 | 0.335 | 0.445 | 0.37 | 0.436666667 | 0.33 | 0.44 |
| Unicorn Startups | 0.47 | 0 | 0.14 | 0.16 | 0.28 | 0.38 | 0.07 | 0.3 | 0.305 | 0 | 0.315 | 0 | 0.425 | 0 | 0.336666667 | 0 | 0.3175 |
| Untrained Youth | 0.67 | 0.55 | 0.81 | 0.88 | 0.49 | 0.39 | 0.76 | 0.7 | 0.74 | 0.415 | 0.775 | 0.4 | 0.53 | 0.42 | 0.646666667 | 0.363333333 | 0.775 |
| Urban < 5m % | 0.67 | 0.35 | 0.68 | 0.63 | 0.34 | 0.31 | 0.62 | 0.73 | 0.675 | 0.295 | 0.65 | 0.265 | 0.49 | 0.28 | 0.536666667 | 0.246666667 | 0.66 |
| Urban < 5m kms | 0.61 | 0.23 | 0.62 | 0.7 | 0.27 | 0.5 | 0.76 | 0.55 | 0.615 | 0.24 | 0.655 | 0.25 | 0.555 | 0.22 | 0.603333333 | 0.236666667 | 0.643333333 |
| Urban <5m % Pop | 0.44 | 0.33 | 0.5 | 0.42 | 0.33 | 0.42 | 0.44 | 0.5 | 0.47 | 0.285 | 0.43 | 0.275 | 0.43 | 0.305 | 0.426666667 | 0.276666667 | 0.453333333 |
| Urban Land | 0.57 | 0.35 | 0.58 | 0.64 | 0.53 | 0.44 | 0.6 | 0.46 | 0.575 | 0.345 | 0.605 | 0.31 | 0.505 | 0.305 | 0.55 | 0.293333333 | 0.596666667 |
| Urban Population | 0.44 | 0.5 | 0.48 | 0.29 | 0.29 | 0.69 | 0.44 | 0.35 | 0.46 | 0.365 | 0.365 | 0.375 | 0.565 | 0.35 | 0.473333333 | 0.316666667 | 0.454 |
| Urban Population | 0.69 | 0.2 | 0.67 | 0.93 | 0.36 | 0.33 | 0.8 | 0.69 | 0.68 | 0.195 | 0.81 | 0.2 | 0.51 | 0.375 | 0.65 | 0.316666667 | 0.668 |
| Violence on Women | 0.73 | 0.23 | 0.82 | 0.82 | 0.36 | 0.41 | 0.82 | 0.64 | 0.775 | 0.115 | 0.775 | 0.115 | 0.57 | 0.225 | 0.653333333 | 0.15 | 0.79 |
| Vitamin | 0.29 | 0 | 0.09 | 0.07 | 0.21 | 0.31 | 0.17 | 0.08 | 0.19 | 0 | 0.18 | 0 | 0.3 | 0 | 0.223333333 | 0 | 0.15 |
| Vulnerable empl % | 0.76 | 0.28 | 0.8 | 1 | 0.6 | 0.69 | 0.9 | 0.9 | 0.78 | 0.265 | 0.88 | 0.225 | 0.725 | 0.35 | 0.816666667 | 0.29 | 0.696 |
| Vulnerable Empl Female | 0.69 | 0.3 | 0.76 | 1 | 0.41 | 0.69 | 0.82 | 0.8 | 0.725 | 0.275 | 0.845 | 0.235 | 0.69 | 0.32 | 0.793333333 | 0.27 | 0.666 |
| Wage | 0.68 | 0.21 | 0.85 | 0.92 | 0.4 | 0.55 | 0.77 | 0.85 | 0.765 | 0.315 | 0.8 | 0.23 | 0.615 | 0.265 | 0.716666667 | 0.26 | 0.704 |
| Wage | 0.82 | 0.3 | 0.8 | 0.92 | 0.5 | 0.55 | 0.77 | 0.85 | 0.81 | 0.36 | 0.87 | 0.275 | 0.685 | 0.31 | 0.763333333 | 0.29 | 0.662 |
| Wages Monthly | 0.81 | 0.62 | 0.79 | 0.85 | 0.29 | 0.8 | 0.85 | 1 | 0.8 | 0.58 | 0.83 | 0.435 | 0.805 | 0.455 | 0.82 | 0.386666667 | 0.816666667 |
| Wanted Fertility Rate | 0.33 | 0 | 0.38 | 0.25 | 0.38 | 0.21 | 0.31 | 0.08 | 0.355 | 0 | 0.29 | 0 | 0.27 | 0 | 0.263333333 | 0 | 0.32 |
| War Battle Deaths | 0.54 | 0 | 0.64 | 0.56 | 0.25 | 0.57 | 0.5 | 0.47 | 0.59 | 0 | 0.55 | 0 | 0.555 | 0 | 0.556666667 | 0 | 0.408 |
| Waste & Combustion | 0.62 | 0.15 | 0.78 | 0.73 | 0.47 | 0.4 | 0.67 | 0.78 | 0.7 | 0.235 | 0.675 | 0.225 | 0.51 | 0.15 | 0.583333333 | 0.2 | 0.662 |
| Water productivity | 0.79 | 0.22 | 0.83 | 0.92 | 0.48 | 0.44 | 0.92 | 0.83 | 0.81 | 0.36 | 0.855 | 0.235 | 0.615 | 0.3 | 0.716666667 | 0.283333333 | 0.846666667 |
| Wealth GINI | 0.41 | 0.13 | 0.57 | 0.61 | 0.54 | 0.45 | 0.43 | 0.3 | 0.49 | 0.195 | 0.51 | 0.18 | 0.43 | 0.215 | 0.49 | 0.22 | 0.53 |
| Wealth GINI 2018 | 0.31 | 0.17 | 0.59 | 0.52 | 0.44 | 0.34 | 0.36 | 0.26 | 0.45 | 0.22 | 0.415 | 0.22 | 0.325 | 0.2 | 0.39 | 0.223333333 | 0.473333333 |
| Wealth per Adult | 0.93 | 0.25 | 0.92 | 0.93 | 0.53 | 0.57 | 1 | 0.71 | 0.925 | 0.375 | 0.93 | 0.25 | 0.75 | 0.27 | 0.81 | 0.263333333 | 0.926666667 |
| Wholesale Price Index | 0.33 | 0 | 0.22 | 0.38 | 0.21 | 0.42 | 0.46 | 0.22 | 0.275 | 0 | 0.355 | 0 | 0.375 | 0 | 0.376666667 | 0 | 0.31 |
| Working Age % | 0.77 | 0.36 | 0.5 | 0.71 | 0.29 | 0.41 | 0.7 | 0.8 | 0.635 | 0.295 | 0.74 | 0.305 | 0.59 | 0.42 | 0.63 | 0.363333333 | 0.626 |
| Working Mothers | 0.32 | 0.18 | 0.62 | 0.3 | 0.42 | 0.42 | 0.16 | 0.37 | 0.47 | 0.28 | 0.31 | 0.28 | 0.37 | 0.23 | 0.346666667 | 0.28 | 0.3925 |
| Working Mothers Alone | 0.45 | 0.31 | 0.27 | 0.18 | 0.31 | 0.5 | 0.15 | 0.23 | 0.36 | 0.22 | 0.315 | 0.28 | 0.475 | 0.335 | 0.376666667 | 0.306666667 | 0.27 |
| Working Mothers w Partner | 0.27 | 0.16 | 0.62 | 0.29 | 0.42 | 0.5 | 0.16 | 0.37 | 0.445 | 0.245 | 0.28 | 0.215 | 0.385 | 0.26 | 0.353333333 | 0.263333333 | 0.3625 |
| Working Old % | 0.69 | 0.5 | 0.93 | 0.93 | 0.56 | 0.51 | 0.85 | 0.69 | 0.81 | 0.46 | 0.81 | 0.31 | 0.6 | 0.455 | 0.71 | 0.343333333 | 0.742 |
| Working Youth % | 0.89 | 0.55 | 0.76 | 0.81 | 0.47 | 0.55 | 0.8 | 0.7 | 0.825 | 0.39 | 0.85 | 0.36 | 0.72 | 0.515 | 0.75 | 0.4 | 0.704 |
| World Happiness | 0.81 | 0.38 | 1 | 1 | 0.65 | 0.53 | 1 | 1 | 0.905 | 0.4 | 0.905 | 0.315 | 0.67 | 0.305 | 0.78 | 0.286666667 | 0.8225 |
| World Happiness Report | 0.86 | 0.22 | 0.92 | 0.92 | 0.46 | 0.49 | 0.92 | 0.75 | 0.89 | 0.3 | 0.89 | 0.235 | 0.675 | 0.225 | 0.756666667 | 0.233333333 | 0.9 |
| Youth no school nor work | 0.73 | 0.55 | 0.8 | 0.73 | 0.63 | 0.45 | 0.89 | 0.9 | 0.765 | 0.48 | 0.73 | 0.4 | 0.59 | 0.45 | 0.636666667 | 0.383333333 | 0.7025 |
| Youth with HIV | 0.36 | 0 | 0.33 | 0.38 | 0.32 | 0.31 | 0.33 | 0.22 | 0.345 | 0 | 0.37 | 0 | 0.335 | 0 | 0.35 | 0 | 0.342 |
![]() Machine Learning and Artificial Intelligence – CSQ automates every possible comparison and combination in background scripts, that run day and night to search for the most optimal and highest probability of success measures for every country. MEMS AI presents that state-of-the-art capability to governments, regulators, finance and central banks, and schools with training as needed to ensure success.
Machine Learning and Artificial Intelligence – CSQ automates every possible comparison and combination in background scripts, that run day and night to search for the most optimal and highest probability of success measures for every country. MEMS AI presents that state-of-the-art capability to governments, regulators, finance and central banks, and schools with training as needed to ensure success.
CSQ Research Certifications and Training – For Governments, Schools, Finance, and Political Groups, understanding civic policy and investment that advances portfolios, economies, and societies is essential. Read more here …

ACT Political Parties
ACT Advance Parties are TE’s the sis-based solutions for large democracies, to ensure you will be able vote for Advance Policy. 90% of large democracies are collapsing today, so this will likely be a serious problem for most of our readers.
Threshold Analytics
We use Threshold Analytics within MEMS AI, to determine if nations are collapsing or advancing. Then we drive advance forward with policies that are proven to advance any economy AND society.
Threshold Analytics adds more causal indicator comparisons and opportunities for discussion. It also ensures that no opportunities can be overlooked. See an example of TA in our Case Study of international Constitutions.
CSQ Research’s Constitutional Case Study shows a list similar to the following, for every large-population nation’s overall Collapse and Advance status.
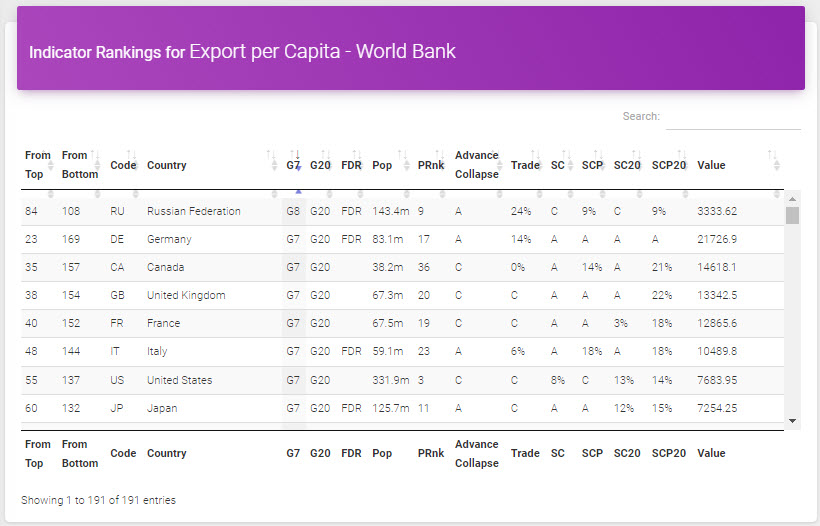
A Netherlands citizen is three times more productive than a Canadian, which means that Canada loses $3 billion every day to our lower productivity. Can you spot why this is true in the above Threshold Analytics (TA) comparisons?


Transition Economics empirically diagnoses national problems, and then fixes problems reliably in Change Projects that can professionally correct them with priority.
Find that interactive chart, and others, on the WAOH Data Science Page
Summary
With a clear understanding of important measures for every country, computer data science applications (like MEMS) can easily identify opportunities:
- for national Advance
- to correct Collapse, and …
- to set targets, that are mathematically assured to advance societies and economies reliably in every nation
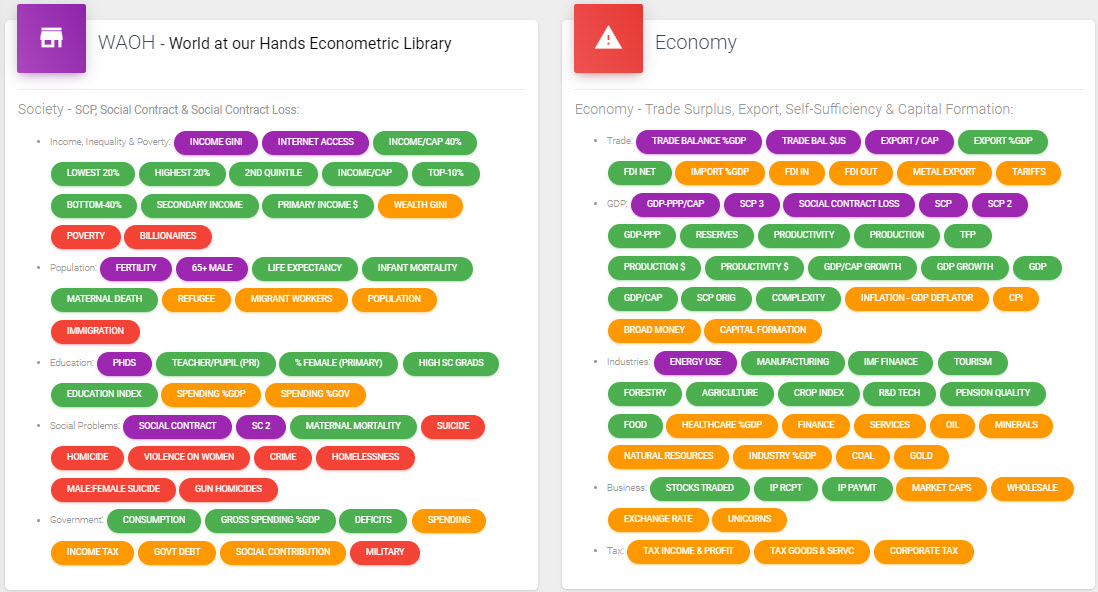

MEMS’ Panels present causality-colored buttons to observe nations from many points of view.
This simple approach ensures that:
- harmful or agenda-driven theory, ideology, or “guesswork” are discounted
- findings are truthful and important, and
- TE is a science; so, it is easily and transparently understandable, repeatable, deterministic, and teachable anywhere too
Economies are high-transaction systems, so ensuring your nation has high scores in all of the highest-probability-of-success measures, will ensure success reliably.
The “Methods” we use at WAOH to explain causality include rankings by Industry, by Causality, by Nation, by Role, and by a Strategic Planning Approach.
All of these curricula are explained in detail in The Civic Science Book of Knowledge (CS-BOK).
Important Roles and Planning
Right Plans – not Macroeconomic Frameworks, (See the World at our Hands Report) are important to build and manage in every nation
The important role of Academia is to prepare our adults and children to understand and maintain a Sustainable Society. Despite our investment in universities and in the teaching of business and economics faculties for 2500-years, however, 68% of 220 countries find that their economy is collapse-trending and that large percentages of their population are unproductive today. See TASK (The Academic Sustainable Societies Challenge).
Capitalism is a meaningless term; Herbert Hoover’s capitalism created the Great Depression, while FDR’s capitalism monetized the abundant productions that were created by the new wide opportunities afforded to citizens to be productive.
Social Contract is critical and causal to economic success or collapse in all economies and monetary system phases. A strong social contract builds a strong economy 100%; a low social contract creates a collapse-trending economy 100%.
Businesses monetize economic opportunity but are unsustainable too. Supply Chain companies must be SEEDed and all businesses need monitored, and usually regulated, for economic contribution.
Governments must also balance a hybrid system of token-passing and entirely automated non-token passing. Business and finance are unsustainable by design so monetary cycles must be actively managed.
Hybrid Economies – As automation continues, governments must transition to a completely automated provisioning of our Good Lives. Sometimes, things we need must be free, and token-based should be there for some of the things we want.
Economic Reset of our token-passing monetary system economies, so that they can balance incomes to cost of living proactively – and this will restart a fresh new monetary system cycle once again
Transition Engineering
See a full explanation of “Who does What” at WAOH – World at our Hands Report
When unsustainable policies detriment the economy and population, businesses are impacted too. GDP reports hide productivity losses – as do accounting and finance industry reporting – and bonus systems. In this way, trillions of dollars are lost annually to economies suffering from low opportunity created by their weak social contracts. Social Contract loss is estimated to cost every nation an average of $4.3 billion per day
Fruitless currency wars fail to bolster growth; populism and trade wars follow while a powderkeg of political stress can ignite into real wars.
Or, we can simply create real opportunities – without war, as FDR’s policies did.
The science of Transition Economics (TE) explains that Aristotelean Right Plans build and maintain sustainable economies and societies. Right Plans have two parts: the first part explains sustainable economic policies, and the second sustainably produces the goods, services, and well-being we all need. CSQ Research curates two engineering plans for these latter needs – Worthwhile Projects #WPProjects is a U.N.-led plan, and Worthwhile Industries is Finance and Government-led  Transition Economics ensures that only proven, sustainable Government Policy is permitted at ballot boxes, as this is critical to large democracies during mature capitalisms. It seems that small democracies can more readily recognize and vote for sustainable policies by themselves, New Zealand’s five-million population is managed without a Constitution. In today’s mature capitalism, ALL large democracies that don’t have FDR’s Second Bill of Rights in their Constitution – have collapse-trending economies
Engineering Worldwide Abundance
Managing Mature Capitalisms
 Transitions to scientific policy bring a strong strategic plan, great education, and best-practice epistemology – in project and change management processes, and reporting.
1837’s Great Depression was ended in the USA by a small population of 12 million Americans who re-invested their ten-times-increased Gold Reserves from the California Gold Rush. Citizens were allowed to be productive, and that opportunity reset the U.S. economy from a Great Depression which was worse than the 1930’s Great Depression.
These policy changes created the Industrial Revolution of the 1850s, and their success makes one realize that today’s offshore harbouring of corporate profit is not a sustainable policy.
Like then, war is completely avoidable and even “immature” in Transition Economics terminology. It only takes your vote to correct economic turmoil and RESET back to balance once again. Read about the ACT Parties to understand how to quickly implement Transition Economics Advance in any nation.
End of War is “the” goto Democratic Reform standard for a cited explanation of how we can transform our systems of democracy to work well for large populations. Larger civilizations should make life easier for everyone – in theory, but the reality is that our constitutions were designed when we were small-population nations.
These systems were not designed to prevent oligarchies, nor to prevent unsustainable policies that profit a few elites but otherwise lead to the austerity and starvation wages that created World Wars I and II. No Economic Policy is uncorrectable – in Housing, Unemployment, Welfare, Taxation, Commerce, etc. and Transition Economics explains the research and methods to make changes responsibly.
 |
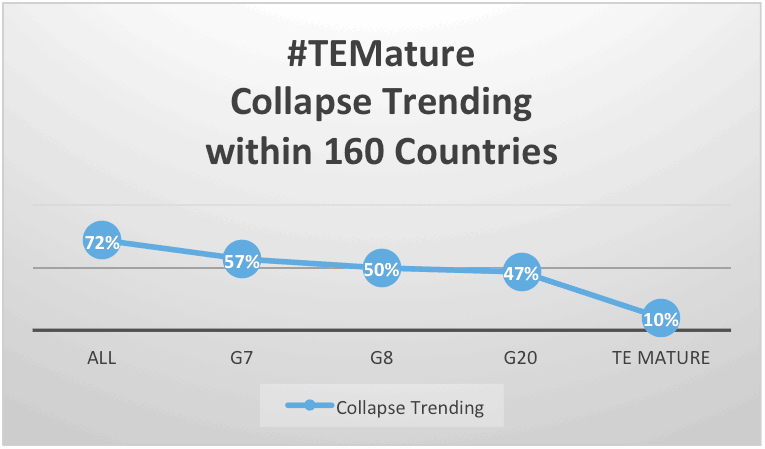 |
Click here to read about TE Maturity Modeling and TE-Mature Policy
Fully 68% of global economies were in a Collapse trending at the time of this writing. Transition Economics (TE) offers an important teaching and learning framework that explains imbalance is normal and correctable This impromptu video is out-of-date and needs refreshed, but it captures a snapshot in time during the early development of Transition Economics before a Sustainable Societies Programme was formalized at CSQ Research
Inequity stalls Growth and builds Debt
 Transition Economics is essential today because our economies have run their normal course and are no-longer sustainable by the status-quo policies that worked so well at the start of a new “boom” economic cycle in the 1950s. Government did not have to protect Social Contracts as individuals had sufficient opportunity to do this for themselves. Per the normal cyclic behaviour of 60-year repeating capitalist economies, our economy will collapse until we realize that we must change our Conservative Right Policy to permit a responsible economic reset to take place. To order the book Transition Economics, click here.
 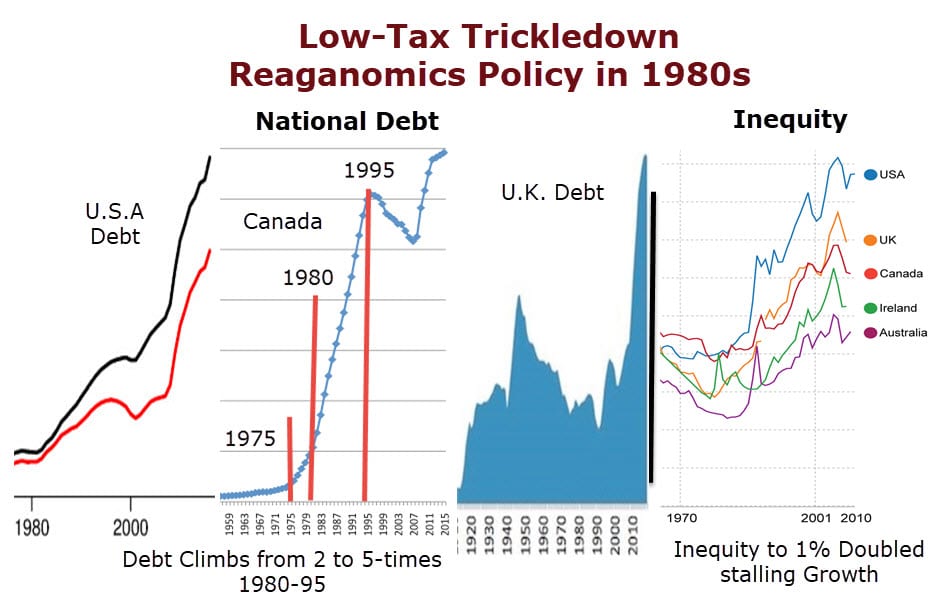 We see the same phenomenon in any Monopoly Game. Strategies that worked well at the start of a game, do not work at all near the end of the game. But if we change the rules, so that the victor returns a significant percentage of assets to the players of the game so that all can be productive and enjoy the game, this game can continue sustainably for an indefinite period of time.
In the Transition Economics chart above we see Opportunity is a waving black line; high at the beginning of a cycle and low in a mature capitalism. TE-Mature Policies vary – from capitalistic, monetizing policies early on in the cycle, back to sustainable, affordable policies as needed to reset Opportunity. These adjustments have resulted in a steady line of Opportunity in Norway, Ireland and most small-democracy and Monarchy-led nations today.
Credible Economists recognize Longwave cycles of economic boom and bust, as documented 40-times back to Ancient Babylon on the Code of Hammurabi (1763 BCE) and in Leviticus 25/26. TE Maturity Models and TEP Charts discuss #TEMature policies that sustain Spring Economies and avoid Winters altogether, but if these steps are not taught to governments and not enacted, Winter Phase economies MUST switch to a number of key new policies in housing, in guaranteed reverse-tax incomes, and in automation engineering supports which can safely and responsibly restore incomes, spending power and restart a new and viable Economic Cycle once again – without war and revolution. 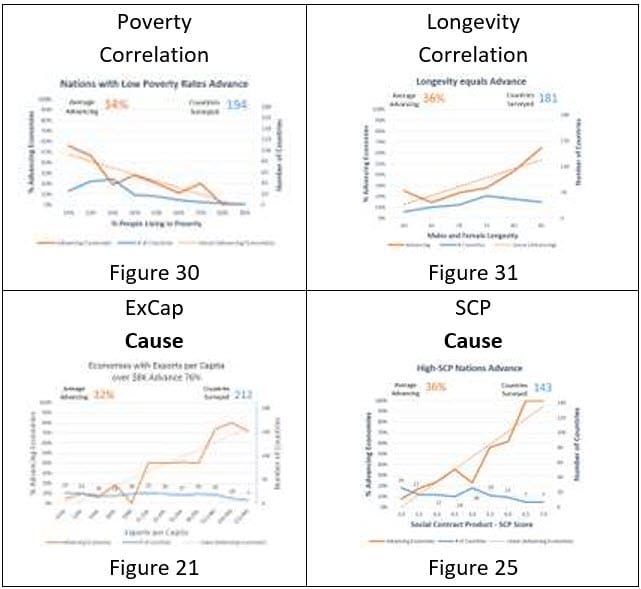 Failing this Transition, economies continue right along a collapse-trending – until either “new wealth” (as in the California Gold Rush example above, which ended the Great Depression of 1837), or responsible government policy intervenes. Without these resets, we have seen wars / revolutions / populism / dark ages and similar disastrous events reset the economic cycle by distributing wealth forcefully. This is what John F. Kennedy explained in 1962 …
“Those who make peaceful revolution impossible will make violent revolution inevitable”
Mature capitalisms are normal, predictable, and correctable – and so are the wars and hardship they create. Once we teach our high-school students (and future voters) the strategies that proactively prevent these collapses, we should be able to maintain a sustainable capitalism indefinitely. The quicker and more thoroughly we reset to a new 60-year Financial Cycle, the quicker we will all realize a Good Life in a new boom economy. 
Transition Economics – Simple, powerful, and truthful
Any Science must be defendable by observation. Transition Economics’s approach is observed to have worked well in Monetary Systems over a period of 4,000 years of historical records.  A new Science needn’t seem intimidating to us. In the words of Sir Isaac Newton, the founder of two sciences – in physics and in mathematics …
Truth is ever to be found in simplicity, and not in the multiplicity and confusion of things
In TE, an indicator’s causality can usually be confirmed with a simple frequency distribution TE Proof chart that any grade-9 student can create, and we rank all causality scores using data science lessons that a grade-12 student can learn in a spreadsheet or computing course as well
Causality through Indicators and Indices
Transition Economics Proof (TEP Charts) and historical studies are based on individual Indicators – and on Indices / Indexes. Similar to the S&P 500 Index, a TE-Index can be based on a thematic grouping of indicators. Social Contracts, are the basics that everyone needs – food, shelter, reliable incomes, security, healthcare, education, etc. To build this index we consolidate indicators measured for the past 60-years in every country – education, longevity, inequity, suicide, and poverty We can choose from a large number of social well-being measures – and thirteen social problem measures as well, and the best indexes become causal measures. A causal measure is one that we can rely upon to determine is a nation advancing or collapsing-trending. A causal measure builds strong economies 100% of the time when high, and collapses economies 100% of the time when low – see the following charts as examples Indices measure topics not easily captured in a single measure and they can also turn seemingly intangible qualities into quantifiable measures as well. For example, we can compare Production vs Consumer Economies, Social Contracts, Social Contract Loss, and a Social Contract Product (to pair against) GDP Do strong Social Contracts build advancing economies consistently? To answer this question, we use transparent Transition Economics (TE) Proofs (TEP) Charts. See how these indicators were selected in the thesis End of War):
 |
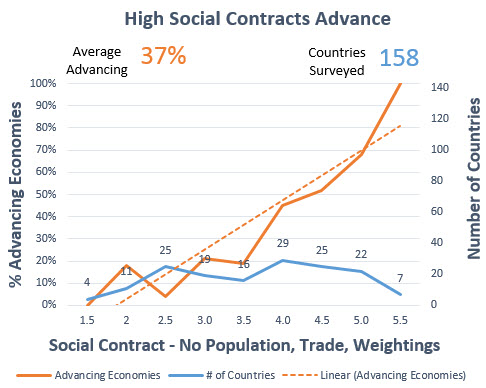 |
TEP Charts are frequency distributions; these specific TEPs survey 158-countries to confirm that high social contract nations have advancing economies – both reliably and progressively – up to 100% of the time These TEP Charts show something else too. Not only do strong social contracts increase the probability of an advancing economy (see the right upper orange line), but weak social contracts increase the probability of a collapse-trending stalling economy too (seen on the left side of the orange curve). In a TE Proof Chart, every plot is a survey of the number of countries indicated on the blue line here The Social Contract measures the most economically beneficial social measures of an economy:
| Social Contract |
= |
 Education Education |
+ |
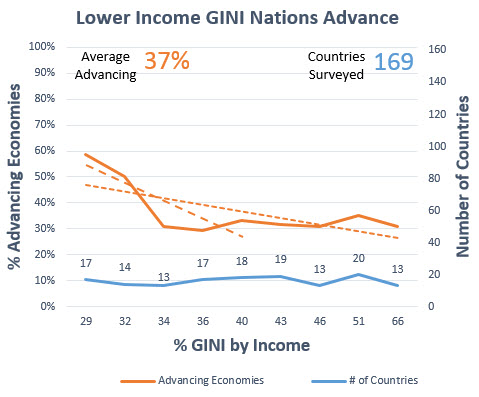 Income Inequity Income Inequity |
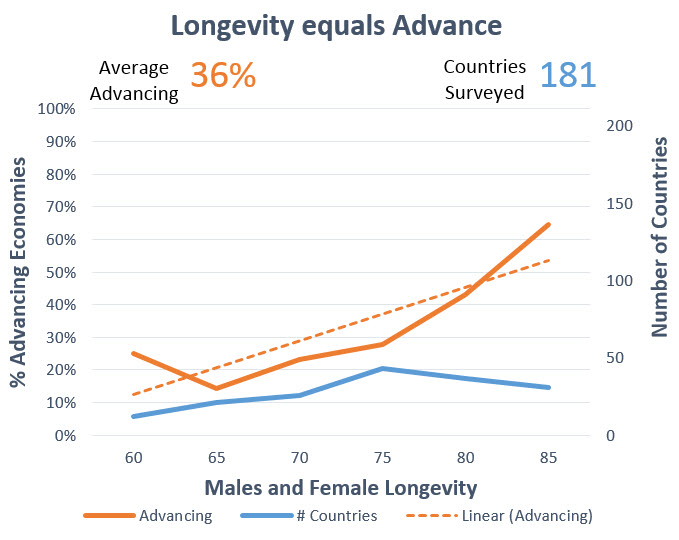 Longevity Longevity |
 Suicide Suicide |
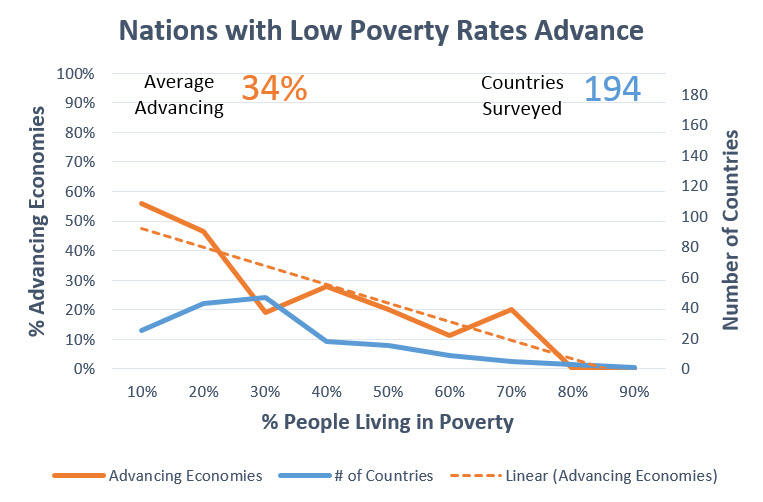 Poverty Poverty |
The SCP Report (Social Contract Product), adds the most beneficial financial measures to Social Contract:
| The SCP Report |
= |
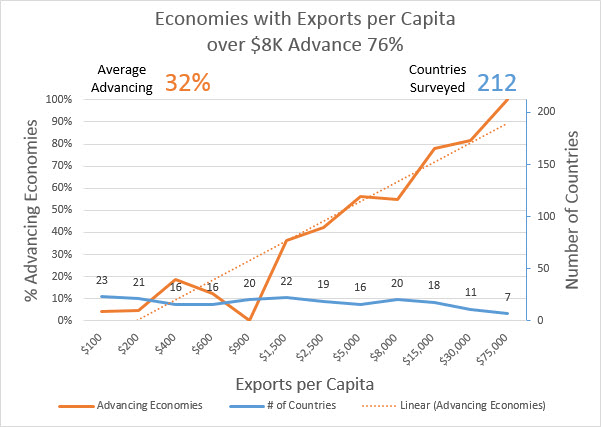 Export per Capita Export per Capita |
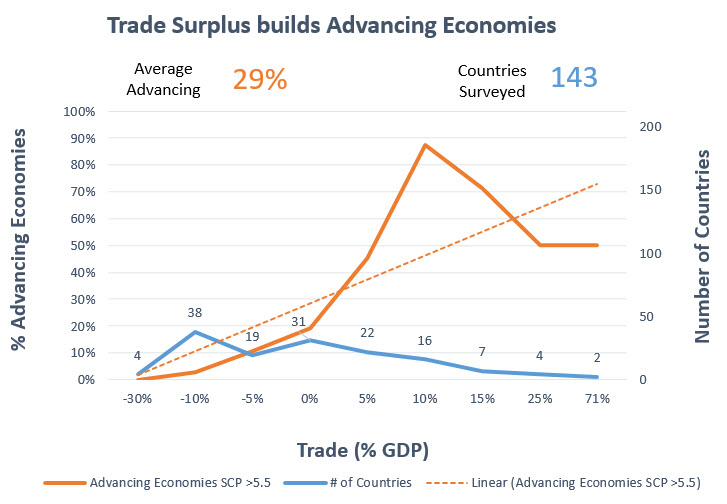 Trade Balance Trade Balance |
 Debt Debt |
+ |
Social Contract |
Are these truly the best measures of successful economies? For 2019 we didn’t have the World at our Hands Report , we didn’t have scoring – which is a ranked list of every available TEP Chart Survey, that we have now, and we didn’t have MEMS. In 2021, we know a lot more and we can revise the SCP and Social Contract Reports to include the best social and financial measures possible. Today, 100% of The SCP’s top-20 countries have advancing economies; that’s a much better indicator of economic success than the GDP, HDI/IHDI, or other Happiness Index reports offer today Indexing cautions are obvious but sometimes subtle too. One cannot hope to measure the importance of Export – based on Export per Capita; checking an indicator with itself is an obvious problem. Similarly, one cannot measure high-income nations based on gender stats easily because fertility rates are unsustainable in 94% of high-income nations.
MEMS‘ capabilities now permit TE to seek and find “perfect” causal aggregate indicators from a dozen and more indicators, and to see their trendings over time as we see here. 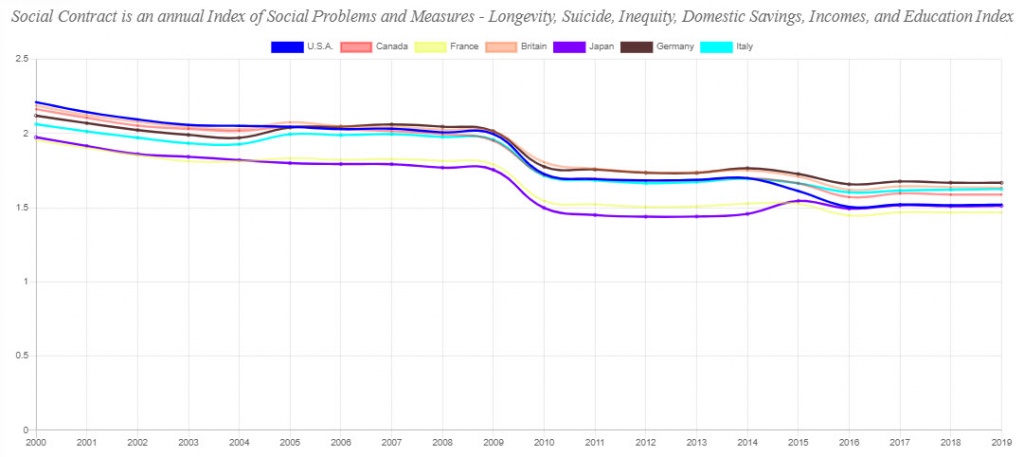 A causal indicator can be monitored to ensure that our national and regional economic development and business investment programs – are successfully improving an economy. CSQ posts a subset (25,000 causal aggregates) on WAOH, and then combinations of six aggregates or more are available with MEMS.
  TE takes the guesswork out of Economic Development and presents important new opportunities too.
Opportunity – by Nation, by Industry, and by maximum benefit
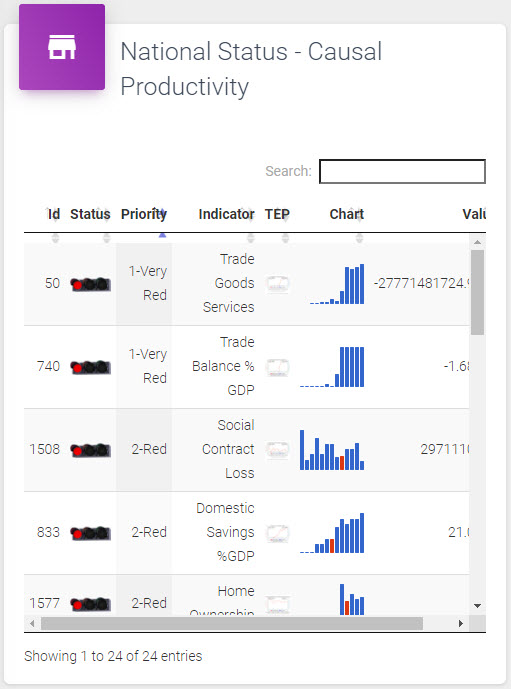
TE permits us to view Opportunities easily; by nation, by industry, and by social and economic impact (priority and importance) as well. Only our imagination constrains the scientifically valid and valuable insights that can be summarized using a quantitative TE approach.
The World at our Hands Report
A complete library of TEP Surveys resides in the WAOH – World at our Hands Library. Researchers are invited to contribute to the library and CSQ Research publishes updates on a regular basis
Cause and Effect
 Russian Economist Nikolai Kondratieff noticed that monetary system cycle Longwaves also coincided with technological advances. Economic opportunity, capital, and strong social contracts became the cause for the effect of a boom in technological innovation.
The Great Depression of 1837 was a Great Depression as bad as 1930s’ and worse. It was ended by the California Gold Rush which multiplied the Gold Reserves in the U.S. ten times. This great infusion of capital meant that banks could extend lending easily to engineering firms and industrialists as was needed to build the Industrial Revolution of the 1860s.
Similarly, the high opportunity climate of the 1960s inspired the Cold War’s greatest advances in history. With no war to slow research and unlimited resources afforded to them, scientists created some of the greatest advances that mankind have ever known in the short span of just 25-years.  Economies – both good and bad, are caused by something.
Transition Economics’s approach is to use TE Proof Charts – TEPs for short, and similar infographic tools to understand how dramatically does any policy contribute to, or cause, an advancing economy.
As it makes little sense to compare your country to other’s with failing economies, we compare every policy to understand “is it a correlation with”, and “does it cause an advancing economy” as well.
A policy with a strongly causal relationship to advancing economies builds a steeply verticle TEP Chart, and less economically beneficial policies, build a flatter and more horizontal chart. All policies are then ranked by causality (the probability of this indicator building advancing economies). See End of War – Managing Mature Capitalisms for a better explanation in Chapter 4.
How to Read TEP Charts
TEP reports don’t have to be causal to yield valuable insights into what works and what does not work from country to country.
Billionaires (see WAOH and TEPs) is a fun study in evidence-based science. It’s not a causal indicator, but there are interesting lessons here just the same.
In the 67 countries that participate in this study, nations with 36 to 44 billionaires have the highest probability of advancing economies. Nations with 264 to 614 billionaires have the lowest chance of advance

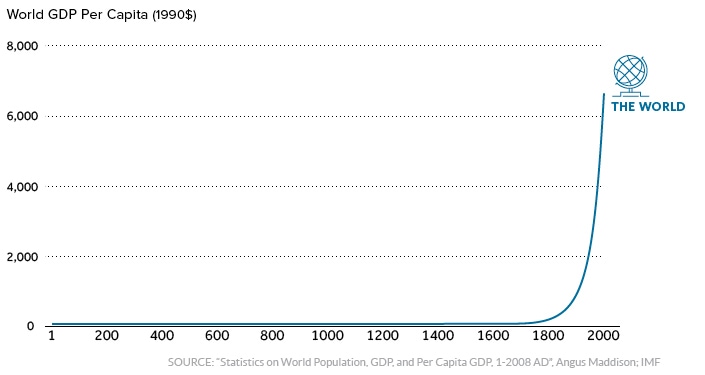
Explanations for this go back to leadership fundamentals. If Billionaires pay living wages and empower production, opportunity, and high social contracts – as did Henry Ford for example, they are a benefit. When they do not – as we saw in the First Industrial Revolution (1750-1800), they are a detriment to economy AND to society
Policy |
How to read TEP Survey Charts and to assess Causality |
DebtTEP Score = .20 |
Little credibility – Sustainable but not significantly so, as we see in international surveys. More context is needed to understand managing debt. Debt forgiveness is normal part of economic resets – as recorded in the 1930s and as recorded in 4,000 years of written record
|
Export % GDPvs Export per Capita TEP Score = .55 |
Yes – Export is generally Causal, but not in all circumstances
“Advancing Economies” are a measure of nations with positive Trade Balances. For this reason, one can expect a comparison of Exports vs Trade Balance to look causal unfairly; see the TEP chart of Trade Balance here to visualize this. To accurately assess causality in this case, refer to the Social Contract measures and other CAUSAL indicators that have no Export component (a list of TE Causal Indicators is shown below). When you make this comparison, you should find that high income nations suffer at higher levels of Export as a percentage of GDP (above) – and more investigation may be warranted. Next steps will be to analyse exports for trade surplus nations only, and similar comparisons will help to determine that current export targets and strategies are optimal |
Education Index & PHD Attainment |
Yes – Causal
|
Higher Averages and Lower Averages |
Some survey groups have a higher average number of advancing economies – like High Income Nations, and other survey groups have lower average probabilities of advancing
|
Sweet SpotsFinancial Industries are helpful to a point – and then harmful after that “sweet spot” |
Some Indicators are Causal to a point, but not beyond that point
|
+- Zero |
We often see benefit in changes both positive and negative
|
| A Wall, Russian Voting Collusion, Chinese Virus? <Insert any other for-TV Drama here> | No – We can also call these reports the “Hate Agendas”. Messaging like this is most often used to suggest there are sides, opposites, better and worse, black versus white, etc. when in fact there is only one “side”. The simplest fact is constant – “Mankind is our Business” as Mr. Dickens put it so well. The most important and sustainable policy is Empathy and Respect – Good, as the Bibles term it. Immigration, like Laissez Faire in Business – for two examples, are unsustainable policies. This means Laissez Faire policy is allowable and even beneficial, but only during economic boom periods, and not at other times of imbalance like today’s mature capitalism Sustainable Societies really are just that simple to maintain – always vote for sustainable policies at times of imbalance, and then you can relax these controls during boom times so as to capitalize/monetize abundant opportunity |
GDP, Stock Market Performance, Unemployment, Right & Left Policy, Supply & Demand, Disposable Income |
NOT CAUSAL – Misleading MessagingTE categorizes “Political Opportunism” Reporting because none of these reports are causal to an advancing economy, yet Politicians use them because they can easily be made positive. These reports are used to mislead democracies who are not educated in sustainable policy, to advance themselves – see a fuller explanation in The World at our Hands Report Econometric Library in the “Reports” tab |

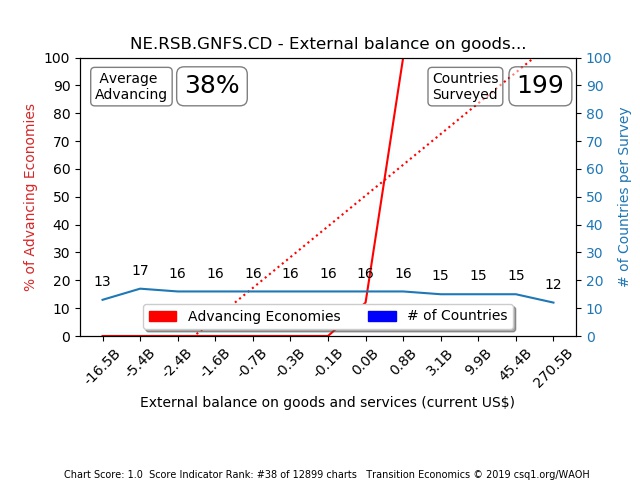
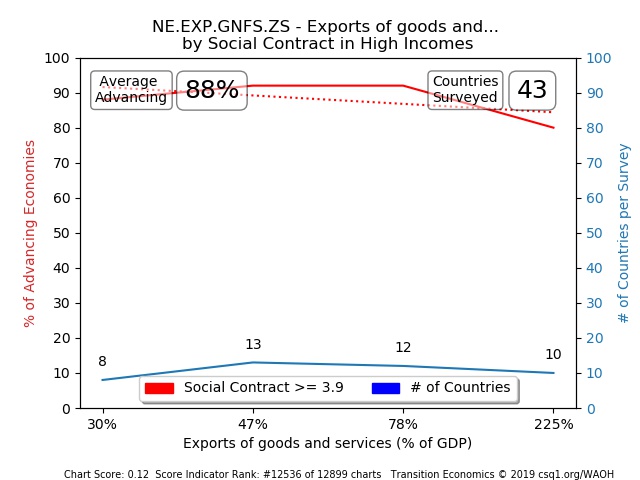

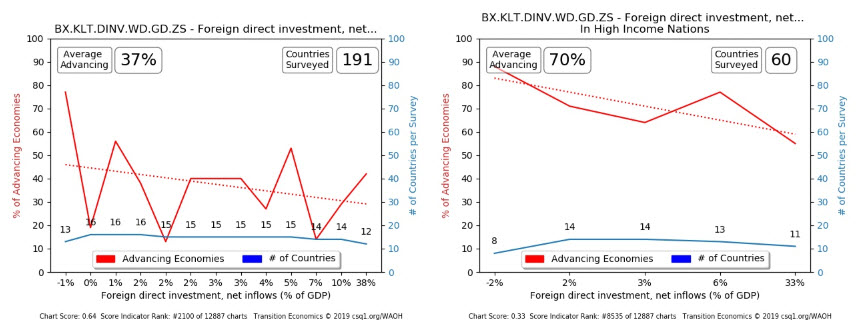
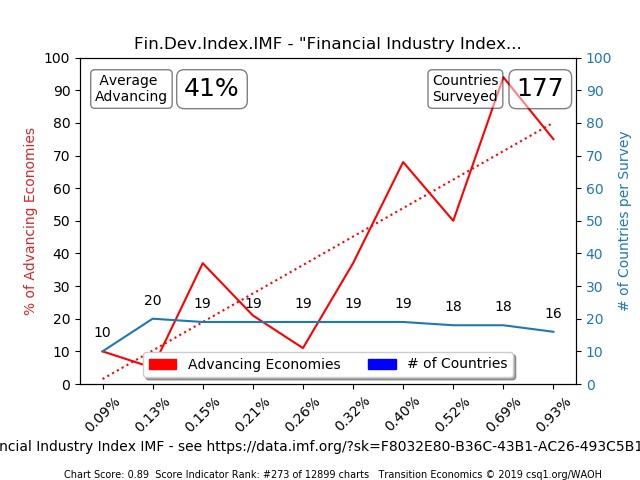
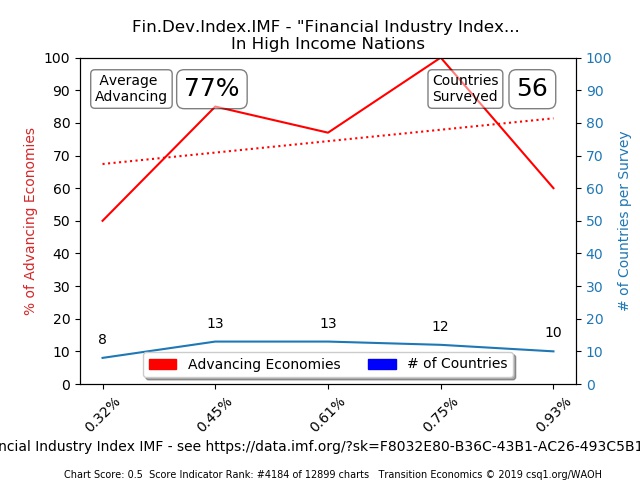
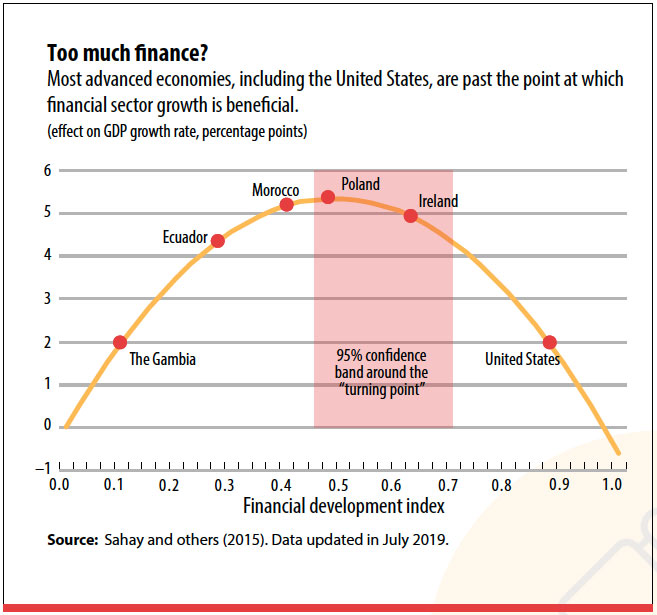
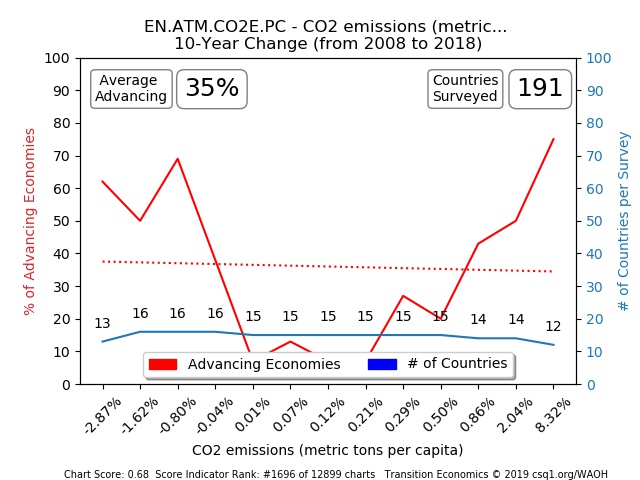
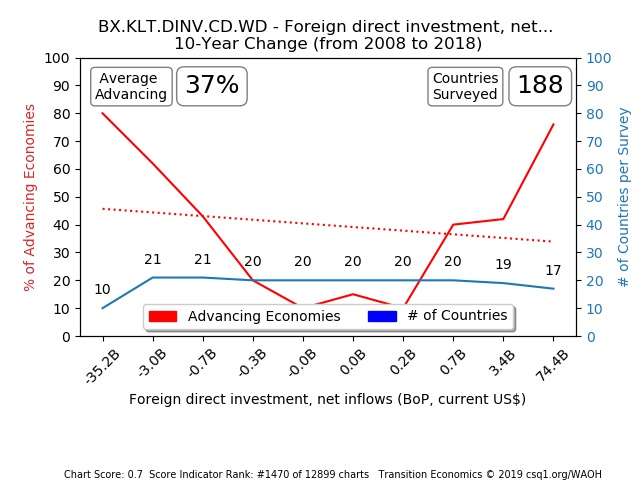
Collapse and Advance in TE?
In TE, Advance and Collapse are measurable terms required to permit data science to identify causality, problems, and more importantly, how to correct the problems that are today collapsing 90% of large democracies.
Its important to note that we want to care much for the collapse and advance status of highly causal indicators, and we want to care less for low-causality measures – because changing these scores can improve economies with only a lower probability of success. This is the purpose and value of Threshold Analytics in Transition Economics; TE-TA measures national economic status and planning by the most causal indicator reports (not only/exclusively, but it treats causal indicator improvement with priority).
Important information can be gleaned from a non-causal TEP survey – like Billionaires – for example. Billionaires is a low-causality indicator, so we are not too concerned when this report is not advancing within a country, but we do want to notice what number and percentage of Billionaires creates more advancing nations.
Advancing indicates that a survey indicator (measured in one country) is scoring above that indicator’s threshold. An example of a national indicator is “Longevity”, or “Education”, or “Age 65+ males”, and you can read the Science of 70% to understand how thresholds are determined for each indicator.
Collapsing indicates that an indicator measure is currently scoring below that indicator’s threshold.
Simple. Now, what if an indicator score changes? What if:
- A collapsing score improves from the previous year?
Has it surpassed its threshold?- Yes – then it is advancing
- No – then it is trending toward advance but still collapsing
- An advancing score falls from the previous year?
Has it fallen below its threshold?- Yes – then it is collapsing
- No – then it is trending toward collapse but still advancing
- A nation’s score is exactly at threshold? It’s Advancing Marginally
Identifying and improving causal scores is essential
For a highly causal indicator, an advancing marginally score is no reason to breath easy. Economies are high-transaction systems, so policies that barely advance a nation will continue to keep that nation moving forward at a snail’s pace.
The determination that a country is collapsing is no insult, rather its a call to action that problems are being hidden and change is needed AND essential as well.
NEVER vote for a government that permits problems to be hidden, as we clearly are today. The cost is far greater than you realize (see this citation here).