 – Civic Science is the Science of Truth")


Transition Economics (TE) is a new, easy-to-learn, game-changing science. Where Economics is old, theoretical, unscientific, non-deterministic, proven-false logic and belief-based consensus or indoctrination, TE is education in evidence‑based civic data science that is simple, confirmably truthful, and proves that forwarding policies with a higher probability of advance can double economies reliably.
Transition Economics is Education
Economies are Driven to success or to failure, to Advance or to Collapse, by the measurable policies that we employ in common national pillars of education, government, lawmaking, infrastructure, engineering, social contract, human rights, commerce, and trade. Transition Economics explains:
- The Indicators that are important to reliable advance (5% of 1600 measures)
- Unimportant Indicators (are 95% of these measures), and
- Harmful measures; the indicators that will collapse us reliably
Why does it work? More here
Economies are high transaction systems, so a highest probability of success Advance Policy is guaranteed to advance the system measurably.
An Advance Policy in Civic Science is a regulation or program that improves an important indicator’s national performance. Similarly, a Collapse Policy is guaranteed to collapse any economy.
A Casino insists on Advance Policies (higher probability of success rules) in every game. This is why “the house always wins” in a busy casino.
Micro and Macroeconomics’ Wealth Theory explains tactical proven-failed theory and forecasting from the viewpoint of a business. They do not confirm that their measures are important in reality, and don’t define or report economic or social collapse. As a result, the preventable collapses that we can see for ourselves all around us today, never reach their proven-failed reports.
Problems are simply ignored so that collapses can continue to profit their sponsors, while economists and Central Banks report “All is Well”.
Transition Economics is very different. TE utilizes survey-based data (reality), it drives Collapse to elimination, and it drives national advance to optimal measures. This is why we say that TE is Strategic and Drives Advance
TE doesn’t need economic models to wonder will an economy correct itself, it reliably drives economies to Advance instead
Jump to “How does it work?” here
A New Science

It’s not very often that we get the opportunity to learn a completely new science. Most sciences are natural sciences, and Transition Economics (TE) is the far more important “hard science” in Civics.
Biologic sciences have matured for millennia, and yet how many people die of biological illnesses today? Natural sciences cannot prevent war, ensure good, respect, and human advance (World Peace) as can a reliable evidence-based civic science.
Civic Science makes applied natural sciences (like Engineering, Physics, and Medicine) possible
Civic Science is researched and taught by Civic Scientists, and an entire wing of Civic Science research is given to correcting Collapse Motivators; civic practices that reliably collapse our societies. Many of these harmful practices originate in the theory-based indoctrinations of Western University faculties of Law, Economics, Business, Finance, Government, Education, Medicine, and Social Studies, so we address curriculum corrections.
CSQ Research is home to Transition Economics. CSQ provides monitoring and certification of political groups, governments, regulators, businesses, pensions, investment, and schools, to prove that they contribute to national advance – and to ensure that they work Strategically, and not against themselves, their nation, and human advance unintentionally.
Professors versus Experts – When an Engineering Professor teaches proven physics or material science that advances humanity; he is an expert. When an Economics or Business Professor teaches proven-false theory that collapses humanity reliably – as we see today, and calls it truth and reality to students, he is not an Expert; he is not an Educator – he’s an Indoctrinator. Today, 75% of Western university degrees are issued by Civics Faculties that collapse 90% of large democracies and harm society reliably by teaching false ideologies instead of reality. Civics is Law, Economics, Business, Finance, Education, Government and Social Studies. An expert of fiction is an expert of nothing. See Education Reform
Jump to “How does it Work” here …
Economies are Driven, Not Forecast
Transition Economics permits us to determine if any measure is a high-causality (important) indicator by scoring its frequency distribution based on the 70% threshold of another causal indicator

Transition Economics (TE) is a call for action
Today, we must change (transition from) the indoctrinations that we teach as truth and reality in Civics Faculties (Economics, Law, Finance, Business, Government, Social, and Education) to education in evidence-based Civic Science
See: Education at WAOH
Educational Reform: The Doctors of Indoctrination
Our Computational STEM Science Problem
Transition Economics – is a simple evidence-based computational STEM Civic Science
Economics, Business, Law, Government, Education and Social Sciences – are a collection of harmful math-obscured, belief and logic-based Wealth Theory ideologies, and ISMs that Western universities and political groups tenure professors and fund universities, to indoctrinate students and collapse societies with
A few examples include:
“Business Profit” – is unimportant because it does not advance an economy, while “Productivity” reliably advances any nation
TE proves that Nationalism and self-sufficiency are important, and that globalism and indoctrination (harmful ideologies / false idols) should be protected against
Monarchy is the most important type of government this past 25-years, offering citizens free education, free healthcare, no homelessness, often no income tax, and the wealthiest citizens in the world; while 90% of large democracies are collapsing – for the last 40-years
Visit the WAOH Public Civics Library for a long and ever-growing list of truthful, confirmed-in-reality, Advance Policies
Math is the wrong tool for Economics
Mathematics is great … at simple problems with defined inputs
Math is terrible … at understanding the trillion transactions and thousands of inputs in an economy
Why?
Consider that there are at least two ways to determine the probability of a coin toss resulting in either a Head or Tail
Method One – is to toss the coin many times and record its result (computation). A RAND Random number generator on a spreadsheet will allow this 10 times or 10 million times, and your result will usually be 50% with a 1% rate of error
Method Two – is to use Math. One result (Head or Tail) divided by the two options (1/2 = 50%)
Some struggle with math’s fractions, but they are simple when you think of a physical apple pie sliced once to create two large pieces. Each person gets half, or if we think of one pie as 100%, each gets 50%, or 1 of the 2 pieces of pie
Math is a language. So, it can be used to lie or to tell the truth – even when the math itself is correct. Once you learn to understand it, math looks as normal to you as your native language
Math is NEVER truthful, nor science, until its claims are also verifiable in the real world. This report below proves that Economics has only created a hidden Great Depression for decades, and math is similarly responsible for decades of documented unproductive and false Peer Reviews and a Replication Crisis in most academic fields

In Western Economics, Micro and Macroeconomics’ Wealth Theory, assumes that Capital means money and profit incorrectly. Capital is meant to describe productive assets only, like a herd of cows whose value increases through reproduction or more cows every year; or manufacturing, etc. Profit, inflation, and bubbles are not Capital
The Manhattan Project ran into this same limitation with Math, and resorted to a computational Monte Carlo Method for reasons similar to an economy’s need for Transition Economics
Economists are like a Victorian Doctor
Think of a Victorian Doctor (circa 1859), bleeding and administering Mercury and Laudenom as a cure-all to their patients – because this is the accepted best-practice taught to them by the Academy. This explains today’s Economists and Central Bankers the same.
Microeconomics tries to explain the viewpoint of a Business (Supply & Demand, Cost, Salaries, Profit, Labor) while Macroeconomics explains a national view – Consumption/Production, Trade & Trade Balance, Government Spending, and Investment (GDP, Finance Accounting, Markets, Budgets).

In any monetary system, Businesses have access to nearly ALL money, In large Democracies, Oligarchies win power because the biggest budget election campaign will usually win. So, when national or multinational Business Lobby Groups (Super-PACs) are permitted to use their profits as election contributions, they can win power, control politicians and regulators, control public spending, media, and can also replace education in school curricula with ideology indoctrinations (see Wealth Theory and DEI).
Unregulated Businesses INVARIABLY AND MEASURABLY prioritize their tactical wants ahead of the strategic needs of a nation‘s society and economy – with policy decisions like Scale-up/Trickledown, Scarcity/Abundance, Social Contract, Open Markets, Offshoring, Immigration, Regulation/Laissez Faire, Taxation, etc.
Banks are parasites in a monetary system to start with. They don’t produce anything, and when they can actively stall national productions with extreme Risk Averting Trickledown schemes that protect parasites at the expense of a productive society – as we see today, we either need to 1) have a PROs and CONs discussion about Digital Currencies that make banks unnecessary, or 2) we need to regulate the performance of each bank’s contribution to national productivity individually.
Large Democracies easily create a timelessly unempathetic System of Government called Oligarchy, which is why 90% of democracies over a 20 million population (48 of 54) are collapsing today. Monarchies don’t permit these collapses, which is why ALL Monarchies have out-performed the G7 nations for the last 25 years. This also explains why our schools teach us that Monarchies and Civics lessons from the Bible – are bad.
It’s Not Fair
 It’s very unfair – and ultimately counter-productive to national and human advance, to not teach all of a democracy’s voters how a nation’s advance and collapse can be measured credibly – when they are in school. 200 countries post the performance results of their legal, educational, medical, and government systems. Did you notice that the US economy and stock markets are always higher in an election year? Or that GDP, Unemployment, and Stock Market Performance reports are meaningless to economic advance – and misleading too? Yet, these are the reports that we hear about exclusively during any election campaign.
Who benefits? No-one. Where is the benefit in permitting elections to lie to citizens to convince them that their collapsing economy is never better (managed) than it is? Citizens die when a government’s performance is poor, so problems need to be solved credibly – and corporate Oligarchy manipulation of school curricula, media propaganda, and lawmaking is only ever tactical and self-serving at everyone’s expense.

Whoopi never explains that her ideologies create the greatest population cull in human history today
How can we solve these problems when even supposed experts – Professors, PhDs, Prime Ministers, and Presidents – have no clue how to build a country well; when Lawyers and Judges have no notion of where laws come from; and when elections incent, reward, and reinstall the same unqualified, under-performing, unaccountable groups that hide collapse to retain power and imbalance? Hiding collapse wins elections for a time, and then any civilization collapses to a biblically bad end – like the Roman Empire, the Persian Empire, Venitian, Babylonian, British, and many other civilizations like them.
Today, everyone is losing; the USA loses $30 billion daily; Canada $4 billion, and Britain $7.5 billion; and these losses have been hidden and unreported for a decade. Saudi Arabia and UAE have no homelessness, no income tax, free healthcare and education, strategic planning, and some of the richest citizens in the world – with a bigger economy than Canada because they have a functioning government. (csq1.org/waoh#SCP)
Too many compromises; too many theories called “real”; and too much misguidance incented by irresponsible Business, Political Groups, Schools, Grants, and Awards
Civic Science is the Solution
Science – is widely defined as “systematic and formulated knowledge”, but a more credible definition of science also explains that science is observable and real. Science is truthful, and it must be provable by anyone, anywhere as well. This was Aristotle’s contribution in his explanation of the Deductive Method and Posterior Analytics in his “Organon” writings (around 325 BC) which a 17th century Francis Bacon later called “The Scientific Method”.
Was Thalidomide science? No. It was a theory (to ease morning sickness) forwarded without scientific rigour to human trials with detrimental effects upon our society. At no time was Thalidomide science, and at no time were those who rushed their theory onto pharmacy shelves – for profit – “Scientists”.
All sciences begin simply and then mature with time in both their application and complexity. To ensure a useful lifespan, the proven truths explained by a simple observable science must always be protected during this growth, learning, research, experimentation, maturity, and evolution.
“Truth is ever to be found in simplicity and not in the multiplicity and confusion of things.” – Sir Isaac Newton
Anyone who has ever created a science understands the importance of this statement – and, likely, you have never heard this before because we do not teach students how to create science today.
Sir Isaac Newton’s book “Principia – Mathematical Principles of Natural Science”, introduced scalar and vector measures (Physics) for the first time in 1687 and we have been building on that start for 350 years now. Pythagorean Theory 530 BC, Trigonometry 190 BC, Sin, and Cosine Laws are 10th century AD sciences, Calculus, Darwin’s Theory of Evolution 1859, Alan Turing’s electro-mechanical and digital computers 1943, 1982’s Sabermetrics by Bill James, and so on – all started simply, and then we continued to be build on those starts with greater (and lesser) success.
To say that our schools need Education Reforms today is a gross understatement. See csq1.org/waoh#education-reform
The Nobel Prize for Economic Science was created in 1971 as a separate spin-off of the Swedish Central Bank. Alfred Nobel’s grandson has fought the misappropriation for his entire career and this committee has never once awarded an actual science in Economics.
Logic is one thing, and Common Sense is another
Theory is 100% fiction until it can be proven real, truthful, and science – by repeatable observation in the real world. Math is not science, Logic is not science, and Peer Review has been an obvious fraudulent test in all civics faculties since the 1980s.
How else to explain 40 years of consistent collapse?
TE is THE SOLUTION
Transition Economics does not need theory, it employs Grade 5 math (instead of today’s unnecessary double-integral calculus academics), and is responsibly governed to ensure that its scientific Standard of Research and Knowledgebase remains observably credible and validatable by anyone anywhere anytime
If you are curious to understand how indoctrination got such a stronghold in our educational institutions, consider McMaster University’s recent $50 million bursary for a “Leadership College” – to teach students “classic theory” (Harmful ideology: Neoliberalism)
Why is evidence-based science not accepted by universities and search engines today?

Useless maths and obfuscation
Unfortunely, in life and in career, the West now moves forward only the low-testosterone, unquestioning followers that can graduate their degrees.
A Brookings Institute survey found that 60% of admissions are female and that 60% of males will drop out of their 4-year degree studies. Schools ignore male physiology’s 10-times higher testosterone levels, maximize memorization testing (while never teaching memorization training), run courses that are too long, too expensive, and filled with useless harmful theory and math that is NEVER applicable in the workplace
Schools cannot, or choose not, to introspect – or to measure – their performance in this regard. Systemic indoctrinations in curricula are so severe that today, we can confirm that universities do not teach education in 75% of degree programs
The Graduates of these programs will only go on to harm the public with their trainings for an entire career and voting lifetime
Why is this happening?
- Economics Professors are mathematician theorists who are unqualified to teach a computer science-based civic science
- Grad schools actively block new STEM science from reading in civics faculties at every major university. Cite: Our Academic Mediocracy
- All major online search engines block new science today. Search Google, Bing, Wikipedia, etc. for “Transition Economics” to confirm this for yourself
- Education Reform – is the highest priority today as students are trained to follow and never lead, and to never question obvious indoctrination, and not education, in curricula
Civic Science Scientific Journal
Check out Civic Science Magazine, CSQ Research’s Civic Science Scientific Journal

Civic Science and Transition Economics
TE explains the computational principles of Civics – in faculties of Law, Constitutions, Government, Business, Finance, Education, Social Studies, and Economics – to confirm which indicators and government policies are important, or not important, and it explains which policies are harmful too.
Evidence-based – means measured in the data collected similarly by all countries and consolidated for analysis by many centers internationally.
Civics 101 – Constitutions, Human Rights, and Books of Law – must build Good, Respect, and Human Advance in any society. Ethics and good values are:
- Good – is systemic empathy in actions and laws for every citizen. Evil – is systemic failings of empathy. We should always protect against harmful ideologies and collapse motivators
- Respect – the Golden Rule – treat others as you want to be treated; respect parents, wives, husbands (family values and heads of households), teachers, employees, neighbours, and travellers
- Human Advance – Building – and the shepherding of a strategic prosperous civilization and future
TRUTH, never judges performance from within a silo
Civic Science – Civic Data Science measures the performance of production and problem management in 220 countries, to confirm which combination of Civic Policies create advance reliably in any country.

No-one can credibly state that their Education System, Training, Legal System, Political System, Democracy, Elections, Capitalism, Investment, Commerce, Governance, etc. are working well, when:
- Civics 101 (above) is not implemented nationally, and
- comparisons with other advancing nations prove that local systems are hobbling or collapsing the country. A silo approach is 100% ALL that Universities teach students in collapsing Western nations today, which is why 90% of large democracies are collapsing
We never explain to lawyers “Where do laws come from?” and we don’t explain the measures that validate they are performing their duties well – or even responsibly.
Credentialed graduates of silo’d programs are experts of harmful ideologies and indoctrinations – so experts of fiction entirely, and they will harm society for their entire careers and voting lives. DEI and ESG are examples of Indoctrinations being thrown out of offices across the Europe and Western nations today.


Solving this Problem needs Civic Science Certification and Regulation which can ensure these individuals retrain in proper Civics, and understand the threat that their current “training” creates for everyone’s well-being and future.
Civic Sciences – like Transition Economics are essential because they confirm which measures are causal (important) and can influence / change (advance or collapse) an economy.
Causality drives any high transaction system – and an economy is a very high transaction system.
TE is “hard science” that becomes an essential foundation for our civilization when Civic Science Faculties provide Governance (Performance Management) that ensures consistent human advance across all civic faculty curricula.
When Civics Faculties begin to teach lessons that collapse societies as they do today, Civic Science Faculties call out their tactical, theory-based curricula for replacement with strategic scientific replacement.
 TE is STEM – Evidence-based Economics is a Science, Technology, and Engineering faculty. This makes current theorists, mathematician economists, and professors defend against its adoption vigorously. Why? Because Economists are unqualified to teach STEM computer data and visualization science. This is why MEMS is offered to Universities, Government Policymakers, and Regulators – to help transition them over this hurdle.
Common Sense – is the social benefit of our decisions. Simply put, decisions or policies that advance community (economy and society), are examples of common sense decision-making.
TE assures Common Sense – Transition Economics is Civic Data Science that measures social benefit – to economy, society, and humanity’s advance, in all of its best practices and teachings. Common Sense is also called Social Accountability, Impact, Social Contribution, and World Peace.
TE Experts are Leaders – High IQ (Intellectual Quotient) and High EQ (Emotional quotient) individuals can both be sociopathic serial murderers or Prime Ministers. High CSQ (Common Sense Quotient) individuals are Leaders. CSQ Research is named as it is because we research Civic Science and Leadership.
In the Workforce: Economists, MBAs, and Accountants are trained in harmful Wealth Theory exclusively; economists block civic science in universities – as does Google, Wikipedia. and most Academic Journals too. Experts of harmful fiction are experts of nothing – and are certainly not leaders. See Education Reform
In Academia: Academics are career and lifelong followers who only block evidence-based science’s adoption and reading in our Grad Schools today. Citation: Educational Reform
Is there a test for Common Sense Quotient – similar to IQ tests? Yes – we have long had the questions ready to build and score a comprehensive CSQ Test. The web-based CSQ Testing Program hasn’t yet found a funding sponsor, so stay tuned – and also keep this project in mind the next time you are asked to suggest new programs to philanthropic organizations.
Civic Scientists are experts of STEM and evidence-based Civic Sciences like Transition Economics. Reality, Fact, and measurable, observably true Science, as opposed to sponsored theory, consensus, uninformed logic, ideologies indoctrination, and guesswork.
 CIVIC SCIENCE RESOURCES

- InvestCS.com – High Performance Algorithmic ETF & Funds designed to boost the major index companies and economies of 20 countries. Let CSQ Research manage an Economy Doubling financial portfolio for you today.
- MEMS – is the “Tesla” of Civic Science today. Find the most important measures of success for every country — and their current status, with MEMS
- Transition Economics – Evidence-based Transition Economics (TE) explains the simple and truthful civic science that save every nation $4 billion while restoring good, respect, and human advance in every nation reliably.
- WAOH – is the most-important evidence-based context-qualified econometric library in the world
- Civic Science Magazine– is the only Scientific Journal mandating evidence-based Civics and Civic Science Research exclusively
National Civic Leadership
Evidence-based Civic Science Faculties are the essential governance teams at work in every university needed to performance manage the curricula of Law, Economics, Finance, Business, Government, Education, and Social Studies – to ensure that they are contributing to, and not detracting from, economies and societies – by teaching “isms”, harmful ideology, false theory, and indoctrination
Powerful Insights
The UAE is 1/100th the size of Canada with 1/4 its economy. It has outpaced G7 nations for 25 years with no homelessness, no income tax, free healthcare, and free university. Almost all Monarchies can say the same
90% of large democracies are collapsing today – citation
Civic data sciences provide the certainty, causality, determinism, and truth, that only a science can offer
Productivity – builds strong economies reliably. This is an insight learned in econometric science, where Micro and Macroeconomics’ Wealth Theory, Profit, and Oligarchy-led principles hide problems and collapse nations reliably. Citation: Proof
 |
|
|---|---|
 |
Common Sense and Civic Science
Common Sense: is the social value of our decisions (our policies), so TE can measure and improve common sense also
Values: “Good, Respect, and Human Advance” in Leadership, Policy, and Law, is another insight of TE, which is proven to ensure advance for any nation 100% (see WAOH)
Science: is truth and reality; it is measurable, observable, and repeatable by anyone and anywhere. It explains the same conclusions and solutions, starkly contrasting the proven-failed ideology-based Classic Economics theories that western universities teach today
So, why are we not teaching that evidence-based civic science is essential in all faculties of Economics, Business, Finance, Social, Law, Education, and Government Studies?
Micro and Macroeconomics, Relationship Economics, Environmental Economics, Doughnut Economics, Supply & Demand, Profit & Cost, Labor, scarcity, GDP, scale-up trickledown, finance accounting, open markets, etc. – is not science. Curriculum was assumed to be important logically, but was never confirmed to assure human advance in evidence-based survey and observation
There is no evidence to support that any of this curriculum builds an advancing economy, and there is much evidence to confirm that wealth theory collapses economies reliably only
Aristotle’s Scientific Method calls proven-failed theory “fiction” for an important reason. Today, all economies lose $4 billion US per day on average, and the USA loses $30 billion (53% of their economy). The lessons in our universities were assumed to be true, and then logic and math were heaped on top of these theories until mathematics became obfuscation entirely
“Economics studies how a horse should move, not how it does move” – citation sought

Graduates by Gender – A Failing Grade for Universities and Colleges
In Academia, Marx and Friedman are unscientific indoctrinations. Why? Because none of their terms and approaches are measurable or supported by evidence. Harmful ideologies like Neoliberalism in the 1920s, created the Great Depression and collapsed every society in history, yet our universities teach that this indoctrination is education today
We don’t teach the proven Constitutions, Laws, and Bills of Rights that FDR used to build the greatest economy in history just 70-years-ago, which were taken from the 4,000-year-old scientific civics texts that these academics also dismiss as religion
The Constitutions of the USA and Canada created the Great Depression and today’s hidden Depression as well. It was FDR’s Second Bill of Rights that created the greatest economy in history
Educators have become Doctors of Indoctrination today. Courses are too long and expensive, dropout rates are too high, lessons are theory-based in 75% of credentialed programs, and we are recreating another irresponsible and expensive Tytler Cycle by not training responsible civics and human advance


In Public Policy: The observed collapse of 62% of 207 economies before COVID, means that a chimp with a dartboard has a statistically higher probability of choosing successful policy than a degreed economist does today; and this is a revelation that Harvard University econometric scientists have also begun to acknowledge in 2020 as well
In Business: Tactical business practices collapse societies today while Strategic business targets must advance economies, portfolios, and societies together
In Constitution: Right and left is theory, ideology, division – and, therefore, a weakness. There is only one “side” and that side is Advance. Most of today’s political groups offer collapse 100% and should be legally blocked from appearing on ballot cards
CSQ Research offers Certification and Monitoring Programs that ensure Political Parties can only run Advance Policies
Vote only for Advance Policy – anything else is socially irresponsible
In Science: Good, Respect, and Human Advance – are measures proven to build successful societies reliably. Other explanations amount to theory, ideology, and religion
Zero Dangerous and Expensive Theory
Belief-based theories and ideologies can be dangerous, expensive, can empower poor leadership, and are irresponsible when we have reliable scientific alternatives. Wealth Theory, Marxism, Libertarian Neoliberalism (Transition Economy), Individualism, Left and Right, pro-democracy, anti-Monarchy, are ideologies, narrative, guesswork, and also lying – that create broad social collapse internationally today

Perhaps surprisingly, the Bible was scientific. Its “Revelation” used storytelling to warn us not to “tattoo ourselves” with the names of economic powers (“the Beast”) who would then subjugate us as slaves to owners, as we did throughout 1,000 years in the advance-less medieval dark ages
A Father, Son, and Holy Spirit were teaching tools that trained illiterate populations: Good, Respect, and Human Advance because these core values and behaviours were proven to build advance through 2,000 years of civic rise and fall
In the universities of collapsing nations, peer-reviewed curriculums mandate double-integral calculus to teach theory that actively ignore these lessons. This is a troubling problem. Calculus is a fine tool, but its also an unnecessary complexity that appears in Social Grad Schools only to obfuscate fictitious, failed economic theories
“What I want you to understand is the national debt is not the only cause [of declining economic conditions in America]. It is because America has not invested in its people. It is because we have not grown. It is because we’ve had 12 years of trickle-down economics. We’ve gone from first to twelfth in the world in wages. We’ve had four years where we’ve produced no private-sector jobs. Most people are working harder for less money than they were making 10 years ago. It is because we are in the grip of a failed economic theory.”
Bill Clinton, 1992
Fortunately, the scientific study, performance management, and improvement of economies and societies – is simple; and is so obviously credible that no sophisticated maths are needed to fake an appearance of credibility
Evidence-based social and economic studies require simple statistics, quality control methods, and some data science automation
Once you learn a civic science, you’ll never allow your educated self to be flimflammed by theory again
TE IS DIFFERENT
TE measures all available indicators and then scores and ranks them transparently:
1. GDP is a 2,000th of 24,000 ranked reports
2. GDP Growth – is a 1,200 rank report
3. GDP-per-Capita ranks 300th
4. GDP-PPP-per-Capita – 100th rank
5. Export-per-Capita – 200th Rank
6. Social Contract – is a #1 Ranked measure
In evidence-based science, social measures can be equally and more important than economic measures:
1. Aged 65 male – 210th rank
2. Internet Access – ranks 361st
3. Longevity – 600th rank
4. Mortality male – 879th rank
5. Electric Power Consumption – 1065 rank
6. Energy Use – 2004th rank
See WAOH Data Science for a full list of all measured rankings
Truth-tested, context-validated, top-ranked measures are called Causal Indicators. These are the measures that economic development groups should use (have the highest probability of success) to find problems, to make corrections, and to sustain reliable advance in any country
 TE steers collapsing economies into turnaround. It actively drives advance, whereas Western academic economics builds theory-based mathematical models to predict where status quo policies are likely to take us in 10 years, very unproductively
TE directs human advance; TE creates it – using policy proven to ensure the highest probability of success, and it’s the job of SUSTAIN Project Management to ensure that the changes created by automation or political policies, only safeguard citizens and minimize social impact and the collateral costs of collapse
Lessons Learned
These are TE’s scientific “Lessons Learned”. Transition Economics uses the most-meaningful Causal performance measures, to compare the success of all policies at work in every nation
220 sovereign countries make decisions about the same policies every day – home ownership, lending rates, inflation, business laissez-faire, regulation, export, import, taxes, education, healthcare, on and on
TE measures the economic and social performance resulting from their policy decisions, to confirm the policy targets that can advance nations reliably
TE is also simple and accessible, respecting Isaac Newton’s premise that:
“Truth is ever to be found in simplicity, and not in the multiplicity and confusion of things”
Transition Economics could not be developed within academia and a Case Study documents its refused reading by eight major international university Grad Schools
As TE works very well, this surprising refusal created an extensive research paper and study of Academia’s counter‑productive defense of a $4‑billion loss per day international status quo. See that research article – “Our Academic Mediocracy”
As it turns out, Transition Economics stands in vaulted company in this way, because Einstein’s Theory of Relativity (e=mc2) stood for 20 years before being acknowledged by Western academics outside Germany similarly. We discuss the obstacle of “Adoption” below
Why can TE Double Economies?
Join the MEMS Double Your Economy Challenge
 Transition Economics can double economies reliably – as we see in the pie chart reports of Social Contract Loss
Watch the movie MoneyBall (2011) to understand how game-changing is a survey-driven computational approach to professional baseball
Casinos are widely regarded as fail-safe businesses, and yet this reliable success is not based on winning every transaction either. Casinos are successful only when they have a high volume of transactions as this ensures that their high probability of success games can win more often than lose for the house. Every seat in a casino has a probability attached to it, and the casino can only fail when insufficient players play their games
An economy is a high transaction system that assures near-unlimited transactions, so mathematically beneficial policies will always create advance within an economy – as a mathematic certainty. The same is true in reverse too, as an unsustainable policy or a policy with a low probability of success, will reliably collapse any nation also
This is the reason that ACT Parties and CSQ Certifications for Political Parties are so important, as they ensure Governments only run policies proven to Advance nations
Transition Economics allows nations to improve policies that have a higher probability of creating an advancing economy and society
If Economics was a Science
If today’s Western University Economics curricula was a science, could we all live sustainably within the prosperous American Dream of the 1960s?
Could we all live on this earth with abundance, without social problems, and without wars?
Could we build World Peace reliably?
The correct answer to these questions – is Yes
We could have 3 hour work days, 2 day work weeks, dark factories (autonomous supply chains)
Policy creates social and economic advance or collapse 100% – Edward Tilley, CS-BOK
Education never creates collapse, only Indoctrination does
America is collapsing today, alongside 90% (47) of 54 large democracies that are also collapsing, but in the 1960s the USA built the strongest economy in history – with a low Financial Inequality, and high Social Contract society. Today Norway, Ireland, Germany, Italy, Japan, and the Netherlands maintain high social contracts – and all have strong economies despite a global mature capitalism in most other countries. China is self-sufficient, productive, and advanced easily through and beyond a COVID pandemic. So, clearly a successful mix of policies exists for any economic era
Making Economics a science is important. Most of our 220 countries share the same problems, so we want to not rely on guesswork or proven failed theory
In large democracies, Right and Left policies are meaningless, and the people who would divide us with indoctrination, ideologies, and fiction in academic curricula must also misreport, omit, and mislead voters as their collapse policies harm the public. Unsustainable policies collapse any nation reliably and the mature capitalisms that are created by them are mathematic certainties that are expensive, dangerous, preventable, and correctable also
Every problem is solvable
The first step in solving any problem is realizing you have a problem – Zig Ziglar
Transition Economics Proves What?
TE is a deterministic, predictive science that surveys 1,600 indicators and indexes in 220 countries – and we sometimes consider centuries of historical data as well
Transition Economics takes the advice of the creator of two new sciences, Sir Issac Newton – to keep science simple. A causal indicator can usually be confirmed with a simple frequency distribution chart that any grade-9 student can create, and we rank causality scores with data science lessons that a grade-12 student can learn easily as well
With a TEP Chart, we can confirm that nations with a high Social Contract score have an advancing economy 100% of the time, while a low-scoring Social Contract nation has a collapse-trending economy 100% of the time. This tells us that the indicator “Social Contract” might be a causal indicator, so next …
- We determine causality using economic measures only – these measures have no social components, like Export per Capita, Trade Balance, GDP-PPP per Cap, Production, … see WAOH Data Science
- Then we ask “Is the indicator causal using social measures only” as well. There are many causal (important) measures that are social entirely – Social Contract, Maternal Death Rate, Living Wages, Savings, Deaths under age-5, Internet Access, Salaried Males, Longevity, … see WAOH Data Science for more.
- When an indicator proves causality by economic and by social measures, next we validate that the indicator created successful economies elsewhere or in history by observation
For other indicators that are similarly causal, see csq1.org/WAOH
Wealth Theory’s GDP, Stock Market Performance, Supply, Demand, Cost, Profit, Labour, CPI, Consumption are not causal indicators – and most are meaningless in quantitative analysis.
Productivity indicators like Social Contract, are scientifically reliable, evidence-based indicators of successful, advancing economies and societies; both today and through history
Society and Economy are NOT Separate
TE’s Social Contract Proof above proves that Mr. Dickens’ “Mankind is our Business” is more than just a platitude and that our people are our greatest resource, as a scientific fact. We only have to ensure that we vote for Leadership that gives people the resources and training that they need to be productive, to succeed reliably
In science, any “chicken and egg” discussion of whether a strong economy comes before a strong society – proves that high Social Contracts assure economic strength
There are 150 other Causal and Sustainable Indicators and Indexes cataloged and explained within the context of Socio-Economic Planning Methods in the WAOH Public Civics library and reliable new indicators are discovered weekly …
TE proves that Bibles are textbooks describing how to build sustainable societies. Exclude the violent passages obviously, and 90% of laws and policies in Bibles are provably causal and sustainable in science. Family values, respect for community and neighbors, respect of husbands, wives, children, and elders; respect for employees through living wages and even sophisticated economic resets (Leviticus 25/26 – forwarded from 1763 BCE’s Code of Hammurabi) – are provably essential needs of sustainable socio-economic prosperity 
Truth Makes Advance Possible
Every generation calls themselves “Modern”, every ideology calls itself “Moral and Ethical”; but in the context of history’s hundreds of generations, few ideologies truly are Moral, Ethical, beneficial, and Truthful
Harmful secular theory and ideologies collapse us just as quick as did the religious theories and ideologies of the medieval church during western civilization’s Dark Ages. Sponsors are usually economic powers like WEF, NAZIs, Rome, Persia, Oligarchy (Merchant Class). The Bible’s storytelling called these influencers “The Beast”
Any civic instruction that supports and teaches socially harmful policy or collapse is Indoctrination
Moral policies are those that are proven to create sustainable good lives and human advance reliably. Education teaches advance only
Harmful Ideologies
The Bible’s “False Idols” were a Top-10 Constitutional crime. See Ideologies at WAOH
- Neoliberalist Conservatism – vaults values and ethics that prefer the interests of wealthy people
- Libertarian – suggest values and ethics that see neighbours freeze to death ignored
- Marxism – explains sweat shops are a benefit and that proven-failed theory (fiction) like socialism and communism are real; of course they are not
- NAZIism – killed people based on race and creed
- Divisionism – Right – is neoliberalist conservatism; and Left – is feminist anti-family values and hiring laws that create a reliable infanticide of 1.5% annually in 64 high-income countries – for votes.
- Feminism
- Diversity – is a virtue-signaling business lobby that drives starvation wages, the end of family pensions (in Canada certainly), and racism that hires, lends, immigrates, or gives grants based on race, gender, and religion.
- Inclusion – is hiring for fit (“fits” are followers who fit with the group’s concensus), dumb-down, anti-merit, anti-expert, anti-leaders. Consensus-based thinking explains Flat Earth Theory, Creationism, “Angels are real”, and similar nonsense (non-science)
These ideologies might be Secular, and then there were Religious ideologies that: killed strong opinioned individuals and leaders as witches, asked for indulgence payments to release family members from purgatory, demonized scientists, etc.
We don’t want harmful ideologies (false idols) obviously, what we want is evidence-based, reliable education in civics that creates Good, Respect, and Human Advance. This is morality, ethics, and common sense, while today our universities teach indoctrination and zero science in 75% of degree courses
With foundations in evidence-based deterministic science, data-science analytics, and epistemology (Expert Process), TE and SUSTAIN Program Management work together to build solutions for the biggest and most complex problems of Scientific Societies and National Civic Leadership
![]() Civic Science’s 100% evidence-based Methods and Programs make extensive use of Transition Economics
Civic Science’s 100% evidence-based Methods and Programs make extensive use of Transition Economics
Vote for Transition Economics


Civic Scientists are the Most Important Philosophers
Philosophy is a mixed bag where 90% of Philosophers were men who explained their theories, experience, and “wisdom”. Just 10% of these philosophers left us with measurable systems, and just a handful taught us to measure reliable human advance.
In summary, Philosophy is very import but only very intermittently.
The Founder of Civic Science and Transition Economics – is an example of this most important type of Philosopher. Edward Tilley calls himself a Civic Scientist because he teaches quantifiable, measurable, observable, verifiable, repeatable Strategic Planning, Science, and Truth.
This – could easily be the best definition of “Greatest Philosophers of all time”, because most Philosophers fell far short of building measurable systems for the reliable civic advance for mankind – as he did.
” Advance is Driven” – Edward Tilley
In high transaction systems, success is assured by a higher probability of success; the measurable performance of successful baseball or soccer players, casino games, etc. In a high transaction economy, success is assured by the highest probability-of-success performance measures (the economic and social contract/human rights scores) of the world’s most successful countries.
 I recommend that everyone curious about Philosophy, purchase “The Philosophy Book” from DK Publishing. It’s a tremendous overview of Social and Civic thinkers and philosophers through the ages.
And, then I recommend that you learn both the Civics and Civics Science taught here on the TE webpage.
As you learn what a civic science looks like, you should realize that there have been hundreds of philosophers; and that a few were terrific – but, that the great majority were ridiculous too.
Philosophy has presented “Black Swans” – by the laziest researcher in history. The Oedipal Complex – aka absolute nonsense. Quotes like: “I think therefore I am”; “The end justifies the means”; “Logic is one thing and Common Sense is another”; and, last but not least, a seemingly endless parade of devastatingly harmful “ISMs” (harmful ideologies).
The GREAT Philosophers taught measurably good values (the Bible’s Good, Respect, and Human Advance), truth (Aristotle’s Scientific Method), computation (Pythagoras), etc.
And good “Role Models” that count as teachers that we can measure too – as shown by Marcus Orillius, Voltaire.
There was civics instruction – as explained in Politic’s Evil and Good Systems of Government (Aristotle)
There was an afterlife, theism(s), and then the rest – was completely dismissable
The Greatest Philosopher of all time, is the one who teaches us how to build Truth
The most important science is Civic Science, without which natural science could never be conducted and grow into something truly beneficial
Transition Economics is Important
Isn’t Economics already a science today? No, it’s not, unfortunately. Today, Economics is entirely theory-based. Math is stacked on top of assumptions, and that creates decisions used in our societies – from Interest Rates, to Bond Rates, to Recessions and Depression determinations, and so on.
Examples of indoctrination, and not education, in Economics include theories like:
i) a Supply and Demand class’s Curve Market Demand Function – Students are never told that Supply and Demand is meaningless to economic advance or collapse, and should seldom enter into a strategic economic planning discussion. It has a role to play in forecasting a business’s manufacturing, shipping, and storage capacity perhaps, but again its irrelevant to an economy.
ii) Business Profit: Is irrelevant to economic collapse or advance. Economics teaches that profit is a central driver of economic activity in a market economy. It encourages innovation, efficient resource allocation, competition, and economic growth. No, it doesn’t in any measureable or meaningful way – in reality. Citation
iii) Finance Accounting – incents MBAs and Accountants (with bonuses, board and executive salaries, and stock supports) to collapse whole industries and monetary systems reliably – leaving Western nations at 1930s levels of Production Growth today.
Irrelevant Recession and Depression definitions (hide today’s Great Depression), U-3 Unemployment Reports, CPI reports that are 30% original and exclude housing, GDP reports that call bubbles, profit, and inflation – “Production”. On and on, students in economics are taught lie after lie upon lie – and all in support of Wealth Theory.
National Productivity – China and dozens of countries have outperformed the G7 for 25 years now
No civic science supports Micro and Macroeconomics’ Wealth Theory – Supply, Demand, Cost, Profit, GDP, Finance Accounting, Central Procurement, Unemployment, Scarcity, Labour, Recession, Interest Rates correct Inflation, Stock Market bolstering, and similar curricula are merely a consensus of baseless logic and fiction. A scientific approach proves that these harmful theories and ideologies collapse economies reliably, making these teachings indoctrination – and certainly not education.
Useless maths and mathematic obfuscation
Math and Modeling are not science either. I get a chuckle out of Canada’s National Research Chair’s PhD in “Mathematic Sciences” – because the title is an oxymoron. Math is a language that only explains science when it explains observable truth and reality, and math is neither science nor important at any other time.
Transition Economics is a Science and Civic Scientists use evidence-based data sciences like TE to reliably build advance and prosperity in every high transaction economy.
Civic Science is Important
Science is Truth and Reality – We can never confuse or treat science as unimportant; truth is essential. Researchers can forward a theory, but that theory is 100% fiction until it is proven to be observably true.
70-years-ago, businesses created the greatest economies in history by putting money into the hands of citizens widely. Today, 90% of large democracies are collapsing (citation) because of the tactical, theory-based, unscientific and oligarchy-benefiting harmful ideology and Wealth Theory indoctrination taught in Western University Business and Economics Faculty curricula.
Your first reading assignment upon entering a business course in the West, will be from a Neoliberalist Milton Friedman textbook (Wealth Theory). Lawers will be taught Separation of Church and State – ignoring the 4,000 years of proven-successful Civics training in the Bible, and there will never be a discussion of Civic Science’s Performance Comparisons of all legal systems.
Business siphones trillions of dollars annually from each country’s monetary systems into offshore tax havens as economically meaningless business profit, while it has created 1930s levels of production growth worldwide (seen below). Business needs to be regulated again today, as was needed in the 1930s.

Stating that your country has “the biggest GDP gains in the G7” today, translates into saying that you have allowed inflation, housing bubbles, and economically meaningless business profit to run away more than other G7 nations. All G7s lose 1.5% of their population annually and encourage “cheap labour”, open borders, high immigration, depopulation and democratic system corruptions at a time when these collapse policies create dystopic, low-production economies.
9,000 people competed for homeless shelters in Toronto daily in 2023, while food banks are at an all-time high demand level again this year.
Democracies – We vote for collapsing democracies to keep worsening, because our ballot cards only contain business-funded political groups that keep monetary system control in the hands of their businesses – without the regulations that FDR put in place to correct the same inequality problems which were created in the 1920s.
The correction for Democracy and Wealth Theory
FDR put controls on capitalism in the 1930s and 40s which Truman continued through to the 1950s. Three decades of this consistent Advance Policy created the greatest economy and economic turn-around in history. See the corrections that FDR used to correct the Great Depression and GOP Libertarian and Neoliberalist Collapse Policies at an ACT Party thesis website, and learn how to build Civic Science into your democracy at Civic Science Certifications for Political Parties
Monarchies – have outperformed the G7 for the past 25 years (citation) without homelessness, with free education, free healthcare, with SEED investment, with UBIs (Universal Basic Incomes), without income tax in some cases, and their citizens are the richest in the world. The UAE is 1/100th the size of Canada with one-quarter its economy, and these higher performance levels are true in all monarchies.
 Income Tax – What is the point of funding a small army of tax collector employees and computer systems, to take money from the 60% of any capitalistic population that has no money? See csq1.org/waoh#tax
Collapse – is expensive, dangerous, unnecessary, avoidable, and correctable (citation); and is completely unmeasured by Economics today. Collapsing economies are created by academia’s teachings (of ideology-based and theory-based civics curricula) reliably, prompting Aristotle’s Scientific Method to call these lessons “fiction” because they are easily proven false. To make matters worse, universities/colleges actively block civic science today (citation) as does Wikipedia, Google, The Economist (a Rothchild Media publication), and most academic journals. Opportunity Costs lost become a nation’s cost of collapse.
Harmful Ideologies, Virtue Signaling, and Platitudes – Democracy, Freedom, and Free Speech mean what exactly? 90% of large democracies are collapsing today, so democracy in large population nations is a type of government that needs correction – not protection. “Free Speech” can forward lies as easily as the truth, so what we really want is the assurance that we can forward Truthful Speech. Countries without protections of law ( absolute freedom), can have no property, or currency, and women are traded a dozen times a day for a pack of cigarettes. Read more about harmful ideologies at WAOH.
New Science – TE is one of the first sciences to utilize evidence-based correlation to confirm causality observably, repeatably, deterministically, with statistical significance verifiably.
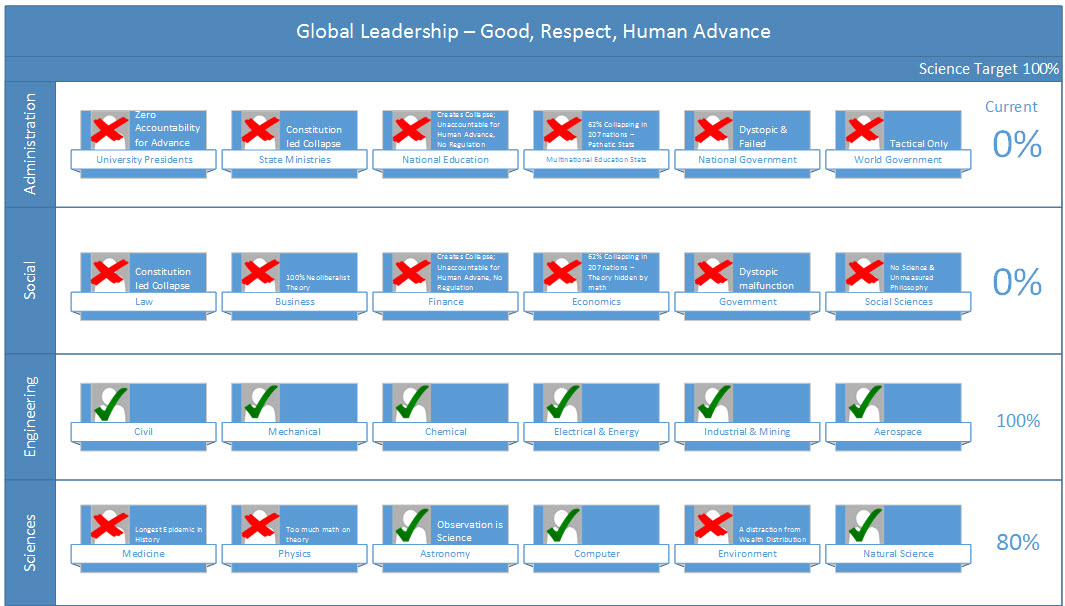
Civic Science & Education Swimlanes
Civic Leadership Faculty (CL) is an essential emerging new scientific academic governance faculty that manages the performance of all other faculties to ensure that the curricula we teach achieves the socioeconomic and human advance targets that are an absolutely must for every society.
CL-BOK – CL’s Book of Knowledge (formerly Global Leadership – GL) is TE’s knowledgebase, Library, Civics textbook, and Bible, that ensures academic faculties can never again create the broad social and economic collapse that our current 100% theory-based curricula have created within unaccountable faculty and university silos today.
WAOH – World at our Hands Civics Library – is an online presentation of the CL-BOK, often updated, live summary of the CL-BOK
Scientific Societies Programme (SSP) – SSPs performance-manage our national advance or collapse, lead projects designed to advance nations reliably, and ensure that social faculty curricula teach evidence-based social benefit – human advance and common sense. SSPs use evidence-based policy and monitoring to meet targets that double economies and replace current ineffective Governance Committees.
![]()
Today, we are experiencing another avoidable Mature Capitalism wherein 207 countries lose an average of $4 billion daily (citation). Why? Because academics insist on calling their indoctrinations “real” while hiding the scientific performance reporting of collapse in 200 countries. Academics neither measure nor acknowledge collapse, while Transition Economics both measures it and prevents it actively.
Don’t make the same mistake. In any good science, we should be acknowledging and explaining problems, and then building solutions too – see TASK, ACT, Scientific Societies, and more.
Educational Reform: Correcting the Doctors of Indoctrination
Find a growing Evidence-based Civic Sciences FAQ page here
Computational Data Sciences
Transition Economics is a very simple science, but it is also computational. This means that it adds, subtracts, divides, and multiplies 18,000 numbers (a single indicator’s survey data for 220 countries over 60 years – be it GDP, Longevity, etc.) to create a single TEP, XY, or Trend Chart. 360,000 survey data numbers are needed to create a TEP Sheet, and you can increment these computation numbers many times for aggregated index indicator TEP Frequency Distribution analyses, “10 year average” trend charts, %GDP or PPP calculations, and so on.
 For this reason, TE is most effectively paired with a user-friendly data science, visualization tools, and a research approach that explains economies in an understandable format – and from multiple viewpoints also. Examples of viewpoints might be from a household point of view, from a nation’s view, a world view, by industry, by performance, and so on.
Computers make very short work of computation, so Transition Economics is computer science that chooses the best tools for its work by making extensive use of Python, Jupyter Notebooks, spreadsheet formula and macros, and real-time graphics libraries, to explain how economies truly work and how they can be driven to advance or collapse any community or nation in the world.
With tools like MEMS and Civic Scientist Training and Certifications, Civic Scientists can now look forward to a fun and richly rewarding career and profession. National Civic Science Programs can recover $4 billion per day and reliably double most national economies.
Put simply, Transition Economics explains which indicators and government policies are important, which are not important, and it explains which policies are harmful as well.

TE’s Data Science in Natural Sciences
Applications for TE’s Data Science approach
TE’s Science of 70% technique for data mining, scoring, and ranking could as easily be called Transition Mechanics when it is used outside a Business and Economics discussion.
Transition Mechanics are extensible to scientific research in:
- Physics
- Astronomy
- Medicine
- Neuroscience
TE’s Approach is useful to any field of natural science:
- where a very large quantity of measurable data points need sorted and understood – or –
- wherever a gap exists between current theory-based mathematic models and evidence-based observed actual measures
Similar Sciences
What are they?
Sabermetrics – is a very similar computational science used to optimize athlete and team performance
Casino Science – is probability based and similarly validatable by observation
Code Breaking – Alan Turing’s la Bomba electro-mechanical computer took a similar approach to decryption where it tried every possible combination of characters until a match was found. Germany may have lost World War II because they ended every enigma-encrypted message with “Heil Hitler”
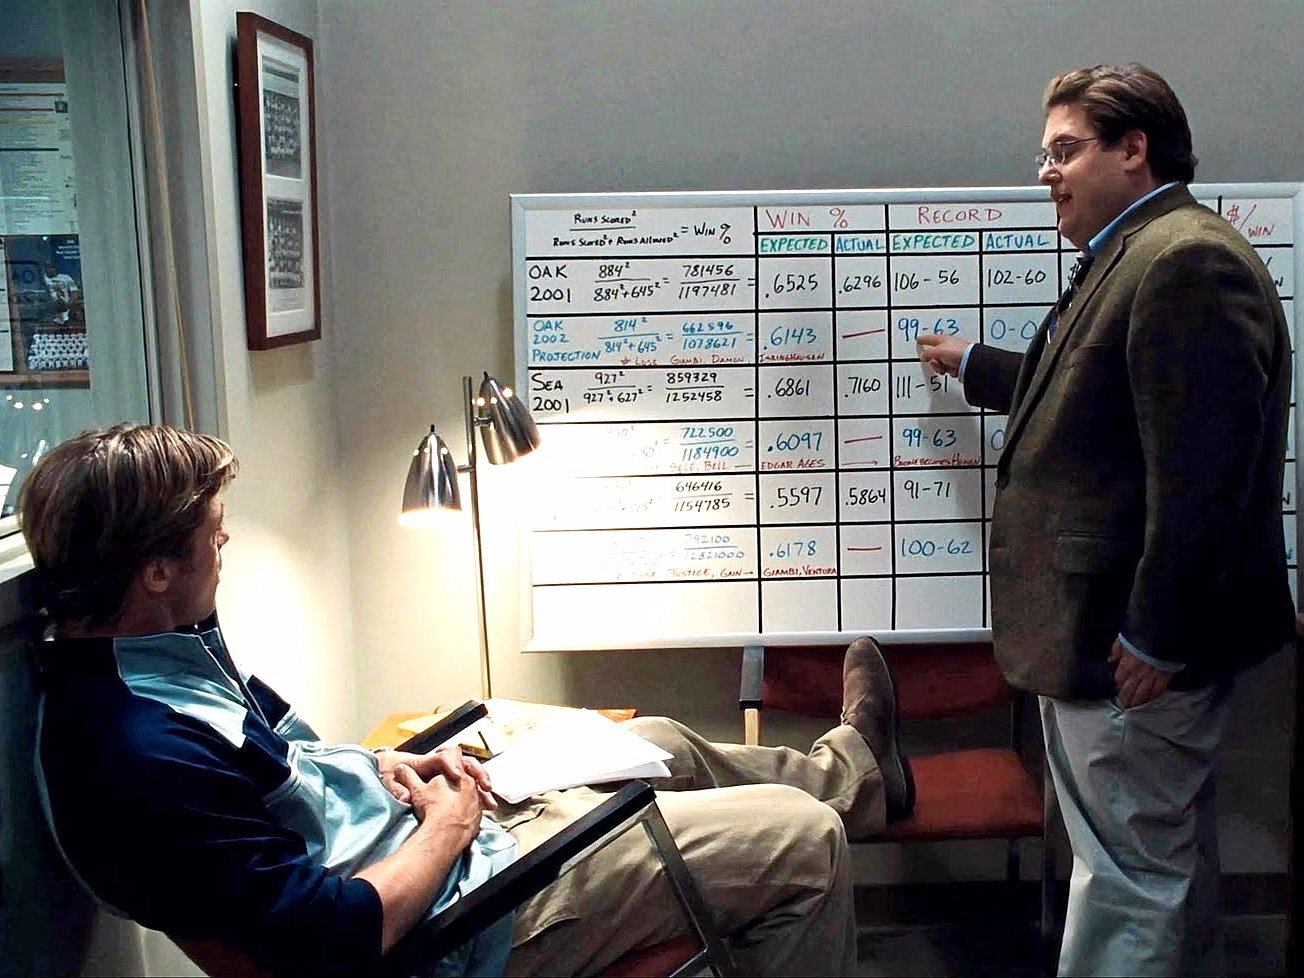
Saber Metrics being explained in the movie MoneyBall
New Research Topics
CSQ Research is always looking for useful information in the 1600 surveys collected annually from 220 countries today, so in 2023 we looked into Linear Regression to see if it yielded any compelling new knowledge. In 2024, our WAOH Library and MEMS’ new GPT AI capabilities are ongoing updates.

CSQ Publishes 1 in 6 to 10 Reports
One topic that will not be obvious to readers, is that research efforts don’t always, or even often, prove to be valuable or truthful.
At CSQ Research, we work hard to NOT publish unconvincing research. You will seldom hear about the work that we undertake and then disregarded because nothing supportable could be found in data while investigating a hunch “What If”.
You should know that for every validated and published report at WAOH, sometimes six to ten theories and variations were tested – and found false – until you now see just the explanations that can be validated by hard evidence, data, and tests of validity in context and history.
When we say that it is impossible to lie in Transition Economics, we mean it because any unsubstantiated claims can be easily discovered and easily discounted by other researchers – as all data that we use to build our charts is publicly available to anyone at any time or place.
New for 2025
Criminal Legislatures
Harmful Ideology with Blocked Curricula, Science, Central Planning & Human Advance
in 48 countries today
90% (48) of 54 large democracies are collapsing today, democracy isn’t working today. Globalist Criminal Legislatures rule the West in a coordinated way today in Britain, Canada, Australia, France, Ireland, Poland, Hungary, and others the same.
Civic Science, responsible Performance Management, Central Planning, and Human Advance are blocked or compromised by a centrist agenda that can spend hundreds of billions of dollars to hold power while diluting wealth and decision making away from citizens.
Why are Security, Justice, and Intelligence Ministries like CSIS and the CIA, Justice Ministries, and FBI/RCMP Police Forces, unable to defend themselves against Global SuperPAC-sponsored harmful ideologies and wealth redistribution sieges?
In 2025, CSQ Research is taking Elections Canada to Court to reverse an election siege – and to build important Case Law that combats Criminal Legislatures in Canada and in dozens of large democracies today
See – Globalist Election Sieges
Education Reform
Civic Science
Our Academic Mediocracy
Corruption
Criminal Legislatures
Follow and HELP WITH YOUR DONATION
to YOUR Court case at: Tilley vs HMK

InvestCS.com

InvestCS.com for Economy Doubling ETFs
Based on MEMS Finance and CSQ Research’s Data Science experts, InvestCS.com permits institutions and individuals to realize top-performance algorithmic managed ETF investment that benefits economies and humanity.
See – MEMS Finance
New for 2024
TE Strategic Ratios (Regulation)
 40-years of Small Government and Deregulation policy, by business-sponsored and ideology-led political groups, have created imbalances in fundamentally important Production Growth today. Citizens of the United States, Europe, and Canada, should be amoung the richest citizens in the world but instead these imbalances have now created the same Production Growth and Poverty statistics that we saw during the Great Depression in the 1930s.
Tactical policy setting and deregulation from the policies that created the greatest economy in history for the United States in the 1940s and 1950s, have created the need for TE’s science to define strategic long-term goal setting which can reliably create laws/regulations that enforce balance as needed to protect, or restore, productivity in any nation.

TE Ratios – Home Cost of Living versus Income
Example Ratios include:
- Salary:Cost of Living Ratio
- Salary:Home Ownership Cost Ratio
- Salary:Affordable Rent Ratio
- Immigrants:Available Housing Ratio
- Advance:Collapse Investment Ratio – nationally, per Company (Bank/Pension/Insurance), per Fund, per Industry, per Transaction type. Examples:
- Home Reselling:Building Ratio
- Cures:Treatments Ratio
- Profit:Production Ratio (note that 2000th ranked GDP Reports inaccurately count economically meaningless Business Profit, inflation, and housing bubbles – as economically-essential Production)
- Advance:Collapse Spending Ratio
- Collapse Motivators Ratio(s) – see Collapse Motivators at WAOH
- Industry Ratios – Steel, Oil, Auto, Tourism… which industries reward leadership with national advance
We’ll publish results as we work through the Ratio Targets that TEP Scores and Threshold Analytics require.
A.I. for Transition Economics, WAOH, and MEMS
T.E., MEMS, and WAOH already present computational machine learning reporting, and the new addition of AI GPTs to these libraries should create something of a Truth Teller Web App that can rely on evidence-based data for every Civics query imaginable.
At CSQ Reseach, imagination and science are never the roadblock, but staff time and funding absolutely is.
CSQ’s To Do List
If we can get to these projects, we will research further:
1. High / Middle / Low-Income Nation TEP Scoring
 One downside to TEP scoring that we have always recognized, occurs when we penalize (assign lower scores) to reports with higher “Average Advancing” nations in their surveys. Find the “Average Advancing” statistic for each TEP report’s dataset, in its upper left corner.
A High-Income Nation TEP report tends to have a greater percentage of Advancing Nations – 60% Advancing instead of 37% Advancing isn’t unusual.
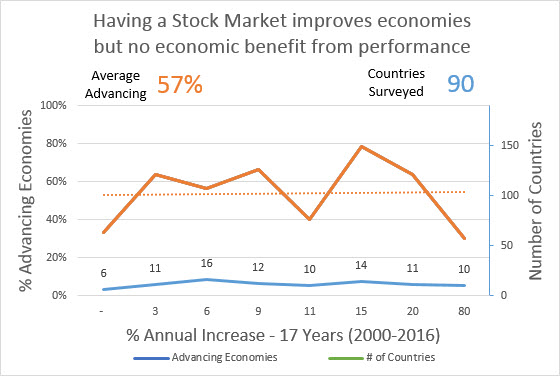
The 90 nations with Stock Markets, have a higher “Average Advancing” rate in TEP Charts than other reports . The Stock Market report’s 57% Average Advancing (advancing nations) statistic tells us that having a Stock Market is a benefit to these countries, but we don’t recalculate our 70% advance/collapse computation for just these 90 survey’d countries, which is something we would like to experiment with
2. Improved Rankings
Economies are high-transaction systems. This means that focusing on the highest-probability-of-success targets and goals WILL build a strong economy and society reliably.
To measure this causality today, TE finds the TEP scores of each indicator by measuring frequency distribution amplitudes (Maximum Y-Value minus Minimum Y-Value). This score will be the same for both TEP and TEP-XY Frequency Distribution (FD) charts
see: The Science of 70% Tutorial.
- 1.0 is the highest possible score in a TEP chart (see all indicator scores ranked at the WAOH Data Science webpage)
- We use TEP scores because this approach appears to yield the most truthful measure of causality, for all statistical measures reported annually by 200 countries
- The most causal 1.0 scoring TEP reports can have up to 38 advancing nations in their highest frequency distribution rating, while other 1.0 reports have just 8 or 10
This additional measure (38 100% advancing nations) is already reported in the Aggregate Reports section of the WAOH Data Science and MEMS pages, and we will try to add this extra scoring information into individual Chart rankings also, so that TEP Charts with 1.0 Scoring can be easily viewed with even more fidelity and accuracy rankings.
3. Linear Regression Reporting at WAOH Data Science
We will post the Linear Regression “scores” as well, but we warn that we cannot yet confirm that this calculation explains causality better than current TEP Scores and Ranks. Our findings lead us to believe that Linear Regression measures are “an average of an average” that creates only a misleading measure.
New for 2023
TE Linear Regression Analytics
TE-LR


From its inception, Transition Economics’ automated TEP charts and TEP XY Scatter Plot charts have included an averaging of its Frequency Distribution (FD) chart lines – with a red dotted line called a Simple Linear Regression (LR).
Linear Regression in TEP XY and TEP Charts are shown above for the same data. You can find a full sheet of TEP charts with LR lines for “Gross Domestic Savings as a percent of GDP” (GDS %GDP) here.
FYI – Linear Regression values are more truthful for XY reports, because TEPs normalize their Frequency Distribution X-axis points while XY reports do not. Read about how TEP and TEP-XY Charts are created in our Science of 70% tutorial here.
Like any line, Linear Regression lines have a minimum, maximum, amplitude (max – min), and slope value that we can use to create a score to rank one chart to any other with. Is a high-amplitude, high-slope LR valued chart (measure/indicator) more causal than others?
This is the question we want to learn answers to.
Unnecessary Complexity: We also want to be cautious not to add unwarranted complexity. We can see that problem in GINI measures where mathematicians stack meaningless obfuscation on top of what is a simple 5% or 10% income or wealth inequality measure. It’s an example of academics making themselves important by suggesting simplicity and understandability is not important.
We did the work and posted the LR values in our MEMS APIs, but this is an example where added complexity does not initially seem to offer better learning, and we found that results were less compelling also. Maybe something will come of the work in later research rounds.
New for 2022
TE Threshold Analytics – TE-TA
Threshold Analytics was added to the GL-BOK, MEMS, and to Transition Economics in 2022
So much of Transition Economics’ evidence-based context was based on just a handful of Causal indicators, that questions arose about what could we be missing. TA’s inclusion of ALL high-scoring indicator thresholds is now available to address this question.
A Netherlands citizen is three times more productive than a Canadian, which means Canada loses $3 billion every day. Can you spot why this is true in these Threshold Analytics (TA) comparisons?


Threshold Analytics adds more data points and opportunities for discussion, but it also ensures that nothing can be overlooked. See an example of TA in our Case Study of international Constitutions.
TE’s thresholding approach determines Advance, Collapse, and Causality status for indicators, for nations, and for industries. See our Science of 70% page for an explanation of how we create TE Thresholds.
Economics and Civics are a STEM Science
Contrary to the indoctrinations of proven-failed Wealth Theory in Western Universities, there is no separation between economy and society in civic science: one enables the other and an economy never prospers without a strong society. The strongest economies in the world are led by the best societies in the world.
Economists are NOT Civic Scientists
Civic Scientists teach science while Economists teach proven-failed theory.
This is why Civic Scientists differentiate themselves; we understand economies far better than Economists, and we similarly recognize that the entire faculty and curricula should be abandoned and replaced by Civic Science.
Evidence-based Civic Science is simple, but if we were doing all of these additions and divisions manually – or even with spreadsheets, it creates a mountain of computations that are far better understood with interactive data science and visualizations (charts). MEMS AI required two years of development, but today it can create all of these sortable lists and visualizations within less than a second in most cases.
In 1939, the Enigma Machine presented a similar computational puzzle to code breakers in World War II. Alan Turing had to compute – and then also create both a computer AND programming as well (that machine was called “La Bomba”). So, when we are presented with a similar high computation challenge today, we are leagues ahead from where things were when computational sciences started.
FAQs
Question. Why can we be certain that a causal indicator is actually important – versus a coincidence created by other causal factors?
Answer. A Context Validation Step confirms that our interpretation of the collected data is reasonable – that data is current, accurate, compares advancing countries only, and that its Top-10 and Bottom-10 nations are representative of our conclusions.
Question. Why will highest-probability-of success policies always improve an economy?
![]() Answer. Economies are high-transaction systems, so by running only the highest-probability-of-success policies, we will always improve economic and social measures over time – with mathematic certainty. We see the same scientific laws at work in busy casinos, in professional baseball’s at-bats computations (SaberMetrics), and there are other similar examples in nature, in manufacturing, etc.
Answer. Economies are high-transaction systems, so by running only the highest-probability-of-success policies, we will always improve economic and social measures over time – with mathematic certainty. We see the same scientific laws at work in busy casinos, in professional baseball’s at-bats computations (SaberMetrics), and there are other similar examples in nature, in manufacturing, etc.
CSQ Research curates all of this new science and computing at our Standard of Reseach Civic Leadership Body of Knowledge (CL-BOK) and Knowledgebase WAOH Econometric Library. We invite fellow evidence-based researchers and world policy leaders to collaborate at CSQ Research’s evidence-based Scientific Journal – National Leadership Magazine
Extend your Standard of Research – and Contribution
With Transition Economics, for the first time we can say with assurance which policies and measures are important, which are not important, and which are harmful.
ALL of the Micro and Macroeconomics curricula, much of business, government, law and finance, are unimportant or harmful, so you want to be heeding instructions here.
Include TE’s evidence-based computation and context-validated approach in your own research. Transition Economics is the first? evidence/observation-based, context-qualified “hard science” for economics, law, finance, business, government, education, and social studies faculties.
An emerging academic Civics Leadership Faculty can use TE to performance manage (govern) all university curricula so as to ensure social benefit, and to drive out ideology and indoctrination in curricula from every faculty.
Civic Leadership uses Transition Economics to sort all of the world’s TEP score results by Method and by Program to find the highest-ranking measures, and then we confirm their causality by validating cause and effect (of policies) in history; during past mature capitalisms; in past periods of inflation or production growth; in times of war; and in collapse and advance today.
The Book is CSQ’s first thesis to introduce The Civic Leadership Book of Knowledge. CL-BOK explains WAOH and also MEMS’ sophisticated computer science and visualization charting and tabling capabilities – available to schools, regulators, and government groups. The WAOH Econometric Library (World at our Hands Report) keeps most of these reports in a simpler format.
WAOH is already the largest context-managed econometric library of its kind in the world today – and MEMS more than doubles its database.
 Harmful Ideologies are Indoctrination, not Education
Compare a science to a non-science like Karl Marx‘s terms and theories; unmeasurable, unscientific, ambiguous, and unreported too. Neoliberalist Wealth Theory (Micro and Macroeconomics), Libertarian Cold Indifference to neighbors, Conservatism, NAZIism, Individualism, Right Left Division, and similar. None of these theory-based curricula are scientific and ALL are only harmful 100%
Terms are important as well. America lost 58,000 sons in the Vietnam War to “Defend Capitalism”. Which capitalism was that? Was it the capitalism that Hoover used to create the Great Depression, or was it the capitalism that FDR used to create the greatest economy and society in history? Vietnam won the Vietnam war; surely they must be “communists” today? No, of course not; these terms are meaningless nonsense (non-science) 100% …
Find Civic Leadership’s Glossary and Standards for Scientific Terms here

Announcing “The Book”
Three years in development, and one of the most important books of any century…
CSQ Research is very proud to announce a Case Study of the Civic Leadership Book of Knowledge (CL-BOK)
“The Book – The Scientific Update of the Bible”
Religions use (and abuse) the Bible, but The Bible is not a religious text; it’s a civics textbook.
“ta Biblia” means “The Books” in Greek, and its first five books are updates of the Constitutions and Book of Laws of Kings Hammurabi and Ur-Numma from Mesopotamia (modern-day Iraq) 4,000 years ago.
Today’s Common Bible was originally commissioned by a Roman Emperor and updated by hundreds of scholars and historians. This explains why 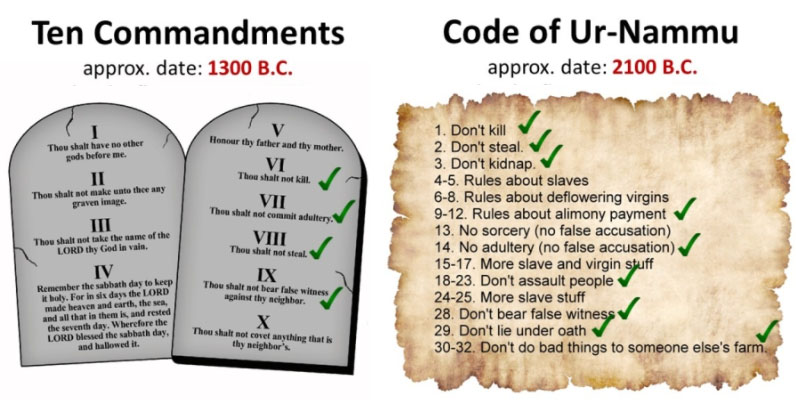 800 Constitutions are based on the Bible since 1791 (according to Wikipedia).
The Bible teaches us how to build a successful civilization based on the scientific observation-based lessons learned from 2,000 years of history in civic rise and fall. 73-books in total had to be written in a storytelling format due to the illiterate audience of its era, but today 5-billion copies are printed in 700 languages until most of humanity is acquainted with its leading characters and stories today.
Here is something that you probably don’t realize …
EVERY nation that ensures all of the Bible’s Human Rights are advancing today, while …
EVERY nation (over 15 million in population) that use only a part of its Constitution – are collapsing; and worse, collapse, again and again, every 60-years like clockwork
In the Bible, Leadership is taught as a trinity of essential values and explained using the teaching tools of a Father, Son, and Holy Spirit:
- Good – systemic empathy in actions and in laws – in “Lord”,
- Respect – of family, of parents, of women, neighbors, employees; aka The Golden Rule, and
- Creation – building and the shepparding of Human Advance
In contemporary evidence-based science, these three values are every bit as important to any nation’s reliable success today – as they were 1,700 years ago.
Harmful Ideologies – are called “false idols” in the Bible: Naziism, “The Right’s” Neoliberalist Conservatism and Wealth Theory, “The Left’s” Feminism’s Equality, Diversity & Inclusion hiring laws, Libertarian, Rugged Individualism’s Cold Indifference to neighbours, are all examples of harmful ideologies. Division is weakness, and harmful ideologies collapse any civilization reliably.
“The Beast” – were wealthy merchant-class Oligarchy economic powers. The last book – “Revelation”, warned us not to tattoo ourselves with ideologies, yet how many Americans advertise themselves as Republican or Democrat? Two harmful ideologies that are proven to collapse any nation.
Does anyone imagine that the NAZIs did not interview top-leadership candidates to ensure they aligned with “ethical and moral” party values? Of course they did. Every ideology claims utopic, modern, moral ideals and values. Naziism was a harmful ideology; not good values –
And we have forgotten these important lessons today, because we don’t teach lessons in scientific Civics – again.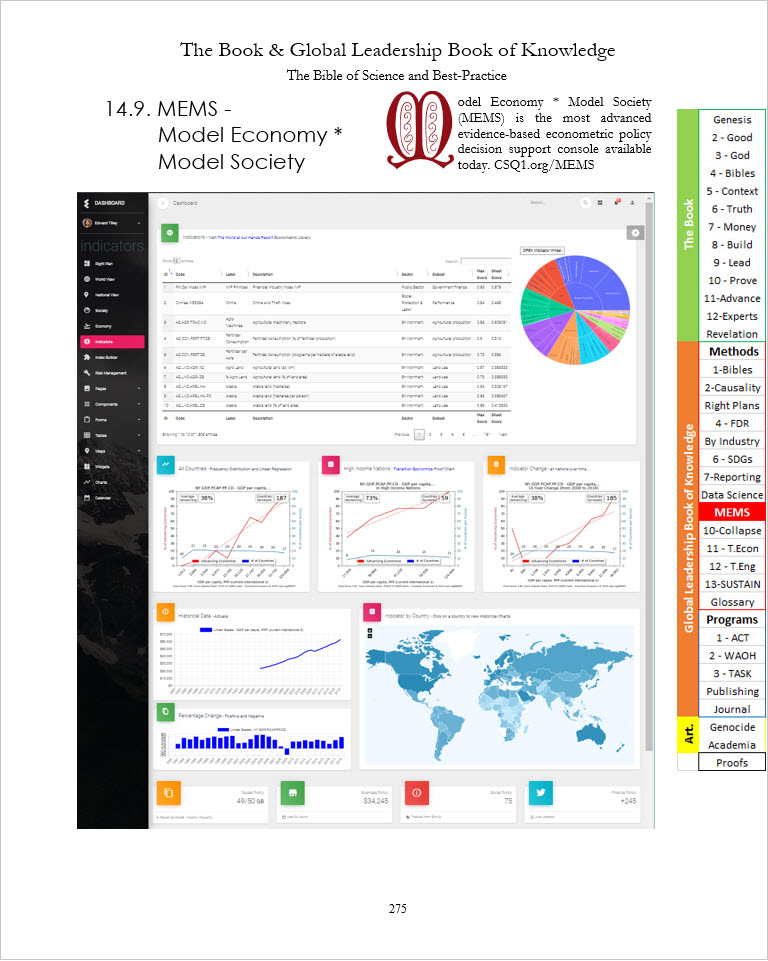
The Book explains the Bible’s essential lessons in Civics, Education, Constitutions, and in Rule of Law; alongside the evidence-based quantitative sciences that today’s educated and literate populations need to learn as well.
Churches are essential. Why? Because weekly community gatherings and lessons of scientific civics lessons – and also their social programs – are important for a community’s well-being.
What is meant by the Separation of Church and State then?
We don’t want is the religious theory and witch-hunts that collapsed us in the middle ages, and we don’t want the secular theory that collapses us today either. What we want is a Scientific Society and the reliable success that this ensures.
The Book – is an overdue update of the Bible, that clearly explains how to double economies by advancing our societies – without division, without poverty, without wars, and without the guesswork, collapse, and lies that we see today, and omissions we don’t see, in reporting and media today.
Order your First Edition First Printing boxed and signed Collectors Edition of “The Book” here.
Now that we have a science, what can we learn and validate?
How does Social Contract build strong Economies reliably?
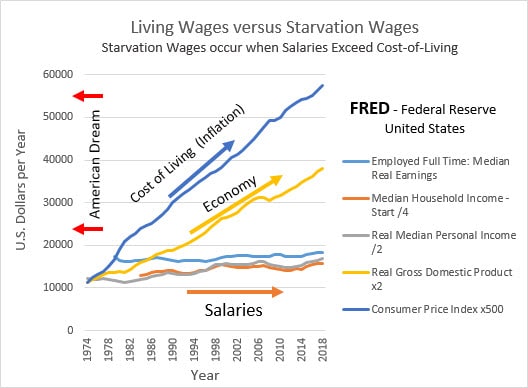
In the U.S., starvation wages started (and living wages ceased) when salaries fell below Cost-of-living in the late-1970s
Freedom – in a monetary system is your reliable Salary minus Cost of Living (CoL). When salaries fall below Cost of Living, freedom is lost in the new imbalance; when salary falls to CoL, starvation wages replace Social Contract and economies stall. These problems can grow unreported and uncorrected for decades in large democracies. Why? Because we don’t:
- teach responsible civics
- monitor and report these imbalances
- correct these expensive, dangerous problems before they can balloon to collapse any nation
This measurable definition of freedom is the only one we should be using. Instead, “Freedom” is one of the most abused terms in politics for a century and more. Even when you do notice the problem, identification does not solve the problem. Solving big problems requires that you only place your vote with groups that understand leadership and are committed to implementing measurable advance in this essential target – of “freedom”.
In nations where your Constitution does not protect citizens from ballot cards filled with unscientific political groups and policies, NEVER give your vote to a LEFT or RIGHT political group. The only “side” that we MUST vote for is “Advance”; see an example of a scientific political group on a thesis-based ACT Party website. ACT Parties drive social and economic success reliably using scientific performance monitoring and are only permitted to support policies proven to advance nations with a highest probability of success.
Individual financial freedom permits Productivity, while failed freedoms deny productivity and also undermine good lives; weakening Social Contract and the social benefits that come from our being able to make Common Sense decisions – for moral reasons.
Imbalances during Mature Capitalisms
If you give any population one million dollars each, sixty years later you will have gross inequity – as a mathematic certainty. Leadership and policy determine economic and social collapse or advance 100% so when government policies permit economies to collapse from this imbalance, countries descend into populism and create a powder-keg that any spark can then turn into revolutions and also world wars. 
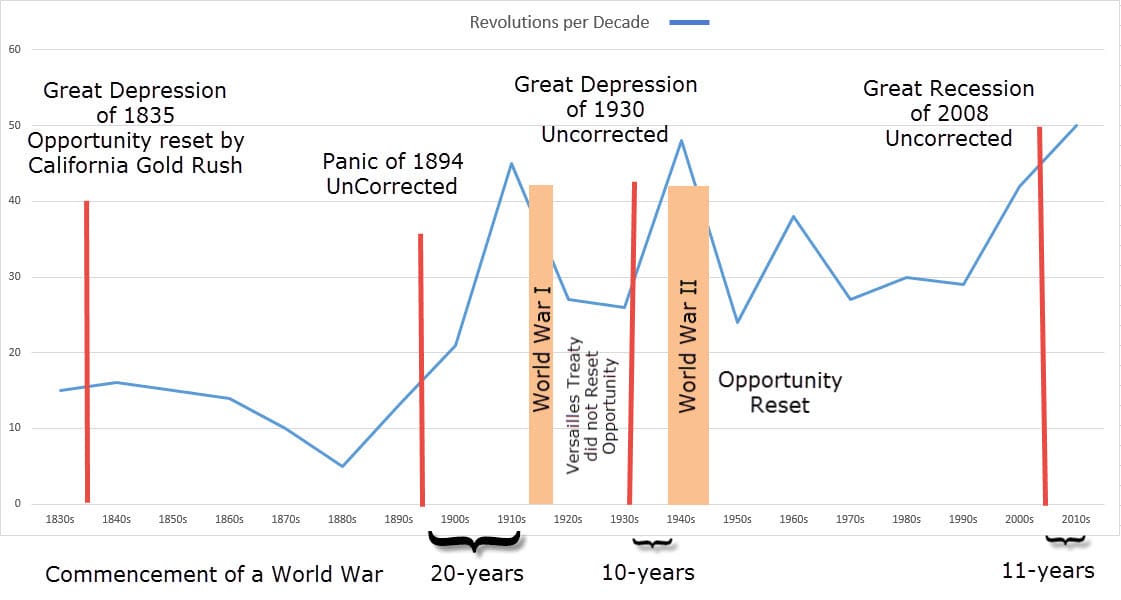
More Conflicts than at any time in History
Today, we live in a global Mature Capitalism. There were more conflicts in the past decade (2010-2020) than in any other decade in history – caused by the hardships and lost freedoms created by wealth and income inequity, starvation/slave wages, and high costs of living internationally. 
90% of the planet have no pensions (ILO), salaries have to increase by 100% to catch up with income stagnations that began in the 1970s, and 130-million U.S. citizens live in starvation wages that lose the county $30 billion per day today.
Blue-collar workers own modest homes, modest savings, healthcare, and pensions, but 40% of Americans do not have that; they own nothing (0.3% – in the 2010 Federal Reserve Report to the left). In the 1920s, we saw that the unemployed were lazy, that governments and governance should be small, and that business and finance needed laissez-faire and open markets; politicians who voted for the policies of wealthy sponsors were made rich in preferred stock and real estate deals.
Divorce, poverty, and homelessness rose while homeownership fell – to truly alarming levels. These “Neoliberalist” policies proved unsustainable, and it was the corrections of all of these policies in the 1930s and 40s that created the greatest economy and society in history.
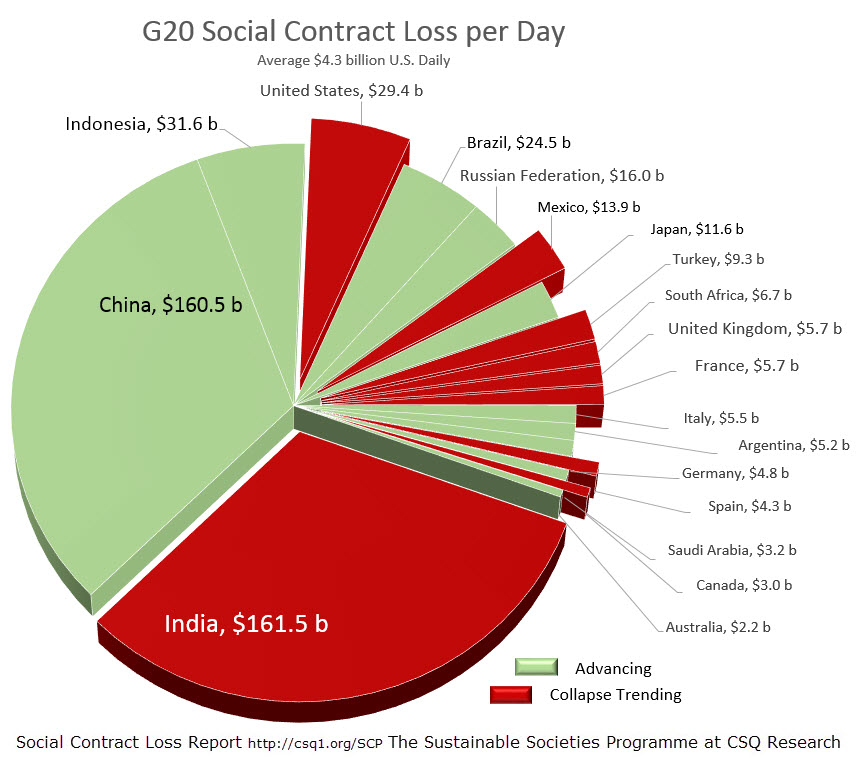
Minimize Social Contract Loss in G20s
We forgot all of these hard-learned lessons as our fortunes improved in the 1980s and 90s, until we returned to the policies of the 1920s again – along with all of their Social Contract Loss costs and broad collapses.
Those who cannot remember the past are condemned to repeat it. … George Santayana
Transition Economics’ Proofs and Social Contract Product (SCP) Report explain and prove that strong social contracts build strong economies; where GDP Reports hide social costs and allow Social Contracts and productivity to diminish.
SCP, SC, and Social Contract Loss (SCL) Reports, cast into sharp relief the high cost of an unproductive population. Social Contract Reports recognize problems and Transition Economics works the problem to solve the problem by pre-empting the collapses that we see today.
A 600-page thesis called End of War explains “the how”, the solution(s), step-by-step for both national and international advance. We aren’t the first to turnaround collapse, of course, CSQ stands in good company alongside the great leadership example left by Hammurabi, Constantine, Aristotle, Henry Ford, Franklin Delano Roosevelt, and a handful of history’s great civic leaders, thinkers, and problem solvers.
In Budget Year 2000, Canadian Prime Minister Jean Cretien accomplished the largest budget surplus in Canadian History – $1 billion in a single year. This is a reported statistic.
Today, the Canadian economy loses $4 billion CDN dollars per day to its falling Social Contract; this, is an unreported statistic.

National Budget Surplus and Deficits in 181 countries
Now ask yourself this question: Does it make more common sense (social benefit) to drive austerity measures that will surely shrink an already-stalled economy further – to achieve a balanced budget? Or, is it better to drive SEED opportunity investment that has a track record of building a robust economy, building your economic “pie” larger – and putting a stop to the $3 billion dollars a day in Social Contract Loss?
The correct answer is explained by the TEP Chart for Budget Balances here to the left, where the largest group of advancing countries had 10% budget deficits. Advancing countries spent more than planned (10% of their total GDP more) or they had 0% to 7% surpluses, and Collapsing nations had budget deficits of -4%.
In the U.S., Social Contract Loss costs the country an unreported $30 billion – per day.

Every major nation in Europe had debt written down in the 1930s to 1950s
First, you must grow your economic Pie larger, and then you pay your bills with the considerably larger resources at hand – or through debt forgiveness.
National Debt Forgiveness
Do you imagine that your’s is the first and only untrained democracy to have its national debt run up by a Reagan “Low Tax” (No Tax for the rich) policy – or Trudeau’s overspending? Not by a long shot. Many countries stand in this same quagmire in today’s global Mature Capitalism.
Given the COVID19 Pandemic’s economic interruptions, today is probably a very good time to discuss national debt forgiveness programs as we did in the 1930s when near-every European leader simply agreed responsibly to write down huge sums of national debt.
Capitalism, Democracies, and Monarchies
Capitalisms created strong Social Contracts better than State-owned productions – only intermittently after the worldwide fall of monarchies in the early 1900s. The strongest performing nations in the world for the last 25-years and today are Monarchies – who use state-owned Oil or Tourism revenues to charge no income tax, to afford free healthcare, dental, and universities. These countries have no homelessness, no multi-generational addiction, and their citizens are some of the wealthiest in the world.
90% of large Democracies are collapsing today. When mismanaged, Monetary Systems mature into imbalance near the end of a compound-interest-driven 60-year cycle reliably. Mature, unbalanced capitalist economies need active correction by Governments in order to rebalance the ratios between Salaries and Cost of Living, and to ensure that opportunity is available to everyone as needed to relaunch a new monetary system cycle painlessly – without hurting citizenry.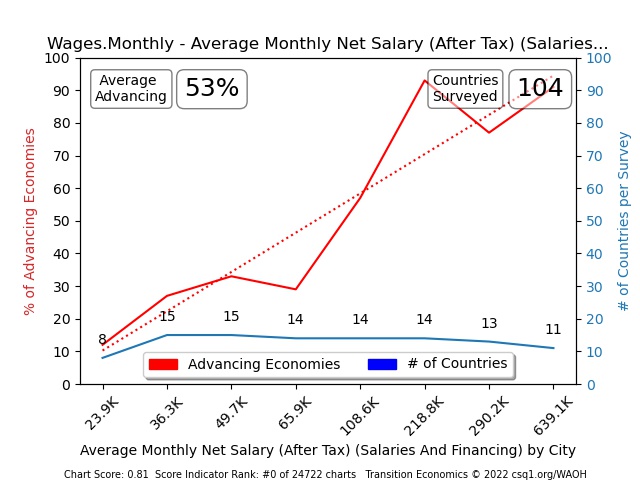
Henry Ford didn’t invent the assembly line, his great contribution to humanity was his reinvention of the Living Wage – during the Second Industrial Revolution (1895-1930).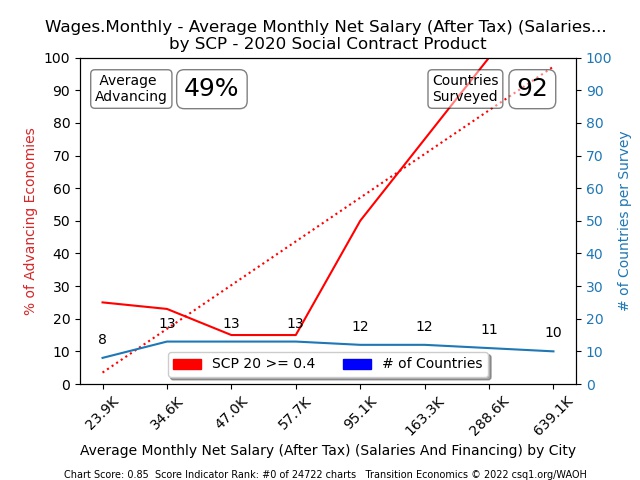
 Severe inequity had stalled world economies for fully two millennia – in the dark and middle ages. A clear view of what inequality builds can be seen in any chart of 2000-year GDPs per Capita prior to 1890.

Henry Ford’s High Industrial Living Wages created prosperous Economies
Monetary Systems are Simple
See also Money
So, what have we learned here? After countries outgrew bartering, “token passing” was adopted. Coins, then paper money, and finally electronic records and currencies were created. There are 180 national currencies worldwide and thousands of cryptocurrencies.
In 1930, the last mature capitalism, the value of money was determined by the Gold Standard and based on the Gold Reserves that a nation held. Today, money’s value is based on a Fiat System – the creation of Debt (Bonds) and a nation’s ability to repay that debt, also known as the dollar standard.
A Foreign Exchange market sets prices for one currency against another, but it’s a brand new standard too, as it was created in 1971, just fifty years ago. Money is printed from thin air with Quantitative Easing, when many nations cooperate to print money together, thereby not harming any one nation’s valuations compared to other currencies. Everyone’s paper money value is lowered, but it was based only on “belief of value” to begin with, either way.
In short, “money for governments” should not be confused with “money for individuals and businesses”, as these are two very different discussions – with different rules. Money “supply”, that isn’t the problem; rather, it’s the “distribution” of money that advances or collapses a nation 100%
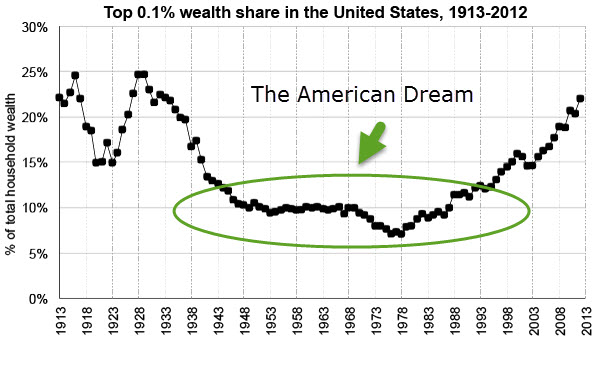
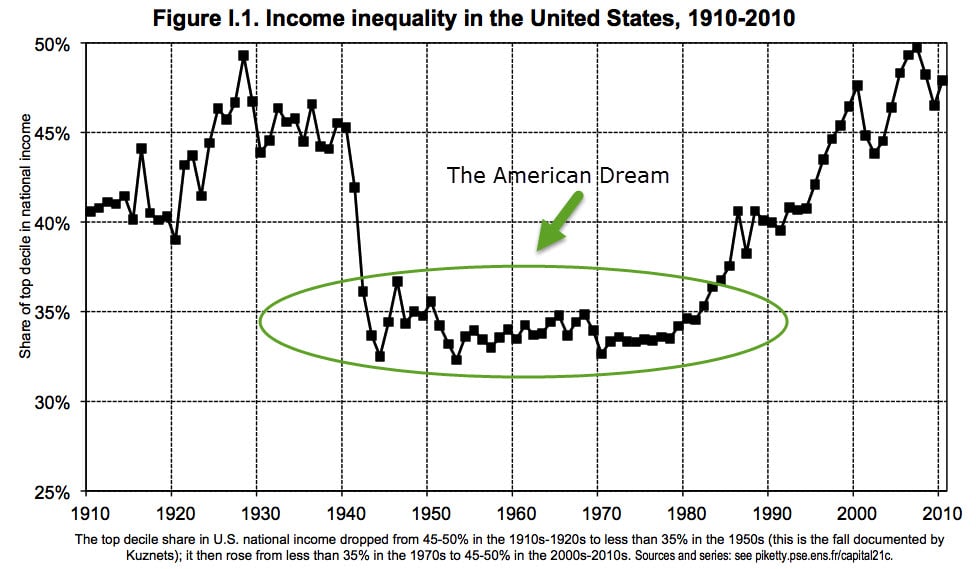
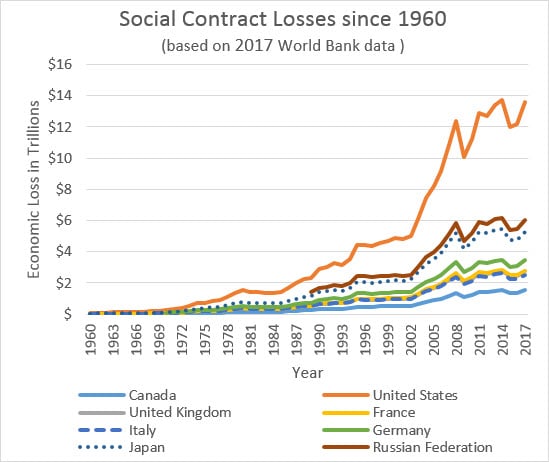 Henry Ford’s Living Wage created our contemporary economies – because for the first time ever in history – money made it into the hands of an entire population. This created Productivity – and as I already mentioned, Productivity builds strong economies reliably.
A nation like the UAE that SEEDs productivity to all of its citizens, has done incredible things. As I write this, a UAE rover is circling MARs. A country that does not allow money to distribute, with scale-up trickle-down high-inequity Wealth-theory policy, collapses.
Every nation loses $4 billion daily – unreported – to Social Contract Loss and this is the reason we highly recommend using SCP Reports rather than meaningless GDP Reports here.
A growing or declining GDP Report does not indicate that a nation is advancing or collapsing – but an SCP Report does
When you don’t know what to stand for, you can fall for anything
It’s a solvable problem; CSQ’s Data Research group builds MEMS for the exact purpose of correcting and turning around the specific policies responsible for economic loss and social collapse, and ACT Parties – simply do exactly what FDR did to create the greatest economy in history.
FDR turned our last Mature Capitalism into the American Dream and greatest economy of all time, with policies of high wealth and income redistribution (92% income and 80% estate taxes – for 20-years), nationalism, full-employment, an empathetic Second Bill of Rights, a strong social contract, family values, and America’s mature and affordable home-ownership and capital formation systems.
There was no socialism in the mix but there was a lot of change to social programs, living wages, and opportunity. Eleanor Roosevelt carried these policies on to become the U.N’s Universal Declaration of Human Rights in 1948. Truman’s Marshall Plan rolled this learning into the Constitutions of Japan, Italy, and Germany – which are the only G7s with advancing economies today.
FDR’s Second Bill of Rights is considered America’s greatest export in many European nations. The question for democratic law-makers and academics today becomes, should the messaging of special interest groups continue to misrepresent and even vilify those proven solutions?
Invariably, it is the poor – that suffers due to economic problems, Oligarchs are not personally impacted by their poor decision-making as a point of fact and circumstance.
Conflicts of interest – must be announced as a management best-practice but in democracies, individuals with personal investments in unsustainable policy are not required to disclose and exclude themselves from votes in support of their own interests.
Self-promoting, Advertising, or Opinion; should be communicated transparently at the very least. A scientific Standard of Research and policy Proofs, can cancel out harmful theory, ideology, and “logic” arguments, and ensures corruptions both intentional and unintentional, are dismissed to preserve advance and common sense.
Where Economics teaches how economies should work, TE teaches how economies actually do work
TE’s WAOH Econometrics Library showcases Context Methods, evidentiary data, scientific method, and rapidly-maturing infographic tools – as needed to explain economies easily – and all of this information is available in just the past five years really.
Where Micro and Macroeconomics are entirely theoretical and are also proven to fail (to not manage the imbalances of mature capitalisms, automation, nor Social Contracts), Transition Economics’ scientific approach teaches credible, quantitative, disambiguated terms and proofs that can ensure strong economies at any phase of a monetary system’s life-cycle.
Advance Policies
As a voter, your first responsibility is to advance your country, community, and family. When election ballet cards offer only Collapse Policies in every Political Party on your ballot card, your system of government is corrupted and your nation collapses GUARANTEED as a mathematic certainty
90% of large democracies are collapsing today, so this is no trivial warning
CSQ Research Trains, Certifies, and Monitors Political Parties to confirm that they offer ONLY Advance Policies
What do Advance Policies look like? As an example, the following list of policies created the greatest economy and society in history – both 70-years ago locally and in a dozen countries internationally today as well
Vote only for Sustainable Policy – anything else is Socially Irresponsible
Transition Economics balances Monetary System Cycles


Monetary system cycles begin balanced – and then they lose a constructive balance between incomes and cost of living over time. Can an economy be managed to prevent imbalance – and to always stay at a reliably productive state?
Yes; this is Transition Economic’s primary focus.
Monetary system cycles – are manageable in two ways: a) Governments can actively ensure that the ratio (balance) between reliable salaries and cost-of-living, stays in-balance annually. This is similar to CPI (Consumer Price Index) corrections but more sweeping to include all costs (housing, etc.) and salary levels. b) Governments can simply allow open markets to unbalance themselves – and then, when social hardships become too great, the government of the day can reset the monetary system cycle to a new balance and a new cycle again. 
Every major nation in Europe had debt written down in the 1930s to 1950s
The Code of Hammurabi and the Bible/Torah (Leviticus 25-26) suggested this second option in an era when monarchs had the authority to make sweeping economic resets easily. A fiftieth-year Jubilee Year was suggested to pre-empt the hardships of a mature monetary system’s 60-year cycle. “Reset” policies included: Universal Debt forgiveness, wealth redistributions, and a concerted effort to reset the balanced “American Dream” conditions that we should see at the beginning of any new cycle.
“25:10 Consecrate the fiftieth Jubilee Year and proclaim liberty throughout the land… 35. If any of your fellows become poor and are unable to support themselves among you, help them as you would a foreigner and stranger, so they can continue to live among you. 36 Do not take interest or any profit from them … so that they may continue to live among you. 37 You must not lend them money at interest or sell them food at a profit.”
Leviticus 25-26

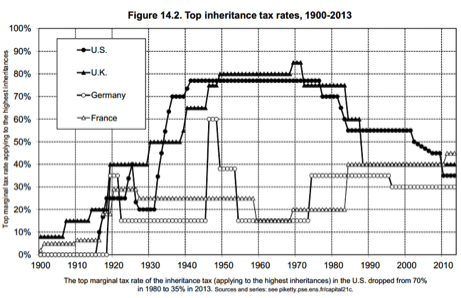 Uncorrected, Mature Capitalisms are incredibly expensive; we see this here above in Social Contract Loss report Pie Charts. GDP Reports completely hide the productivity losses created when 40%+ of an entire population experiences starvation wages. The average economy loses an unreported $4.3 billion every day today.
Harmful Ideologies in Schools
Collapse any Society
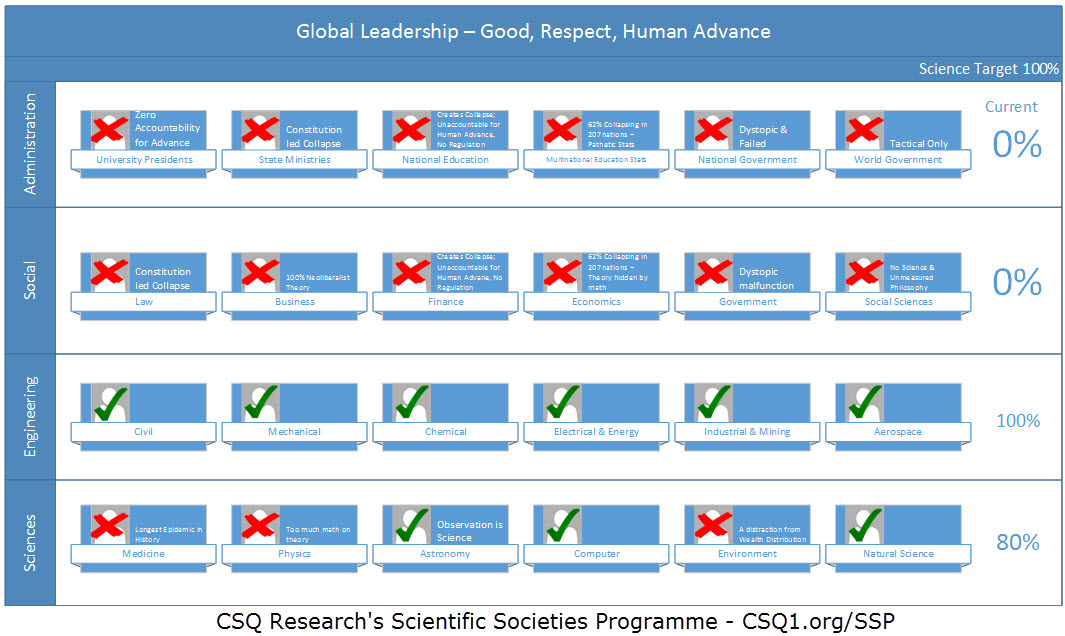
Civic Leadership Sciences Dashboard
Creating a 100% False Peer-Review Rate in faculties of Economics, Government, and Business, as we certainly have today, also creates a systemic academic mediocracy; an upside-down state where non-experts are credentialed, while experts are denied credentialing, access to boards, and to investment decisions.
An Expert can be expected to refuse to follow, memorize, and advance, socially irresponsible fiction (proven-failed theory is termed “fiction” in Scientific Method); there should be no surprise in this.
The Great Resignation – is the result of our societies being taught that business grads (non-expert CPA accountants, non-expert MBAs, and non-expert Human Resources admins) should hire similar non-experts only and then install them into leadership positions and Boards too. MBAs, CPAs, and HR admins are trained in Wealth Theory which is proven to collapse nations reliably, and they’re typically younger. Aristotle explained that young, ambitious people focus on themselves, bonuses, and do anything they are told to do, which is why leaders must be experts and heads of households with launched children(in their twenties).
Filling leadership positions with non-leaders assures collapse in any society. Non-experts can never be leaders, as we see in collapsing North American businesses and governments today. The social and economic costs and risks are too high, too dangerous, unnecessary, preventable, and correctable.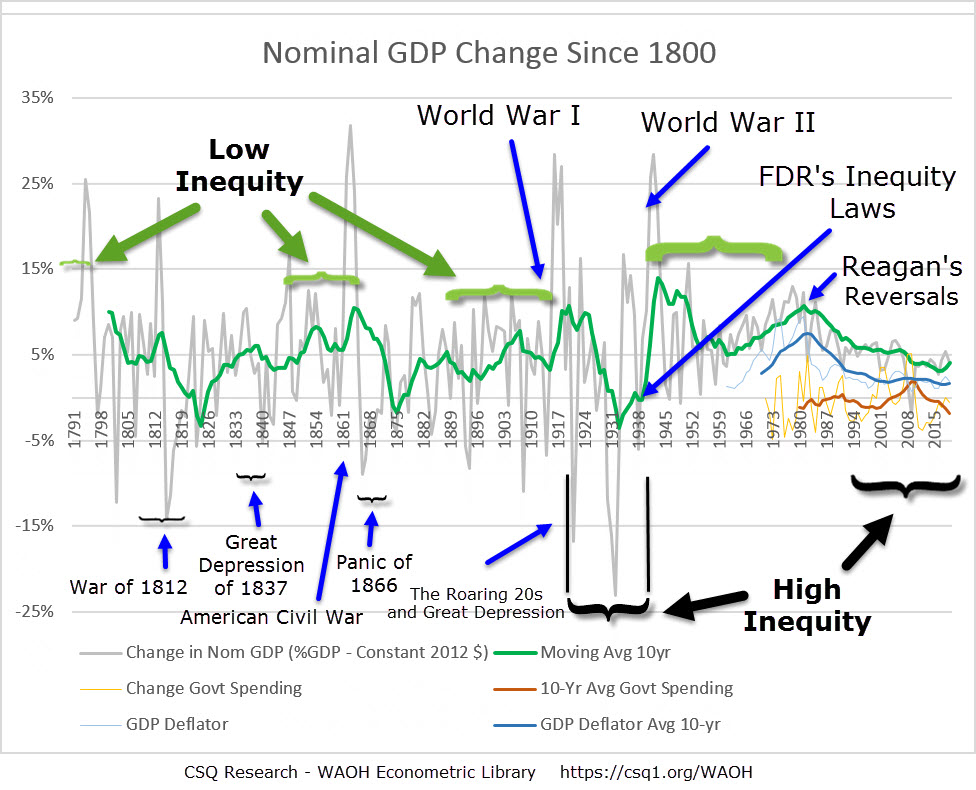
Low Productivity and Social Contracts cost each nation an average $4 billion daily; $30 billion per day in America. We are all at our lowest production growth levels since the 1930s, and Mature Capitalisms globally risk the lives of billions in their first repeating occurrence in a mature nuclear age.
More Conflicts than at any time in History
Sciences like Transition Economics are presently being refused reading at not less than eight leading international Economics Faculties and now a CASE STUDY paper is created. Academic Presidents, researchers, and Social Faculty leaders should encourage the adoption of scientific and evidence-based curricula as their highest priority today.
Read the “Adoption” chapter below to understand why academia’s reluctance to change is absolutely normal historically, as seen in any swollen bureaucracy also.
FDR’s Proven Constitution
Franklin Delano Roosevelt created the American Dream and the greatest economy of all time – from a late monetary system cycle and Great Depression very like today’s mature capitalism
FDR was President of the United States from 1933 until his death in 1945 – and can be remembered as the greatest democratic leader in history also. Why?
He proved that the same list of policies and Human Rights that the Bible stipulated, can create reliable success for every nation
FDR’s Second Bill of Rights restored the Bible’s time-tested Human Rights to dozens of Constitutions after slave owners distorted an essential Rule of Law in his own country 150-years earlier. Rights of a good education, rights of homeownership, financial resets, a living wage, was assured in the U.S. by FDR’s policies for 40-years – and would have surely been updated into the U.S. Constitution had FDR lived to see the end of WWII in 1945
ALL nations that updated to FDR Constitutions after World War II, have advancing economies today – with great healthcare, education, high social contracts, six weeks vacation, and good lives today – 70-years later
ALL U.S. “Owner and Slave” Constitution nations (with populations over 15 million because democracies self-correct in small populations) are collapsing today – just as the U.S. has collapsed every 60-years since they exceeded 15-million in 1850
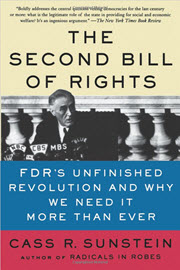 Recommended reading: Cass Sunstein’s: FDR’s Unfinished Revolution and Why We Need it more than Ever “FDR’s Administration dramatically changed the definition of Constitutive Commitments from 1923 to 1937 to discredit unempathetic Freedom of Contract and to ensure the protection of law against the evils which menace the health, safety, morals, and welfare of the people”
Advance vs Collapse in TEPs
“Advancing” economies can be confirmed using any proven measures of an advancing economy. What was our first Causal Indicator? Trade Balance. Why?
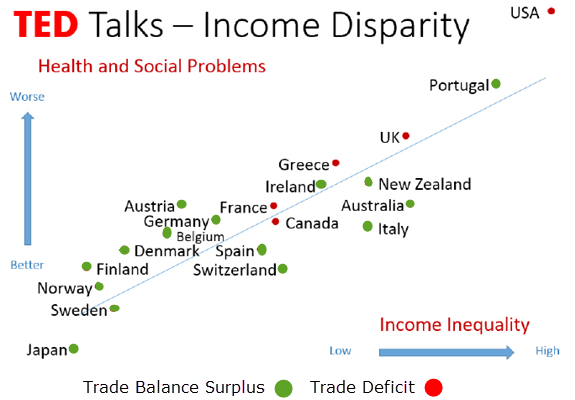
Trade Balance was higher in high Social Contract Nations
The term “Proven” here, means to say that the measures can be confirmed transparently, in TE Proofs (TEPs and cited multi-national surveys), to indicate a causal influence of economic success. Measures will grow with continued research, but most today’s frequently-used measures include:
Trade Surplus (indicated as “Advancing” in TEP legends)
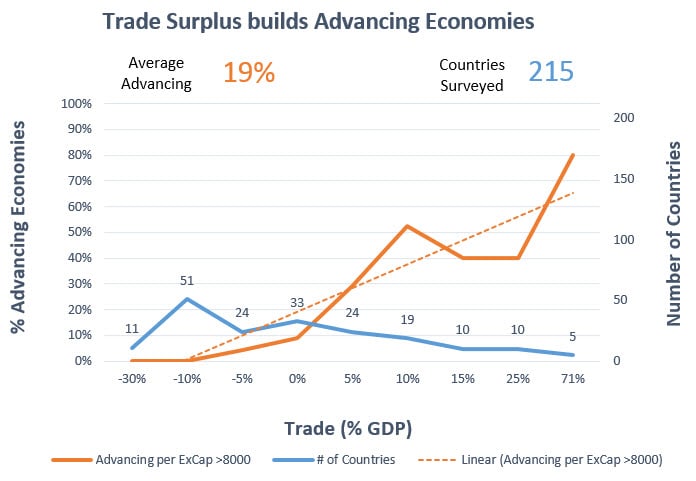
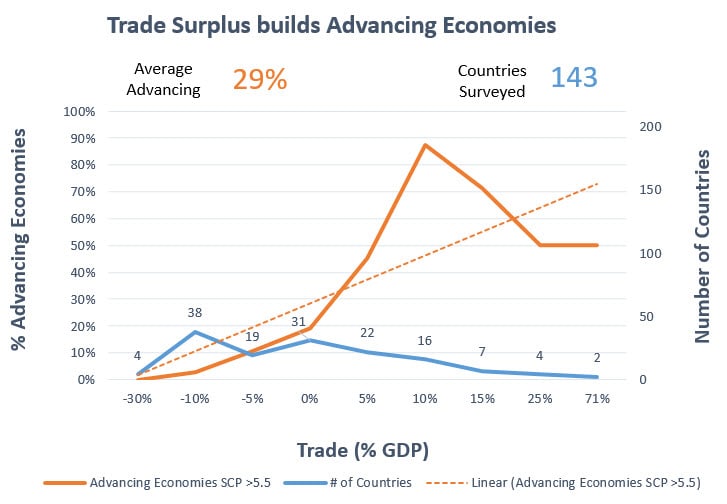
SCP over 5.5 (sometimes 5.8 – or similar)

Export – per Capita over $8000, or over 55% GDP
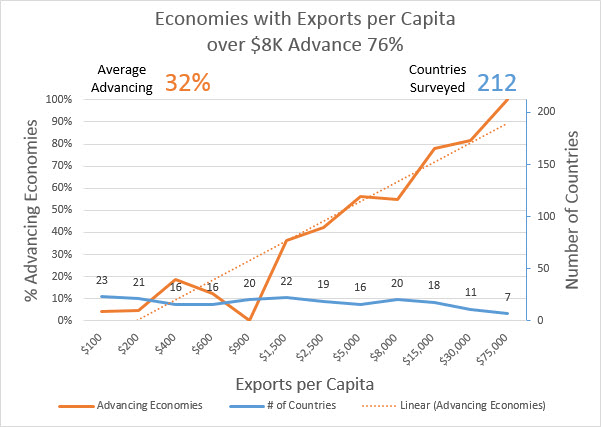
Social Contract
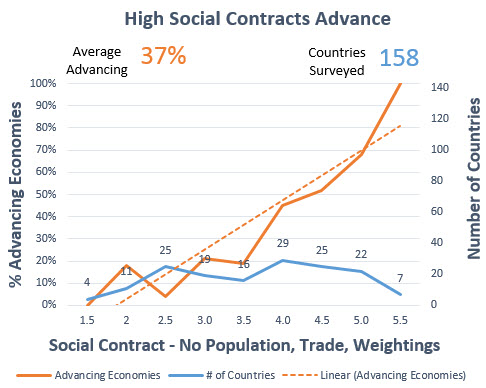
The value of Social Contract is there are no financial indicators in this index. There can be no biase in comparisons of trade metrics with this measure
TEP Sheets
TEP Sheets consolidate all TEP measures for all countries – per indicator. Charts on the right side of a sheet measure High Income Nations only

Probationary Measures:
These measures cannot be used individually as yet – because internal measures of economy are subject to many influences. Housing Bubbles (Usury), Salary to Cost-of-Living Imbalance (Low Social Contract), and other unsustainable policies that create dystopic conditions and stall economies, also report positively in a GDP report. We see this in the “GDP – 2008 to Today” TEP Chart
|
GDP-PPP per Capita – Top 30 Nations ($38k in 2017, $40k in 2018) |
GDP – 2008 to Today
|
|
Gross Capital Formation
|
 |
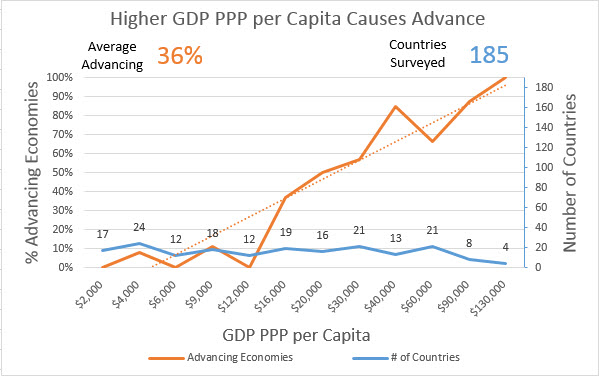


GDP-PPP per Capita appears Causal but simple GDP surveys overlook dystopic conditions too. Suggest using this measure only in combination with a high High Housing Index score or high Top-30 Social Contract score
Speaking of social measures, 94% of 70 High-Income nations have unsustainable birth rates today. Some nations lose more than 30% of their populations every 20-years to this today unreported – including Canada, Iceland, and Japan. Double Income Traps drive poverty, starvation wages, suicide, and economic stall, and 30 other serious social problems. These losses are 50% higher than Poland’s population loss in WWII, so encouraging female hiring, and perhaps also the female vote appears to be socially irresponsible policy, or even a Crime Against Humanity or Act of War – in these nations
The Science of 70%
Similar to the Pareto Principle (the 80/20 Rule) and Six Sigma quality control methods, The Science of 70% is used in Transition Economics to set threshold values for TEP Charts
Thresholds indicate an economy and society’s advance or collapse. A 70/30 Rule permits TE’s Data Science tools to sift through thousands of 220-nation-surveys to find the indicators that suggest high causality (by score and by rank) which are more important, and a strong or weak indicator of economic success
Like all terms, TE’s Advance and Collapse are “made up” – and specific to TE. What makes any term important, however, is that is measurable and scientific. “Advance” here indicates that economies can be expected to improve based on their causal indicators scores.
“Collapse“ indicates that a nation is falling short according its binary “Advancing” measures
Individual indicators that are observed to be perfectly Causal (to score 1.0 on a TEP survey), are a small percent of all measures; perhaps just 1-in-60 – totaling 30 indicators in total, but aggregation techniques permit thousands of causal index measures to be scored and ranked. This permits a top few indicators and indexes to emerge as the optimal measures of advance or collapse
It’s simple, and it’s repeatable, quantitative, and deterministic science too. TE proves that targeting causal policies to improve their scores can build advancing economies in every nation. This approach finds a higher probability of success and as most economies see trillions of daily transactions, the higher‑probability policies (decisions and programs) are certain of success in mathemitic and real‑world results
All that a nation needs to ensure Advance, is to improve their causal scores in social and economic development. Obviously, solving problems in just one area is not enough, its benefit will be over-matched by losses in ten other areas
TE Logos, Ads, and Badges
Tell two friends about Transition Economics – and for heavens sake make it viral. Students and nations are losing a fortune to our current curricula, let’s change that as soon as possible


Disambiguated TERMs
The USE CASE for Monetary Systems
Disambiguated terms for Monetary Systems and Government, Business, Finance and Social Policy, are essential to scientific problem-solving and Proofs
Nonsense (Non-Science) Theory include Left, Right,
and Separation of State from Religion
Left and Right Political Parties are harmful ideologies Feminism (anti-family-values) and Wealth Theory – while Advance is the only “side” and the only vote that we must all cast.
90% of large democracies are collapsing today because Constitution and election watchdogs allow unqualified foreign and oligarchy sponsored parties to fill up all of the positions on voting ballots. This is the reason that voters in any democracy must understand civics – and must understand which policies advance or collapse any nation.
Every voter can only vote irresponsibly – and for their own expensive and dangerous collapse.
Our Constitutions should protect us from this. Aristotle called democracies’ certain collapse an “evil” form of Government, but if your country is obviously collapsing today, then your Constitution is not protecting you from electoral system fraud, as it must.
When Constitutions protect us poorly, the administrators of the legal system – the Attourney General, Central Bank Chairman, Supreme Court, Elections, and Military leads – are all appointed by politicians. These appointed gatekeepers can then turn a blind eye to advance and instead favour their sponsor’s requests and demands to everyone’s detriment. We saw a clear case of this in the summer of 2022 as the Governor of the Bank of Canada announced that the decision to print money was at Canada’s Prime Minister’s insistance – and against the Bank of Canada staff’s advice.
The Bible – is not a religious book. Its an update of the successful Constitutions of Hammurabi and Ur’Nammu in ancient Persia (Iraq) – with storytelling and belief-based training teaching-tools to help assist our actioning the lessons of good values and proven laws that create a successful society reliably. The bible is a Civics Textbook that teaches us what to do to avoid the mistakes seen in collapsing societies for 4,000 years.
The Bible teaches Family Values are essential and warns against Wealth Theory that preempts human rights like a good home, reliable incomes, a family, education, justice, and a functioning society. Can you understand why failing democracies try to push out the Bible’s observation-based Civics teachings?
FDR was both a great leader and a student of civics and history. He saw these gaps in a US Constitution created by slave-owners trying to protect their “property”.
Economies are high transaction systems
Economies are high transaction systems, so policies with a high-probability-of-collapse will collapse any nation – with mathematic certainty.
Here in the following chart, we see that only collapse policies are offered in Canada (this is a 2019 survey that is unchanged today) – and Britain and the United States offered similar collapse policies to their electorates – in the past several federal and provincial/state elections as well.
Vote only for Sustainable Policy – anything else is Socially Irresponsible
Why is FDR’s Second Bill of Rights Scientific?
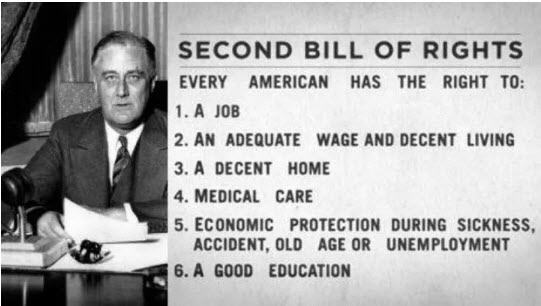
FDR’s “Second Bill of Rights policies” are proven to reset collapsed economies very successfully. FDR turned around a Great Depression and then these policies went on to create the Greatest Economy in history also.
EVERY large nation that runs his policies in Constitution today – is advancing, 70-years later. (Citation)
Science is observed success; and this success is real and truthful – and easily validated as well.
Policies of Nationalism/Culture (Conservative), Full-employment (Conservative), Social Contract (Liberal), Empathy (Liberal), wealth and income distributions (Liberal), debt forgiveness (Liberal), living wages (Liberal), low cost of living (Conservative?), Single Income Families (Conservative) and accessible homeownership with a titling system that made “capital” available to everyone (Liberal). These policies work well today and they worked well in the past.
See CSQ Research’s ACT Party Canada, America(not updated), Great Britain, etc. websites, for an in-depth explanation. FDR’s Second Bill of Rights explained successful strategic policy in 1944, and the countries that had these rules added to their Constitution after the war, still live the American Dream today – with some of the best economies per-capita in the world today – 70-years-later.
Social Contract is what soldiers fight for – and have died for, so there can be nothing unpatriotic about running policies that are proven to rebalance and turn around mature monetary system imbalances. Find a list of top Social Contract nations on The SCP Report here.
Great philosophers and authors like Lord Byron, Tolstoy, Dickens, Rousseau, Hobbes, Orwell, Hugo, and many others, have described the dystopic conditions created in mature, unbalanced monetary systems – when policies like Low-tax, Small government, Open markets, Immigration, Middle-income, Laissez-faire, and low Death-tax (inheritance tax) – created dystopic living conditions and dark-age economies.
Neoliberalism is a Timeless “Beast”
Not to be confused with Transition Economics, “Transition Economy” is what Ronald Reagan’s administration instructed Russia was the reason for the United States’s great success during Glasnost in 1980. Reagan was very wrong when he suggested that laissez-faire and neoliberalism built the greatest economy in history for Americans.
“Transition Economies – undergo economic deregulation / liberation, where market forces set prices rather than a central planning organization (gov’t) and trade barriers are removed, privatization of government-owned enterprises and resources, and the creation of a financial sector to facilitate the movement of private capital.”
Transition Economies, Neoliberalism, Libertarianism, etc. are harmful Wealth Theory ideologies entirely. The United States has collapsed steadily for forty years since Reagan began his deregulation of the United States. Americans are perhaps the greatest losers of any nation in history because of these changes, while nations that continue to run with FDRs regulations are ALL advancing today.
The Bible called economic powers that used neoliberalism “The Beast”, and it warned us against false ideologies (false idols) as a “10 Commandments” civics rule.
See Related article: Neoliberalism – the ideology at the root of all our problems
Transition Engineering’s Big Automations and Hybrid Economies
Transition Economics supports Hybrid Economies very well. Most large projects in the news today (Mars Launch, SpaceX, Tunnels, etc.) are distractions from the really important projects we need:
- Transition Engineering – the automation and delivery of all of our basic needs – see WorthwhileInc.com, and …
- Good Lives – The transition of token-based monetary economies to hybrid economy production models that ensure our needs that make us productive – versus our wants that are unproductive

At a point, our automations mean that it won’t make sense to pass tokens for the basic things we need any longer. As our food, housing, and other needs are delivered to us via automated assembly lines, tokens will only be needed for extra things we want but don’t necessarily need.
As productions are fully automated, we don’t need to pass tokens for those things any longer. This is the reason that futuristic shows like Star Trek, had no need of money. They had assembly lines, replicator technologies, and interesting lives that were only made possible because token-passing was unnecessary – and we will have this too at a point, if we can install some good leadership for a change.
Humanity will suffer unnecessarily, and it might obliterate itself too – if these transitions aren’t well-understood and properly planned and implemented.
This is “Leadership 101” – although it might seem very advanced, foreign, or even inaccessible – based on the curriculums we are taught in our universities today. Rest assured that the notion this is impossible, is only true due to our present very low standards in academics today.
See Notice to Academic Institutions to understand academia’s shortcomings better.
Climate and the Environment
Transition Economics was developed by an engineer who realized that climate problems are solved through both projects and in operations too. An ounce of prevention is worth a pound of cure, so the design of operations – in mining, forestry, manufacturing, and every other industry, must always consider Climate and Environment as fundamentally important.
Heat can be beamed into space, air can be scrubbed, ozone can be produced, plastics can be cleaned from our oceans and beaches, and so on.
Every problem has a solution, unlike political parties that might prefer to try to convince you that there is no “Silver Bullet” to correct something.
Climate is addressable by business Operational SOPs and Special Projects; AND, it never created a World War.
Social Contract, alternatively, creates a powder-keg that has sparked to ignite a World War reliably – many times in history. By the timings of World Wars I & II, World War III (an extinction-level event) could commence between 2018 and 2028 – if Social Contracts are not rebalanced and tensions are not reduced responsibly and peacefully.
As priorities go, Climate and the Environment must take a distant second priority to Social Contract and Inequality – especially in a mature capitalism like today. Fortunately, there is no reason why we can’t do both things at the same time; anyone who tells you differently is no credible leader.
Large Democracies need FDR’s Social Contract in Constitution
TE explains that Social Problems are worse in large democracies (in populations greater than 15-million) than in any other form of Government.
The “FDR-Democracies” are a notable exception, as these are countries that added Roosevelt’s Second Bill of Rights (straight from the Bible) to their Constitutions – after World War II.
Today, all of these nations have advancing economies, great schools, great healthcare, six weeks vacation, and much lower taxes than the American private-insurance boondoggle. It’s also true to say that several modern monarchies are running more effectively than large democracies in today’s mature capitalism – in fairness. The countries that lost the war, won the peace.
Adding to voter confusion is the fact that many “Capitalist” policies which worked well to monetize the enormous opportunity that was available early in a monetary system cycle, will reliably damage social contracts and economies later in a monetary system cycle.
Today the U.S.’s policies cause it to lose $29 billion a day in exports, and there is nothing conservative nor pragmatic about failing to correct those losses and costs. I mentioned above that today’s mature capitalism was preceded by more than thirty previous recorded mature capitalisms.
The Bible and Code of Hammurabi both discuss strategies similar to FDR’s and yet none of us are trained in how to manage our democracies. Without responsible Civics training in school, and with no understanding of how to build the scientific society explained in the Bible (ever since our schools turned secular), we must now struggle to understand how to vote based on what we see on multi-billion dollar television channels.
This education shortfall was irresponsible in any era – but in a mature nuclear age, it’s dangerous and impermissible really. CSQ Research’s 16-week high-school Civics course, CSQ Common Sense 101 addresses this need and training curriculum
Inequity stalls Growth and builds Debt
 Transition Economics is essential today because our economies have run their normal course and are no-longer sustainable by the status-quo policies that worked so well at the start of a new “boom” economic cycle in the 1950s. Government did not have to protect Social Contracts as individuals had sufficient opportunity to do this for themselves. Per the normal cyclic behaviour of 60-year repeating capitalist economies, our economy will collapse until we realize that we must change our Conservative Right Policy to permit a responsible economic reset to take place. To order the book Transition Economics, click here.
 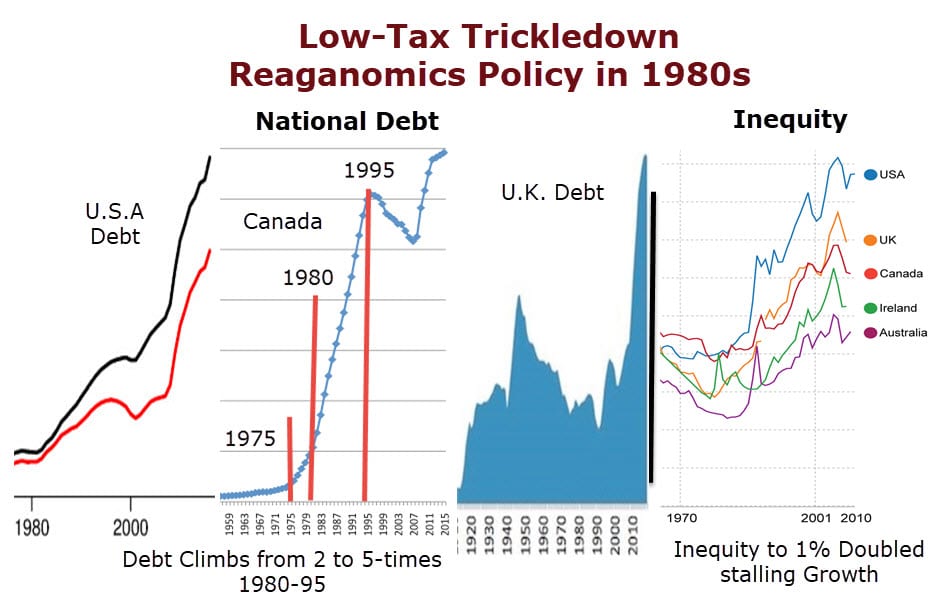 We see the same phenomenon in any Monopoly Game. Strategies that worked well at the start of a game, do not work at all near the end of the game. But if we change the rules, so that the victor returns a significant percentage of assets to the players of the game so that all can be productive and enjoy the game, this game can continue sustainably for an indefinite period of time.
In the Transition Economics chart above we see Opportunity is a waving black line; high at the beginning of a cycle and low in a mature capitalism. TE-Mature Policies vary – from capitalistic, monetizing policies early on in the cycle, back to sustainable, affordable policies as needed to reset Opportunity. These adjustments have resulted in a steady line of Opportunity in Norway, Ireland and most small-democracy and Monarchy-led nations today.
Credible Economists recognize Longwave cycles of economic boom and bust, as documented 40-times back to Ancient Babylon on the Code of Hammurabi (1763 BCE) and in Leviticus 25/26. TE Maturity Models and TEP Charts discuss #TEMature policies that sustain Spring Economies and avoid Winters altogether, but if these steps are not taught to governments and not enacted, Winter Phase economies MUST switch to a number of key new policies in housing, in guaranteed reverse-tax incomes, and in automation engineering supports which can safely and responsibly restore incomes, spending power and restart a new and viable Economic Cycle once again – without war and revolution. 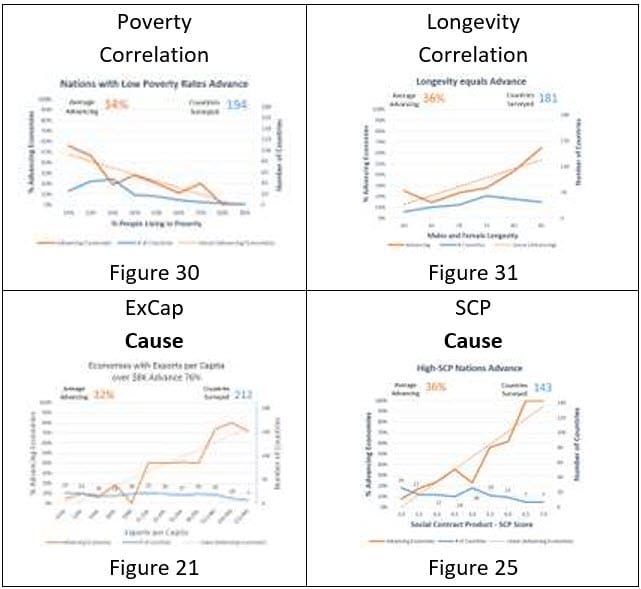 Failing this Transition, economies continue right along a collapse-trending – until either “new wealth” (as in the California Gold Rush example above, which ended the Great Depression of 1837), or responsible government policy intervenes. Without these resets, we have seen wars / revolutions / populism / dark ages and similar disastrous events reset the economic cycle by distributing wealth forcefully. This is what John F. Kennedy explained in 1962 …
“Those who make peaceful revolution impossible will make violent revolution inevitable”
Mature capitalisms are normal, predictable, and correctable – and so are the wars and hardship they create. Once we teach our high-school students (and future voters) the strategies that proactively prevent these collapses, we should be able to maintain a sustainable capitalism indefinitely. The quicker and more thoroughly we reset to a new 60-year Financial Cycle, the quicker we will all realize a Good Life in a new boom economy. 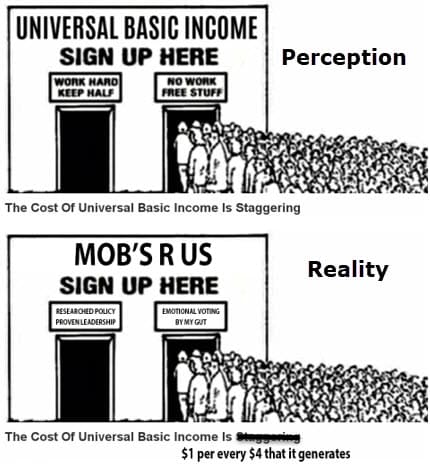
Adoption
What barriers can there be to adopting an simple, transparent, scientific approach that rebuilds economies reliably? It took Einstein’s 1905 Theory of Relativity 20-years to be accepted in the west
Adoption, the normal resistance to any change, is the elephant in the room that will slow TE’s acceptance similarly. Human nature explains that our professors, awarded Nobel laureates, experts, and schools have all written textbooks, authored articles, lectured, peer-reviewed one another – and all of it has been based on easily proven-failed theory
A job title makes no-one an expert, and the Swedish Central Bank’s Nobel Prize has awarded only unscientific theory ever since its inception in 1968. Fictions have vaulted non-experts and therefore non-leaders, into high positions as economic leads, and these people have been asked to create important policy and programs based on their mastery of their proven-failed theory (fiction). This is a serious miss, for academics and peer-review processes, that is going to require some hard introspection, explanation, and KPI-driven performance management to correct
As individuals, it’s not our fault that we didn’t understand all of the observations that govern responsible civics. We need training and we didn’t have data as well. Bloodletting and lobotomies were the highest forms of pseudo-science not so many years ago, and then those practices were discounted in a never-ending cycle of new learning and adoption
A simple new science like TE proves that leadership, education, and approach/processes have been sub-standard, and also harmful; bruising egos and besmirching the reputations of high-IQ, well-intended, and previously-esteemed researchers and teachers. In hyper-competitive mature capitalisms, there are compelling personal and professional reasons for faculty to reject, discount, or adopt-indirectly a new science only by their own explanations and non-standard terms
TE is a big challenge for existing social faculties because it is a computer science, which means faculties presently filled with thousands of math professors, are unqualified to teach and supervise TE
Given unlimited time, economics teachers will learn computer science, will update their skills and research, and assimilate the new learning while minimizing professional embarrassment
The problem with allowing adoption to take a normal course, is that TE is important and needed now – today. Universities, therefore, must minimize normal adoption delays so that a scientific approach can lift today’s dangerous social and economic collapses as quickly as possible
A Context-Driven Approach
Important to any presentation of statistical information – is Context. First, presentations must compare successful nations, they must use most recent data, and they must present only credible measures. An example of a credible measure is any measure that is proven highly causal to an advancing economy. Context in history is relevant too; Debt was forgiven for most European countries in the 1930s from 25% to 250% of their GDP 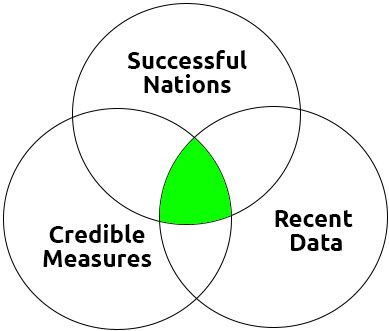 Is a 3% Salary increase good? No – it’s an embarrassing stat. Since the 1980s, individual and household salaries haven’t budged. It would take a 100% increase just to come back to balance. Are stock market ups and downs meaningful? No. GDP lifts – No. See Credible Measures explained in the Proofs of the World at our Hands Report
Important Roles and Planning
Right Plans – not Macroeconomic Frameworks, (See the World at our Hands Report) are important to build and manage in every nation
The important role of Academia is to prepare our adults and children to understand and maintain a Sustainable Society. Despite our investment in universities and in the teaching of business and economics faculties for 2500-years, however, 68% of 220 countries find that their economy is collapse-trending and that large percentages of their population are unproductive today. See TASK (The Academic Sustainable Societies Challenge)
Capitalism is a meaningless term; Herbert Hoover’s capitalism created the Great Depression, while FDR’s capitalism monetized the abundant productions born of abundant opportunities to do so.
Social Contract is critical and causal to economic success or collapse in all economies and monetary system phases. A strong social contract builds a strong economy 100%; a low social contract creates a collapse-trending economy 100%
Businesses monetize economic opportunity but are unsustainable too. SDG companies must be SEEDed and all need monitored for economic contribution
Governments must also balance a hybrid system of token-passing and entirely-automated non-token passing. Business and finance are unsustainable by design so monetary cycles must be actively managed
Hybrid Economies – As automation continues, governments must transition to a completely automated provisioning of our Good Lives. Sometimes, things we need must be free, and token-based should be there for some of the things we want
Economic Reset of our token-passing monetary system economies, so that they can balance incomes to cost of living proactively – and this will restart a fresh new monetary system cycle once again
Transition Engineering
See a full explanation of “Who does What” at WAOH – World at our Hands Report
When unsustainable policies detriment the economy and population, businesses are impacted too. GDP reports hide productivity losses – as do accounting and finance industry reporting – and bonus systems. In this way, trillions of dollars are lost annually to economies suffering from low opportunity created by their weak social contracts. Social Contract loss is estimated to cost every nation an average of $4.3 billion per day
Fruitless currency wars fail to bolster growth; populism and trade wars follow while a powderkeg of political stress can ignite into real wars.
Or, we can simply create real opportunities – without war, as FDR’s policies did.
The science of Transition Economics (TE) explains that Aristotelean Right Plans build and maintain sustainable economies and societies. Right Plans have two parts: the first part explains sustainable economic policies, and the second sustainably produces the goods, services, and well-being we all need. CSQ Research curates two engineering plans for these latter needs – Worthwhile Projects #WPProjects is U.N.-led plan, and Worthwhile Industries is Finance and Government-led  Transition Economics ensures that only proven, sustainable Government Policy is permitted at ballot boxes, as this is critical to large democracies during mature capitalisms. It seems that small democracies can more readily recognize and vote for sustainable policies by themselves, New Zealand’s five-million population manage without even a Constitution. In today’s mature capitalism, ALL large democracies that don’t have FDR’s Second Bill of Rights in Constitution – have collapse-trending economies
Engineering Worldwide Abundance
Managing Mature Capitalisms
Transitions to scientific policy brings a strong strategic plan, great education, best-practice epistemology – in project and change management process, and inreporting
1837’s Great Depression was ended in the USA by a small population of 12-million Americans who re-invested their ten-times-increased Gold Reserves from the California Gold Rush. Opportunity reset that U.S. economy, from a Great Depression that was worse than the 1930’s Great Depression
These policy changes created the Industrial Revolution of the 1850s, and these fact makes one realize that today’s offshore storage of corporate profit is not a sustainable policy
Like then, war is completely avoidable and even “immature” in Transition Economics terminology. It only takes your vote to correct economic turmoil and RESET to balance once again. Read about the ACT Party to understand how to quickly implement Transition Economics Resets in any nation.
End of War is “the” goto Democratic Reform standard for a cited explanation of how we can transform our systems of democracy to work well for large populations. Larger civilizations should make life easier for everyone – in theory, but the reality is that our constitutions were designed when we were small-population nations.
These systems were not designed to prevent oligarchies, nor to prevent unsustainable policies that profit a few elites but otherwise lead to the austerity and starvation wages that created World Wars I and II. No Economic Policy is uncorrectable – in Housing, Unemployment, Welfare, Taxation, Commerce, etc. and Transition Economics explains the research and methods to make changes responsibly
 |
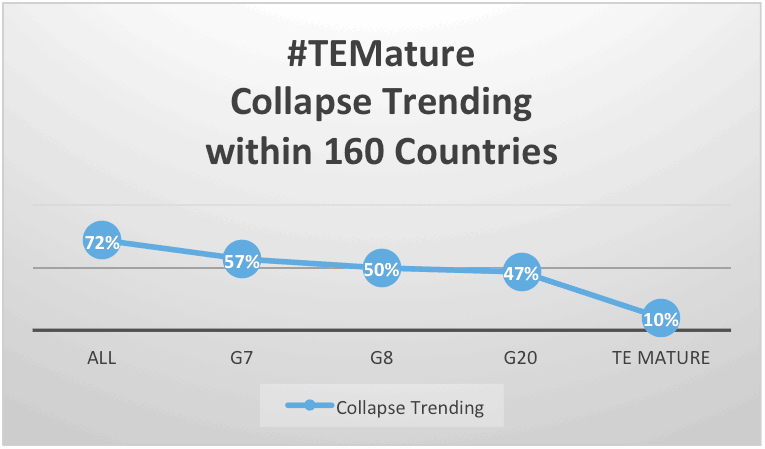 |
Click here to read about TE Maturity Modeling and TE-Mature Policy
Fully 68% of global economies were in a Collapse trending at the time of this writing. Transition Economics (TE) offers an important teaching and learning framework that explains imbalance is normal and correctable This impromptu video is out-of-date and needs refreshed, but it captures a snapshot in time during the early development of Transition Economics before a Sustainable Societies Programme was formalized at CSQ Research
World War III by 2030?
Similar to the wars per decade line in this chart, we see similar 60-year “U”-shapes in statistics for inequity, debt, savings, Bond Yield, PPI (U.S. Pricing) and also in social KPIs from longevity, unemployment rates, suicide rates, and similar.

To avoid nuclear winter, Col. Richard Black is a US Senator who explains honestly the dangerous game that a global military complex with global media coercion plays today
- “We use unlimited force and violence while controlling global media to erase discussion of what’s truly happening.”
- “We and NATO do not care how many of our proxy Ukrainian women, children, or young men are killed.”
- “Russia’s appeals for peace were ignored until it was forced to conduct an obviously very cautious special operation against brother slavs.”
If the timing of starts for World Wars I & II were to repeat, a failure to correct Social Contracts by 2030 could very well result in World War III.
Today’s is the first mature capitalism to take place in a mature nuclear era. For anyone who isn’t very clear on this point, World War III could be an extinction-level event affecting 100% of the human population of this planet.
The primary concern of Transition Economics, therefore, is to identify the necessary ongoing adjustments in Economic Controls and Government Policy that must be made in order to manage the balance in a naturally recurring 60-year Monetary System Cycle.
Simple Compound Inflation
Why do we collapse every 60-years?
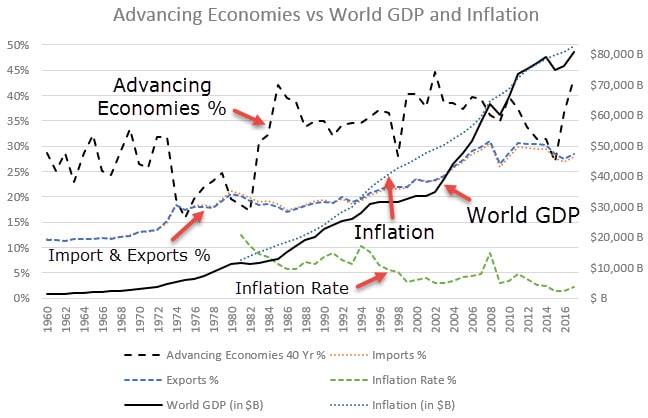 Today’s World GDP is fifty-nine times the GDP in 1960. A 1% inflation rate now, amounts to a 60-times increase in cost-of-living and spending by 1960’s measures.
Why has there been such a large increase – and why are these exponential increases a mathematical certainty?
Annual inflation is calculated from GDP values taken one year prior, which included all of the accumulated inflations of prior periods. Like interest rates, a 10% inflation last year plus a 10% inflation this year, does not amount to a 20% increase, it amounts to a two-year increase of 21%, a five-year increase of 61%, and so on. Today, 1% to 14% annual inflation rates have compounded for 60-years from the start of our present monetary system cycle.
If salary to cost-of-living ratios get out of balance (and they usually do), the gap – like the inflations, increase exponentially – and this guarantees that monetary systems are not sustainable without either ongoing balancing or a “Reset”.
Controls in housing, monetary systems, interest rates, and wealth distribution, must change as the monetary system cycle matures.
Kondratiev called these phases: expansion, boom, recession, and depression – or Spring, Summer, Fall, and Winter. The black line in the chart below notes opportunity within an economy – as it changes ; higher in booms and lower in depressions.
Great Depressions have come every 60-years in capitalist societies; or sooner, if inequality failed to be reset properly in the previous cycle. The European Dark Ages (500 -1300 AD approximately) is an example of a global economy that never reset inequity until it remained in depression for hundreds of years.
World War II was certainly created by inequity as was World War I and dozens of revolutions globally when governments failed to reset inequity after the Panic of 1893.
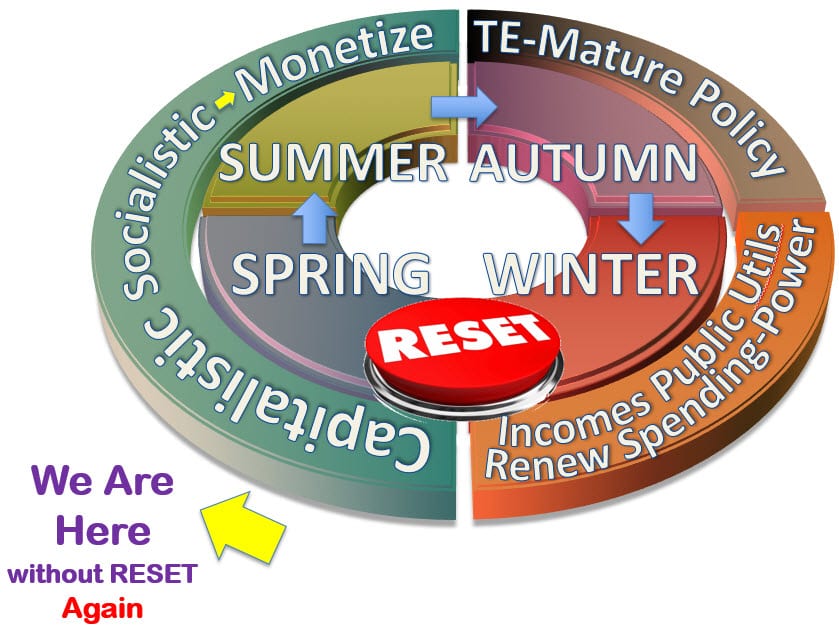 |
 |
 |
Kondratieff first wrote about this phenomenon of Longwaves in 1925; Howard Schumpeter brought the study of Longwave Economics to Harvard in the 1940s, which he renamed Kondratieff Waves in tribute to its founder – or simply K-Waves. K-Waves in Capitalist societies have since been confirmed back to 930 AD China in numerous academic thesis, and Edward Tilley suggested in 2015 that these phenomena are confirmed again in records of the Economic Controls, the pre-emptive 50-year corrections made by “Jubilees” (Debt forgiveness & Wealth Redistribution), that are recorded on the 1760 BCE Code of Hammurabi and also Leviticus 25-26.
Click on charts to see Hi-Res image …
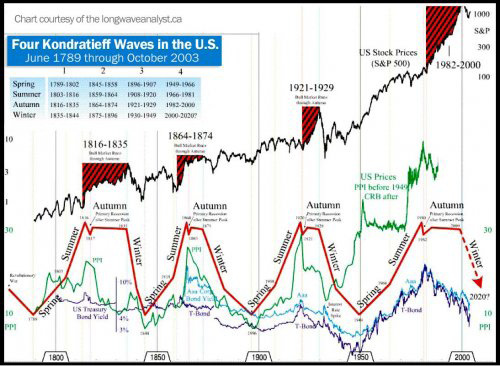 |
 |
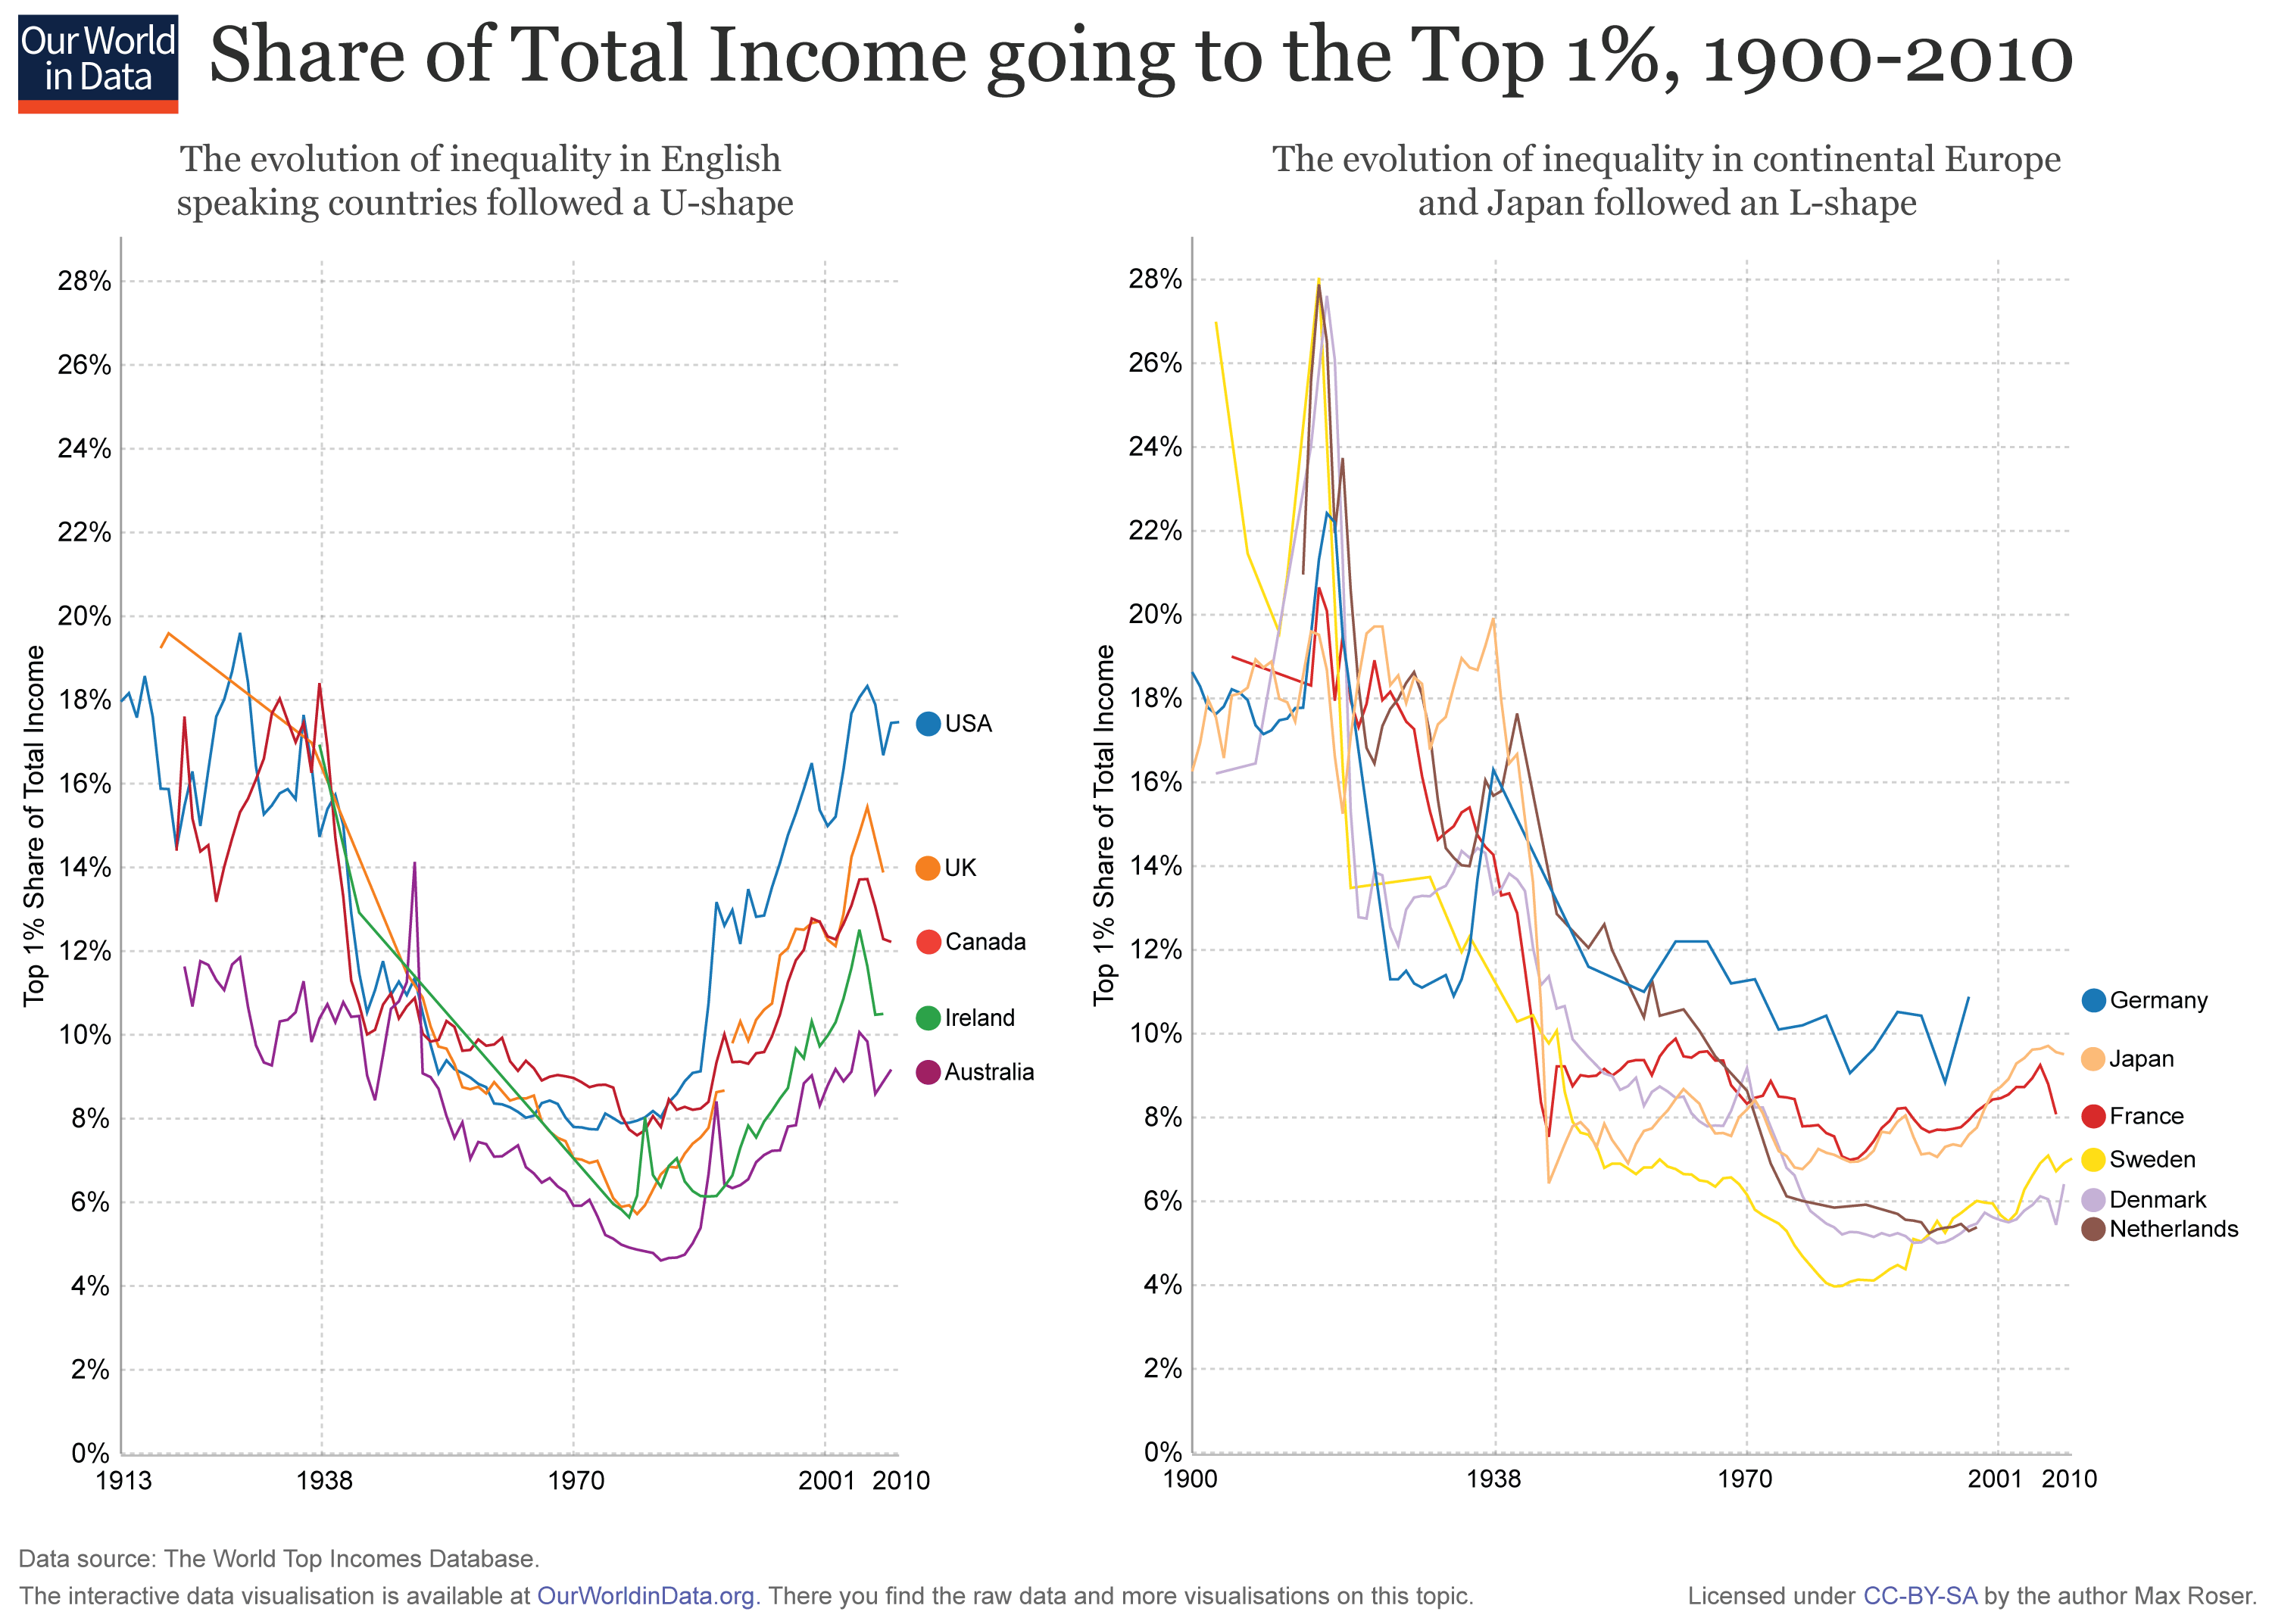 |
In the right-most chart, note how some countries were able to keep inequity from forming a U-shape again as the monetary cycle matured, while other countries could not.
What about the leaders of Monetary System Cycles?
Great Leaders make the Monopoly Game Sustainable
At the point where players begin to drop out of a Monopoly Game, Transition Economics introduces new rules and new policies, that reset the ability of all players to continue – and to be prosperous indefinitely. In the same way that policy changes restart or sustain a game of Monopoly, a new cycle of the monetary system must be initiated too.
FDR (Franklin Delanor Roosevelt) created the greatest economy in history – the American Dream – with policies of Nationalism, Full-Employment, an empathetic strong social contract – which included social programs, low costs-of-living that also afforded titled-property home ownership, and perhaps the greatest contribution – debt forgiveness and wealth distribution. For 20-years, America taxed the rich 92% income tax and 80% estate tax. The correction of inequity and a strong manufacturing demand with high living wages – was all it took
Henry Ford’s High Industrial Wages created Prosperous Economies
Henry Ford – made the greatest contribution of all time to international economic growth, through his living wage policy. We see in this chart that the first industrial revolution’s sweat-houses in the 1750s made no significant economic impact. The second industrial revolution of the 1890s was a different story because of Henry Ford’s high wage policies that rippled out across industrializing nations
Adolf Hitler – turned Germany’s economy around even faster than FDR – through Nationalism, Full-Employment, Social Contract and wealth distribution, but his administration forgot essential “Empathy”. Respect – toward both neighbors and Germany’s own citizens, was the failing that undid any benefits or accomplishments. This is seen in the downfall of most failed civilizations through history – Roman, Mongal, Byzantine, and so on
Donald Trump – Addressed: Nationalism, Full-Employment, Low-Immigration Unaddressed: Dramatic improvements in Social Contract, half inequity, Empathy & Respect (Right and Left is irrelevant; only sustainable policy matters and there is only one side), Cost-of-living, debt forgiveness, and affordable homeownership
Sustainable Policy: are the Causal and Sustainable Policies presented in the World at our Hands Report
Unsustainable Policy – in Mature Capitalisms: Low-Tax, Death-Tax, Small Government, Open Markets, Middle Class, Usury, High Cost of Living, Globalization, Immigration – read Dickens, Tolstoy, Byron, Hobbes, Rousseau, Hugo, Hammurabi, and others to understand the dystopias that these policies built during various mature capitalisms. The American War for Independence took place in a mature capitalism, as did the French Revolution, Russian Revolution, Age of Enlightenment, and the transition from Monarchies. The fall of most empires through history can be explained by that group’s adoption of unsustainable policies …
Yes, of course we are in a Great Depression today – there is a “problem” to solve. Wealth Redistribution Policies are needed urgently in housing (perhaps by revisiting land grants instead of Usury through unpayable mortgages), Interest Rate recovery protections, Usury Prevention Laws, Graduated Tax (92% for Rich), Offshoring & Foreign Ownership Protections, Income guarantees, and working Safety-nets, Automation of Basics of Life – see #WPProjects.
The Good News? The deeper the Wealth Redistributions in a Winter Phase and reset; the longer and more successful is the next new 60-year monetary system cycle – and American Dream.
Vote only for Scientific Policy – anything less is Socially Irresponsible
The Trap? Is that Right and Left Policies are irrelevant. Today Right and Left Political Parties sponsor unsustainable policies only – Zero Sustainable Policies – with the corresponding high-probability of collapsing your nation reliably via those low-probability-of-success policies. Every vote becomes socially irresponsible, and that is The Trap we see in large democracies that didn’t embed FDR’s Second Bill of Rights into their Constitution today. We saw this 2019’s October’s Canadian Federal Election very clearly …
Inequity is expensive. Who is paying the bills?
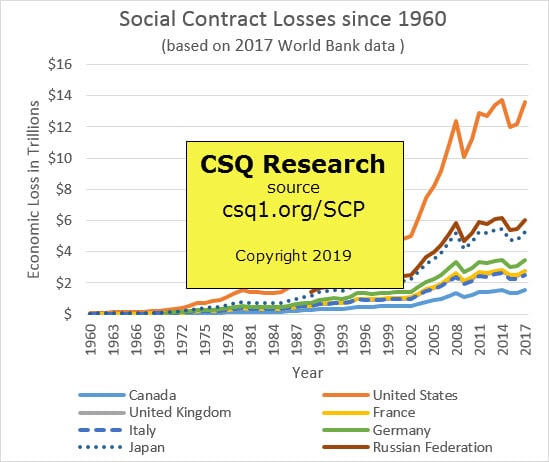 In any discussion of Economy, it’s important to realize that WE ALL ARE paying the bills – and, in our FIAT system, money is printed from thin air in many cases also. Financial Inequity costs $4 for every $1 spent to maintain it.
Have you noticed that we respond very differently to the terms Safety Net and Welfare? Why do you suppose this is? Governments print money and taxing the rich is proven to build the greatest economy in history too, so why do we balk at Universal Basic Income solutions that protect our national productivity and provide for a safety net when needed?
We can have performance bonuses and rich people, but when a large percentage of citizens do not have the opportunity to produce export wealth for a country, it makes the economic pie smaller and costs economies trillions of dollars annually To understand the important role of supports for the Middle Class AND for “The 49%”, see this article.  During this next turn of the cycle, we are also transitioning from our current Manual Economy to an Automated Economy. Our technology has advanced sufficiently to support this important event in our Human Evolution and this is a really exciting time because automation that gives us the basics of life – like food, energy, shelter, and transportation automatically – can be considered – Renewable.
Once Renewable Automations are scaled to the entire planet, we might never have to transition out of another Capitalist Cycle again – not 60-years from now – nor forever. Our reliance on money diminishes with this automation until we can finally ween off of any counter-productive influences that debt and monetary policies have brought into our societies as well.
“Imagine how foolish will we all look once we have permitted special interests to safeguard inequity – even at the potential risk of obliterating all in a nuclear war – at the very same time that humanity could be deploying our renewable automations to make money as unnecessary as we might like?”
Transition Economics – Edward Tilley, 2016
Transition Economics guides you through the Scientific Method of aligning policies that work to accomplish both Automation and a renewed, sustainable Cyclic Prosperity easily.
Automation and Jobs
 Strong Social Contracts build strong Economies, and they are inexpensive too once robots build life-cycle-managed housing automatically.
No-one starves – when food is delivered to every home without a human hand required too.
Like Google’s Driverless Car project in 2013, food and shelter are both examples of automation projects that can be built within just 2 to 5 years. There is also no “emerging” technology required here either; it only takes focus and leadership to build socially important assembly lines that also build a self-sustainable strong economy.
Social innovation just takes good leadership, SEED Investment, and strong processes.  Automations are forecast to reduce the total number of jobs by up to 50% over the next 20 years; that’s approximately 970 jobs lost per month per million population, lost per month.
Jobs being lost to automation are not new, the automated weave, Bessemer Steel Process, the cotton gin, water pumps, electricity, farm tractors, and modern assembly lines have all reduced the need for repetitive labor jobs. Thousands of lives were lost to riots and hardship in these transitions when Governments failed to ensure a strong social contract.
“Government for the People” is Leadership and what we need, Democracy is just “Government by the People”.
Leadership must ensure that it supports the transit of its citizens to other forms of income and retraining through these innovation-driven changes
Transition Economics studies the relationships between social contracts, automation, exports, guaranteed incomes, government investment, and infrastructure spending. Doing this has proved that society and economy are inseparable – and that social contract must come first as well. In science, Mankind is our Business – and first priority.
TE Mature Policy & Models
Transition Economics is a new science. There is much work ahead as can be seen from TE’s beginnings in 2016, when we first looked to Maturity Models to plan the work of building Transition Economics and Transition Engineering – self-sufficiency and prosperity in every country globally.
Click here to view Transition Economics’s Maturity Models and TE-Mature Policy 