The World’s Largest Context-Driven Online Econometric Library
Aggregates
Transition Economics (TE) Indexes
Method 10: Aggregation – Indexed Indicators
Transition Economics permits Proofs (TEP Charts) using indices created by combining multiple measures, similar to the S&P 500 Index. MEMS typically curates s a list of 50,000 aggregates that create causal Indexes and 20,000 are reported here below on WAOH.
An econometrics library of Indexed indicators must align very closely to the conventions explained in our USE CASE and Terms for Monetary Systems. Some care has gone into ensuring that terms are disambiguated, with one meaning and not multiple ambiguous meanings; so as to avoid proofs for weaponizable ambiguities like Socialism, Liberalism, Capitalism, and similar ideologies
- Note: “Indicators” are individual measures of either economic or social performance – GDP, Suicide Rates, Longevity, etc. World Bank catalogs 1500 indicators, OECD keeps hundreds more, and the WAOH Econometrics Library consolidates dozens of cited data sources in total. All charts are cited either here on the webpage, in csq1.org/SSP theses, or in MEMS Data Science tools
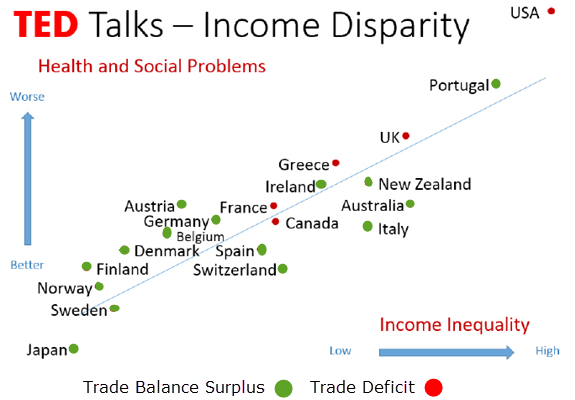
 The Social Contract and Social Contract Product (SCP) TEPs below, measure a mix of indicators selected from thirteen social problems and measures suggested by Professor Wilkenson’s University of Edinburgh team in their 2013 study of Social Contract measures. Their TED Chart summarized statistics collected by every nation for suicide rates, divorce rates, longevity, poverty, trust, obesity, teenage births, mental illness, addiction, math & literacy, social mobility, and imprisonment. See those Charts here When combined, they create an index and the following TEPs:
 |
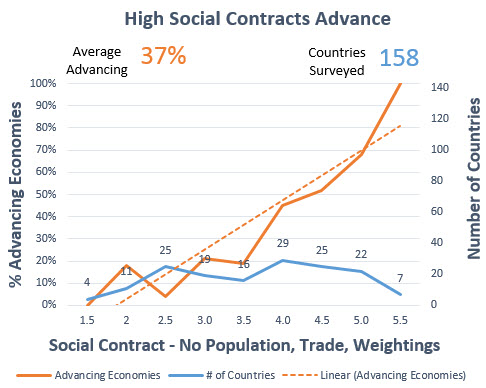 |
Social Contracts are improved by abundance in food, shelter, incomes, security, healthcare, education, etc. Each year, the Social Contract TEP Chart is an unweighted measure of the most economically beneficial social measures. In 2019, it used:
Social Contract |
= |
 Education |
+ |
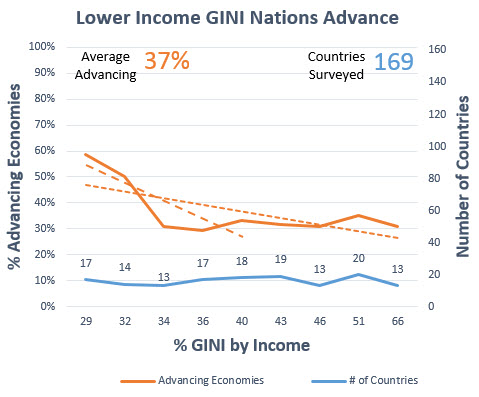 Income Inequity |
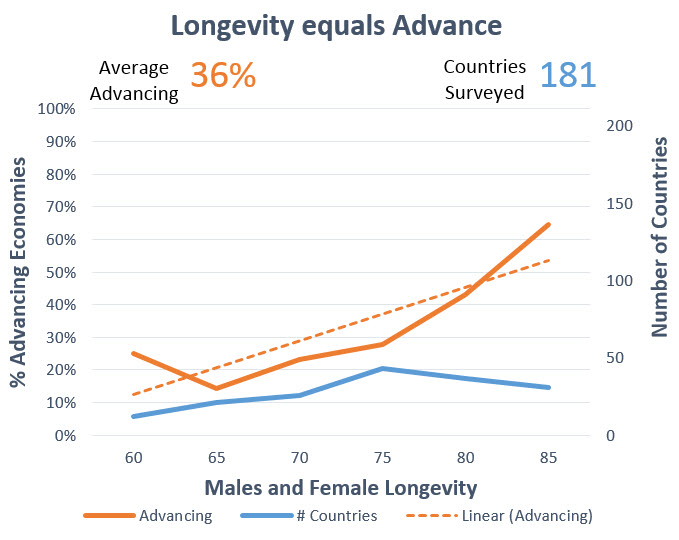 Longevity |
 Suicide |
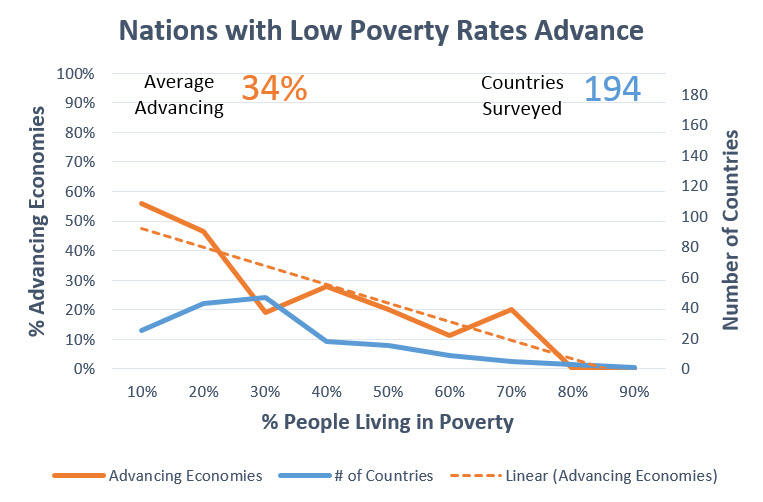 Poverty |
The SCP Report (Social Contract Product), is a sometimes-weighted measure that adds the most beneficial financial measures to the Social Contract measure explained above:
The SCP Report |
= |
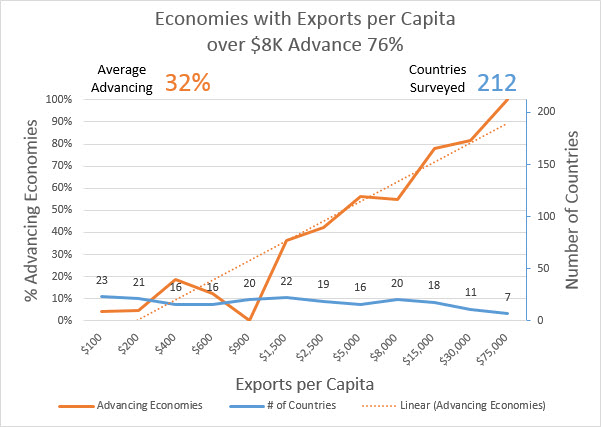 Export per Capita |
 Trade Balance |
 Debt |
+ |
Social Contract |
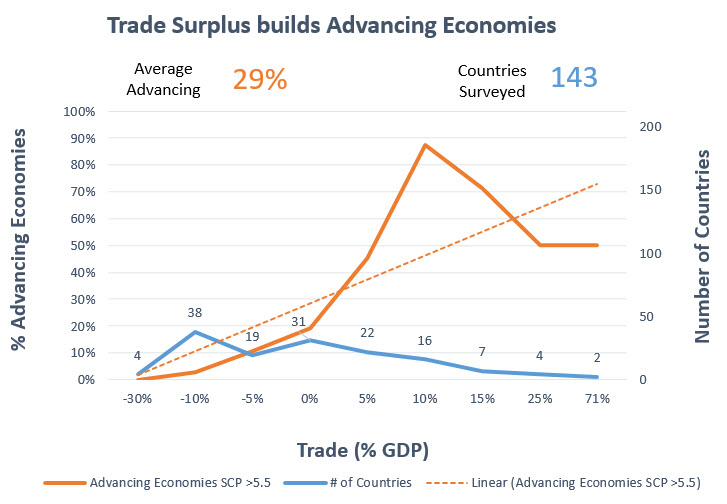
Trade Balance is higher in high Social Contract Nations
Consistent with Professor Wilkenson’s team findings, TEP charts confirm that countries with low social problems have high Social Contracts AND Advancing Economies 100% of the time. AND, these facts prove that Social Contract is a causal indicator as well.
Social Contract Product (SCP) adds economic measures – like export-per-capita and trade balance, to Social Contract’s measures of social conditions.
A list of many Causal reports are summarized on the left-most “Causal” tab of the WAOH library
When we combine indicators into one Index, we have to normalize each indicator by its Rank, Mean (-1 to 1), or Min/Max (0 to 1), and we also have to differentiate measures where a good value is low and a bad measure high.
For example: “Export per Capita” is always better to report as a high value. “Infant Mortality” reports, alternatively, are best to score as a low value.
Because many of our indexes use positive and negative values, we recommend Mean averaging – but MEMS permits users to choose any of these three data normalization methods as you prefer.
The ability to choose normalization methods can make for some interesting but minor shifts. The lesson-learned from this discussion is to never be too worried about which country placed first or second. Top-5 and Top-10 rankings are equally impressive in a field of 220 nations.
The first 2019 SCP Report did not have access to the “World at our Hands Report” library – and still, it predicts advancing economies better than any of the United Nations HDI and Happiness Reports. For 2020, The SCP Report will be guided by MEMS, the most sophisticated econometric data science tool yet for TE, so 2020 should create the most statistically causal Indexes possible.
CSQ Research
MEMS permits not only aggregates to be created and trended over time easily, but it also scans all combinations of aggregate possibilities to find the optimal aggregates available.


