The World’s Largest Context-Driven Online Econometric Library
ABOUT WAOH

About WAOH – The WAOH World at Our Hands Report
WAOH – The World at our Hands Report – is an econometrics library that sequences all current confirmed Sustainable and Unsustainable Policy Indicators and Indices – in-context. The library is a thesis-based collection of public, social, business, and finance policy – ranked by causality and proven track record. 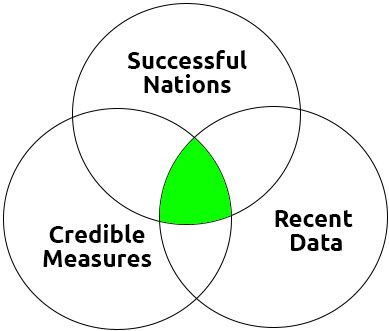
Context – means that conclusions are qualified to be either important (sustainable), or meaningless (neutral), or collapsing (unsustainable). Context ensures that data deserves its place in comparison and is useful
Your nation’s stats must be:
- compared to successful nations – and not to collapsing nations,
- the data must be up-to-date, consistently gathered nation by nation, and accurate
- both the source of data, and any relationships claimed to depend upon it, must be credible
Credible Context
When we are asked to determine the benefit of a national education system, would you look to the number of years that students attend school alone? Likely not. This is why TASK extends the United Nation’s Education Index to include Socioeconomic Productivity – SCP.
If asked to determine the value of a healthcare system, do you count the number of bandages consumed or money spent? No, this could be misleading, so you look to longevity nationally to establish a credible measure
As in any science, conclusions must also be observably true today and in history as well
Transition Economics is a predictive science in part because these quality assurances are considered important and maintained
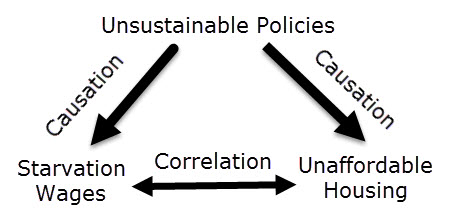
Unsustainable Policy is Causal to Collapse in many forms


Methods and Programs look at our world in different ways:
 Method 1 of the Library contains the policies and measures which are proven causal, important and sustainable, unimportant, and also harmful
The Table of Contents on the left is from “The Book” and Global Leadership Book of Knowledge
Method 2 at WAOH introduces data science
Method 3 as an Aristotelean Right Plan – what IMF or World Bank calls a Macroeconomic Framework
The webpage tabs above permit visitors to view Methods that are fully explained in the reference guide GL-BOK
Why does WAOH work?
Casinos are proven to be recession-proof businesses because their games offer a higher percentage probability of advance for the house, but they only work reliably with enough transactions
TE leverages highest-probability transactions similar to casinos, but because economies have an almost limitless number of transactions, success is assured. In science, therefore, economies advance or collapse 100% based on the probability of success offered by their policies
WAOH works because economies are high-transaction systems and it uses quantitative evidence-based and probability-based sciences only
Why is WAOH important?
Planning – is an essential responsibility of national leadership that is completely ignored in large democracies today. WAOH uses data sciences like TE to understand useful context and importance from a sea of mostly-meaningless statistics. Understanding what are our true priorities, assists planners in setting smart targets that have the highest probability of creating economic growth.
If you can only vote for a left or right political party that both employ unemportant policies which are proven to collapse any nation, you will collapse with mathematic certainty.
There is only one “side” – its Advance
Contributing to Research at WAOH
 Contributors – Researchers and Universities/Colleges are invited to contribute to the World in our Hands Library.
Send your TEP Charts, Infographics, surveys, data tables, and suggestions for placement in the econometrics library to [email protected]. Download our most recent TE Proof Chart Excel template here.
To build any TEP Chart here by yourself, visit our Science of 70% tutorial and start with a basic Excel template. You can also upload a much larger sample pack (click here) with many more examples, allowing you to create your TEP frequency distribution charts based on any survey or combination. WAOH has automated these same calculations here in the library – and then added a commercial API and Interactive Console with many more reports via MEMS – for power users, Government, Finance, and Academic researchers.
APIs, Python, MatPlotLib, various JS Charts, and Jupyter Notebook scripts are available to collaborating researchers. An explanation on how to build TEP Charts is available in End of War Chapter 4 New Proofs and TEPs must include supporting data and citations for all sources.
Contributors’ names are published here in the report pending review and acceptance of research. CSQ Research makes updates as quickly as we can validate them and these surveys become our decision-support and building blocks for creating successful policy thereafter
Active Research
Easy: Social Problems: Trust, Mental Illness, Addiction, Math & Literacy, Education Index, Social Mobility, Imprisonment. Industry Sectors: Energy, Mining, Pharmaceuticals, Healthcare, Transportation, Public Administration, Female/Male % per Industry. Finance & Government Investment: Mid-sized SDG SEED versus Scale-Up and Small Business Investment
Complex: Strong Communities | Non-trade-based Advancing Economy measures | Rental Poverty | Mortgage Poverty | Home Affordability | Nationalism/Culture | Scale-Up vs Greenfield Investment | Middle-Income | Female Inequity | Diversity | SKILL versus WILL (Engineers/Technology Leads/Medical versus Admin and Money professionals (H.R./Legal/M.B.A. Generalist /Administration/Accountants) – ideally in Leadership/Boards/Scientific Societies
We can require a few weeks to consider your submission, respond with comment, and we regret that we cannot accept all submissions nor submissions with errors
Support & Donations
Your personal and corporate donations support fact-finding and new science here at CSQ Research
We will shortly post a proper donation portal but for now, please consider supporting our programs via our ACT thesis portal here…
