Country Management Index – The CMI
About the Country Management Index ( The CMI )
 The Country Management Index (The CMI) is a measure of each management team’s ability to leverage resources of land, people, and commerce. The tool was intended to give the management team of each country some feedback on how to improve their country’s economic performance.
Also see the Social Contract Product – which reports exports lost per country due to social contract.
How to Use the CMI
CMI is an important learning tool when used as an empiracle building block for assumptions about the success of policies. It was first used to select important social policies that consistently improved country wealth. The Renewable Automation Index was looking for a link between automation supports and social policy when it confirmed that a statistically-significant number of countries (5% to 10%) who complied with high-CMI Transition Economics Policy, remained in an Advancing – and not Collapse – Trending despite 72% of all countries exhibiting this Collapse Trend.


Simply put, GDP Export is the Wealth that any country creates for itself over time – this can easily be normalized for population differences.
Area – is the amount of land with which a country can draw resources. We consider Area because a team like the Netherlands – who produce the same GDP Export from a landmass the size of Lake Ontario, as does Canada – deserves much higher marks.
HDI – is the United Nations’ Human Development Index – a measure of education levels, longevity, and similar, also widely acknowledged to be little-considering of gaps between rich and poor.
Per-Capita Export – is one of the most desirable indicators of productivity in any economy and so we weight it as high as possible in the CMI calculations.
2016’s CMI dataset version 1.3 for example multiplies GDP Export (Wealth Creation) / Area multiplied by the United Nation’s HDI (Human Development Index) – a measure of quality of life for the average citizen within a country.
2016’s CMI dataset version 1.4 corrects for the HDI’s shortcomings in measuring Wealth Distribution too by considering “GINI”. High Wealth Distributed Countries score higher in 1.4 as Low-GINI countries are also proven to generate higher Export GDP per capita.
CMI Formula 1.3 (GDP Export / Area) x HDI
CMI Formula 1.4 (GDP Export / Area) x HDI / GINI
How to Measure your Government
The value of the CMI calculation itself is of lesser importance, rather the relative ranking between peer countries is considered the more important measure. Management Teams in the Top 10-out-of-10 Scoring Countries fall into the top fifteen countries out of all 168 countries measured by rank. These countries are considered to have 10/10 management teams, and I think most will agree that our #1, #2, and #3 position Hong Kong, Singapore, and Luxembourg qualify as excellent country management teams. Countries with rankings from 16 to 25 are 90% (or 9/10), from 26 to 40 position are 80% or 8/10. Ranks 41 to 60 are 7/10 or 70%. Ranks 71 to 120 are just 50% efficient, and then we remove one point if imports are higher than exports. In future we may remove two for extended ten-year-plus terms with higher imports.
Formula v1.3 penalizes larger countries that have not capitalized upon their greater resources – and v1.3 also does not reflect the economically important benefits of a low GINI score – see below for more about the importance of Wealth Distribution.
The Netherlands are the size of Lake Ontario yet their GDP Exports (Wealth Creation) are the same as Canada – a country with 100 times the resources and double the Netherland’s population as well. The Dutch also export more than they import; importing more than exporting dilutes wealth even further. This explains Canada’s rank of 4/10 at #100 versus the Netherlands’ #5 and a 10/10 Management Team Ranking.
Norway’s rank at #40 here seems unusual despite its model #1 HDI and #6 GINI rankings. Look to components of the formulae for a fuller explanation. Formula v1.4 of the dataset corrects v1.3’s shortcomings by including Wealth Distribution as a ranking consideration. These measures clarify to management policy-makers where opportunities to improve can be found.
V1.3 | V1.4 (coming soon)
The G8 Countries
| v1.3 Rank | Rating | Country |
| 14 | 10/10 | Germany |
| 24 | 9/10 | Italy |
| 26 | 9/10 | Japan |
| 29 | 8/10 | United Kingdom |
| 30 | 8/10 | France |
| 60 | 6/10 | United States |
| 100 | 4/10 | Canada |
| 112 | 5/10 | Russia |
The G20 Countries
| v1.3 Rank | Rating | Country |
| 10 | 10/10 | South Korea |
| 14 | 10/10 | Germany |
| 24 | 9/10 | Italy |
| 26 | 9/10 | Japan |
| 29 | 7/10 | United Kingdom |
| 30 | 7/10 | France |
| 60 | 6/10 | United States |
| 61 | 5/10 | Turkey |
| 64 | 6/10 | China |
| 70 | 6/10 | Mexico |
| 72 | 6/10 | Saudi Arabia |
| 84 | 5/10 | India |
| 90 | 6/10 | Indonesia |
| 96 | 6/10 | South Africa |
| 100 | 4/10 | Canada |
| 106 | 5/10 | Australia |
| 112 | 5/10 | Russia |
| 113 | 5/10 | Argentina |
| 115 | 4/10 | Brazil |
All Countries
| v1.3
# |
Country | GDP | Export | GDP Export | Area |
| 1 | Hong Kong | 274,027 | 229.6% | 629,139 | 316 |
| 2 | Singapore | 295,744 | 190.5% | 563,451 | 459 |
| 3 | Luxembourg | 60,131 | 203.3% | 122,258 | 811 |
| 4 | Malta | 9,971 | 93.6% | 9,334 | 254 |
| 5 | Netherlands | 853,539 | 82.9% | 707,925 | 41,850 |
| 6 | Belgium | 524,806 | 82.8% | 434,329 | 30,528 |
| 7 | Qatar | 202,450 | 75.6% | 153,093 | 11,586 |
| 8 | Switzerland | 685,434 | 72.2% | 494,541 | 41,284 |
| 9 | Bahrain | 32,898 | 20.0% | 6,580 | 549 |
| 10 | Maldives | 2,836 | 111.3% | 3,157 | 236 |
| 11 | Mauritius | 11,938 | 54.3% | 6,484 | 765 |
| 12 | Kuwait | 175,831 | 71.6% | 125,825 | 17,818 |
| 13 | United Arab Emirates | 599,000 | 95.2% | 569,949 | 83,600 |
| 14 | Germany | 3,730,261 | 50.7% | 90,123 | 357,114 |
| 15 | Barbados | 4,228 | 42.5% | 1,796 | 308 |
| 16 | Trinidad and Tobago | 24,463 | 63.2% | 15,448 | 2,842 |
| 17 | Israel | 291,567 | 32.9% | 95,984 | 20,770 |
| 18 | Denmark | 336,701 | 54.3% | 182,728 | 43,094 |
| 19 | Ireland | 232,077 | 105.3% | 44,377 | 70,273 |
| 20 | Brunei | 16,111 | 76.2% | 12,270 | 3,903 |
| 21 | Austria | 428,322 | 57.4% | 246,028 | 83,871 |
| 22 | Seychelles | 1,445 | 76.3% | 1,103 | 347 |
| 23 | Lebanon | 47,221 | 62.6% | 29,537 | 10,452 |
| 24 | Italy | 2,149,485 | 28.6% | 613,893 | 301,336 |
| 25 | Czech Republic | 208,796 | 77.2% | 161,191 | 78,865 |
| 26 | Japan | 4,898,532 | 14.7% | 721,554 | 377,930 |
| 27 | Slovenia | 47,990 | 74.7% | 35,844 | 20,273 |
| 28 | Antigua and Barbuda | 1,241 | 44.1% | 547 | 316 |
| 29 | United Kingdom | 2,678,455 | 42.9% | 1,150,129 | 242,495 |
| 30 | France | 2,806,432 | 28.3% | 793,659 | 640,679 |
| 31 | Saint Kitts and Nevis | 743 | 34.3% | 254 | 180 |
| 32 | Hungary | 133,424 | 88.8% | 118,427 | 93,028 |
| 33 | Saint Lucia | 1,336 | 46.0% | 614 | 444 |
| 34 | Cyprus | 24,057 | 40.1% | 9,649 | 9,251 |
| 35 | Portugal | 227,324 | 39.3% | 89,247 | 92,090 |
| 36 | Spain | 1,393,040 | 31.6% | 439,643 | 505,992 |
| 37 | Poland | 525,863 | 47.8% | 251,363 | 312,679 |
| 38 | Grenada | 831 | 25.1% | 209 | 260 |
| 39 | Malaysia | 312,434 | 81.7% | 255,196 | 330,803 |
| 40 | Norway | 522,349 | 38.9% | 203,089 | 323,802 |
| 41 | Sweden | 579,680 | 43.8% | 253,842 | 450,295 |
| 42 | Greece | 242,230 | 30.2% | 73,226 | 130,373 |
| 43 | Saint Vincent and the Grenadines | 709 | 27.4% | 194 | 294 |
| 44 | Lithuania | 46,403 | 77.1% | 35,791 | 65,300 |
| 45 | Thailand | 420,167 | 73.6% | 309,117 | 513,120 |
| 46 | Estonia | 24,880 | 86.1% | 21,417 | 45,227 |
| 47 | Croatia | 57,869 | 42.9% | 24,849 | 56,594 |
| 48 | Equatorial Guinea | 18,532 | 88.5% | 16,393 | 28,051 |
| 49 | Azerbaijan | 73,557 | 48.7% | 35,837 | 86,600 |
| 50 | Panama | 40,467 | 71.0% | 28,736 | 75,417 |
| 51 | Jamaica | 14,270 | 30.4% | 4,342 | 10,991 |
| 52 | Vietnam | 171,222 | 83.9% | 143,621 | 331,212 |
| 53 | Romania | 192,094 | 42.0% | 80,641 | 238,391 |
| 54 | Finland | 267,329 | 38.2% | 102,066 | 338,424 |
| 55 | Bulgaria | 54,481 | 68.4% | 37,260 | 109,884 |
| 56 | Costa Rica | 49,621 | 35.1% | 17,437 | 51,100 |
| 57 | Dominica | 498 | 32.8% | 163 | 468 |
| 58 | Latvia | 30,886 | 58.8% | 18,173 | 64,559 |
| 59 | Dominican Republic | 60,612 | 25.5% | 15,468 | 48,671 |
| 60 | United States | 16,768,050 | 55.7% | 9,344,834 | 9,526,468 |
| 61 | Turkey | 822,149 | 25.7% | 210,881 | 783,562 |
| 62 | El Salvador | 24,259 | 26.4% | 6,402 | 21,041 |
| 63 | New Zealand | 189,025 | 29.7% | 56,046 | 270,467 |
| 64 | China | 9,181,204 | 26.4% | 2,423,838 | 9,572,900 |
| 65 | Sri Lanka | 67,203 | 22.5% | 15,101 | 65,610 |
| 66 | Philippines | 272,067 | 27.9% | 75,934 | 300,000 |
| 67 | Belarus | 71,710 | 61.2% | 43,872 | 207,600 |
| 68 | Macedonia | 10,767 | 53.9% | 5,802 | 25,713 |
| 69 | Serbia | 45,520 | 40.8% | 18,549 | 88,361 |
| 70 | Mexico | 1,259,201 | 31.8% | 399,796 | 1,964,375 |
| 71 | Samoa | 691 | 30.6% | 212 | 964 |
| 72 | Saudi Arabia | 748,450 | 51.8% | 387,622 | 2,149,690 |
| 73 | Oman | 79,656 | 62.7% | 49,904 | 309,500 |
| 74 | Tonga | 440 | 17.8% | 78 | 464 |
| 75 | Jordan | 33,594 | 42.5% | 14,267 | 89,342 |
| 76 | Cuba | 78,694 | 20.0% | 15,707 | 108,889 |
| 77 | Bangladesh | 153,505 | 19.5% | 29,995 | 147,570 |
| 78 | Albania | 12,904 | 35.1% | 4,523 | 28,748 |
| 79 | Ukraine | 188,350 | 46.9% | 88,280 | 603,500 |
| 80 | Montenegro | 4,417 | 41.8% | 1,845 | 13,812 |
| 81 | Chile | 277,043 | 32.6% | 90,205 | 756,102 |
| 82 | Tunisia | 46,883 | 47.0% | 22,030 | 163,610 |
| 83 | Fiji | 4,034 | 58.8% | 2,372 | 18,272 |
| 84 | India | 1,937,797 | 24.8% | 480,961 | 3,166,414 |
| 85 | Bosnia and Herzegovina | 17,852 | 32.0% | 5,705 | 51,209 |
| 86 | Venezuela | 371,339 | 26.2% | 97,179 | 916,445 |
| 87 | Guatemala | 53,797 | 23.7% | 12,728 | 103,000 |
| 88 | Georgia | 16,127 | 44.7% | 7,207 | 69,700 |
| 89 | Iceland | 15,330 | 55.7% | 8,543 | 100,210 |
| 90 | Indonesia | 868,346 | 23.7% | 206,145 | 1,904,569 |
| 91 | Iran | 492,783 | 32.2% | 158,578 | 1,648,195 |
| 92 | Ecuador | 94,473 | 29.2% | 27,567 | 276,841 |
| 93 | Moldova | 7,970 | 44.1% | 3,516 | 33,846 |
| 94 | Armenia | 10,431 | 27.0% | 2,815 | 29,843 |
| 95 | Comoros | 622 | 16.4% | 102 | 751 |
| 96 | South Africa | 366,060 | 31.1% | 113,991 | 1,221,037 |
| 97 | Swaziland | 3,523 | 55.3% | 1,948 | 17,364 |
| 98 | Uruguay | 55,708 | 24.0% | 13,370 | 181,034 |
| 99 | Nigeria | 514,965 | 18.0% | 92,900 | 923,768 |
| 100 | Canada | 1,838,964 | 30.1% | 553,160 | 9,984,670 |
| 101 | Honduras | 18,569 | 47.9% | 8,900 | 111,369 |
| 102 | Ghana | 47,830 | 42.2% | 20,165 | 238,533 |
| 103 | Morocco | 103,836 | 33.7% | 34,941 | 446,550 |
| 104 | Turkmenistan | 41,851 | 73.3% | 30,660 | 488,100 |
| 105 | Colombia | 378,148 | 17.8% | 67,424 | 1,141,748 |
| 106 | Australia | 1,531,282 | 19.9% | 304,419 | 7,692,024 |
| 107 | Cambodia | 15,250 | 65.7% | 10,022 | 181,035 |
| 108 | Belize | 1,624 | 60.9% | 988 | 22,966 |
| 109 | Egypt | 255,199 | 17.6% | 44,966 | 1,002,450 |
| 110 | Angola | 121,692 | 55.8% | 67,880 | 1,246,700 |
| 111 | Peru | 200,269 | 23.7% | 47,544 | 1,285,216 |
| 112 | Russia | 2,096,774 | 28.4% | 594,855 | 17,098,242 |
| 113 | Argentina | 611,726 | 14.3% | 87,293 | 2,780,400 |
| 114 | Gabon | 16,970 | 58.7% | 9,965 | 267,668 |
| 115 | Brazil | 2,243,854 | 12.6% | 281,604 | 8,515,767 |
| 116 | Paraguay | 29,208 | 49.4% | 14,423 | 406,752 |
| 117 | Kazakhstan | 224,415 | 38.3% | 85,839 | 2,724,900 |
| 118 | Haiti | 7,691 | 18.2% | 1,403 | 27,750 |
| 119 | Uzbekistan | 57,210 | 27.7% | 15,824 | 447,400 |
| 120 | Nicaragua | 11,256 | 40.5% | 4,561 | 120,538 |
| 121 | Libya | 74,597 | 67.4% | 50,263 | 1,759,540 |
| 122 | Rwanda | 7,601 | 14.4% | 1,095 | 26,338 |
| 123 | Algeria | 208,764 | 33.1% | 69,184 | 2,381,741 |
| 124 | Kiribati | 175 | 10.5% | 18 | 572 |
| 125 | Vanuatu | 800 | 47.8% | 383 | 12,189 |
| 126 | Pakistan | 225,419 | 13.2% | 29,800 | 881,912 |
| 127 | Djibouti | 1,456 | 57.1% | 831 | 23,200 |
| 128 | Lesotho | 2,230 | 45.0% | 1,003 | 30,355 |
| 129 | Togo | 4,158 | 39.4% | 1,639 | 56,785 |
| 130 | Sierra Leone | 4,929 | 53.1% | 2,617 | 71,740 |
| 131 | Suriname | 5,299 | 58.7% | 3,108 | 163,820 |
| 132 | Uganda | 26,444 | 23.7% | 6,275 | 241,550 |
| 133 | Bhutan | 1,781 | 40.9% | 728 | 38,394 |
| 134 | Kyrgyzstan | 7,226 | 47.2% | 3,409 | 199,951 |
| 135 | Yemen | 34,714 | 30.5% | 10,581 | 527,968 |
| 136 | Solomon Islands | 1,073 | 54.5% | 585 | 28,896 |
| 137 | Senegal | 15,152 | 26.2% | 3,970 | 196,722 |
| 138 | Laos | 10,760 | 37.2% | 4,005 | 236,800 |
| 139 | Botswana | 14,778 | 55.1% | 8,146 | 582,000 |
| 140 | Kenya | 54,443 | 17.7% | 9,653 | 580,367 |
| 141 | Malawi | 5,146 | 46.3% | 2,384 | 117,600 |
| 142 | Papua New Guinea | 15,420 | 51.0% | 7,864 | 462,840 |
| 143 | Bolivia | 30,601 | 44.2% | 13,520 | 1,098,581 |
| 144 | Guyana | 2,990 | 84.6% | 2,530 | 214,969 |
| 145 | Nepal | 18,179 | 10.7% | 1,945 | 147,181 |
| 146 | Zambia | 22,384 | 41.9% | 9,374 | 752,612 |
| 147 | Tajikistan | 8,506 | 19.2% | 1,631 | 143,100 |
| 148 | Cameroon | 29,568 | 20.7% | 6,109 | 475,442 |
| 149 | Benin | 8,307 | 18.3% | 1,518 | 112,492 |
| 150 | Tanzania | 44,698 | 24.7% | 11,049 | 945,087 |
| 151 | Zimbabwe | 13,490 | 29.5% | 3,978 | 390,757 |
| 152 | Burkina Faso | 12,547 | 27.5% | 3,449 | 272,967 |
| 153 | Namibia | 12,580 | 43.0% | 5,411 | 825,615 |
| 154 | Guinea | 7,219 | 28.5% | 2,055 | 245,857 |
| 155 | Madagascar | 10,612 | 30.1% | 3,191 | 587,041 |
| 156 | Burundi | 2,549 | 7.4% | 189 | 27,834 |
| 157 | Liberia | 1,946 | 32.4% | 630 | 110,879 |
| 158 | Mongolia | 11,516 | 45.1% | 5,198 | 1,564,110 |
| 159 | Eritrea | 3,438 | 19.5% | 671 | 112,622 |
| 160 | Ethiopia | 46,017 | 12.5% | 5,748 | 1,104,300 |
| 161 | Mauritania | 5,516 | 66.7% | 3,680 | 1,030,700 |
| 162 | Sudan | 54,595 | 9.6% | 5,230 | 1,886,068 |
| 163 | Mali | 10,943 | 31.3% | 3,421 | 1,240,192 |
| 164 | Chad | 10,640 | 32.2% | 3,423 | 1,284,000 |
| 165 | Afghanistan | 21,618 | 6.3% | 1,358 | 652,230 |
| 166 | Niger | 7,407 | 23.3% | 1,729 | 1,267,000 |
| 167 | Mozambique | 1,105 | 30.2% | 333 | 801,590 |
| 168 | Central African Republic | 1,585 | 11.7% | 185 | 622,984 |
Why is Wealth Distribution (GINI) Important?
Statistics prove that low-GINI score countries, which are those countries with better income equality, empower a greater percentage of their population to create wealth. For example, a Dutch citizen creates 50% more GDP Export (Wealth) than an American; and 200% more than a Canadian. Why? Because they can. They have employment or guaranteed incomes; they have education, healthcare, pensions, all taken care of by their taxes. They own their homes; where only 30% of Americans own homes free and clear. For more on income distribution, click here.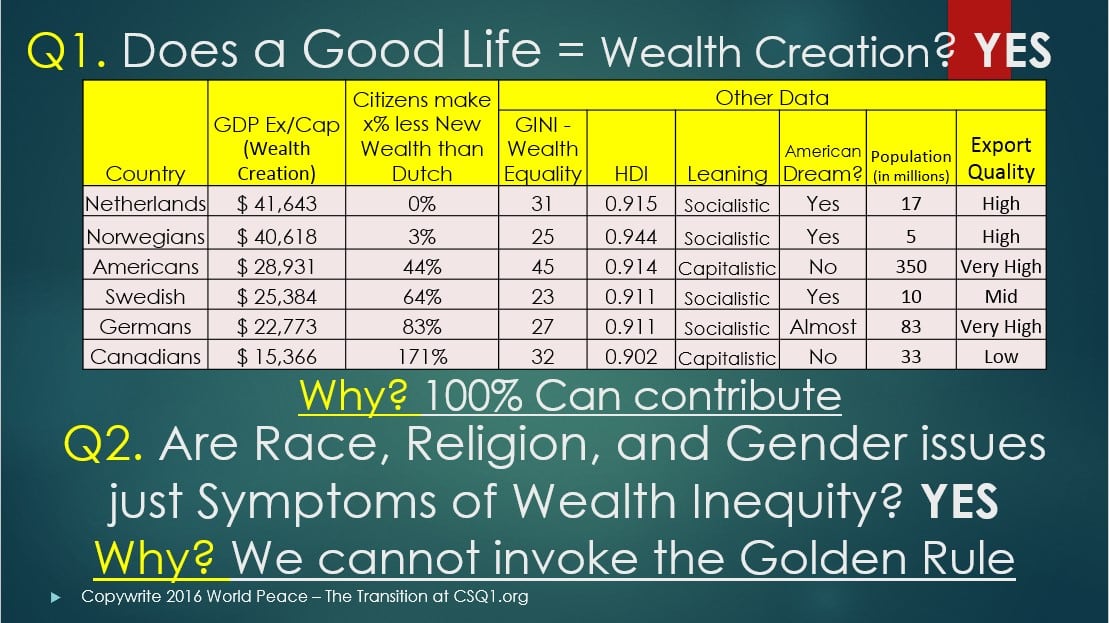
Origins of The CMI
The CMI or Country Management Index was first documented in “World Peace – The Transition” in 2015.
See our forums at Twitter and Google+, read the book, and sample articles at WP Magazine at csq1.org/mag . World Peace is just a Project !Let’s get building again !Share a tweet with your friends:
Worldville is the Global Automated Society. One automation project per country https://t.co/laOTezYHZL #wpprojects pic.twitter.com/Gx3jivi1h8
— Edward Tilley (@TilleyEdward) December 29, 2015