- This topic has 0 replies, 1 voice, and was last updated 7 years, 3 months ago by
etilley.
-
AuthorPosts
-
January 25, 2017 at 5:20 pm #5847
etilley
Keymaster
The Business Case for Guaranteed Incomes
 See a background introduction in this article’s parent – The Business Case for Empathy and also Support for the 49%. The Business Case for Guaranteed Incomes is an excerpt from Transition Economics – the Science of Sustainability, by Edward Tilley.
————-
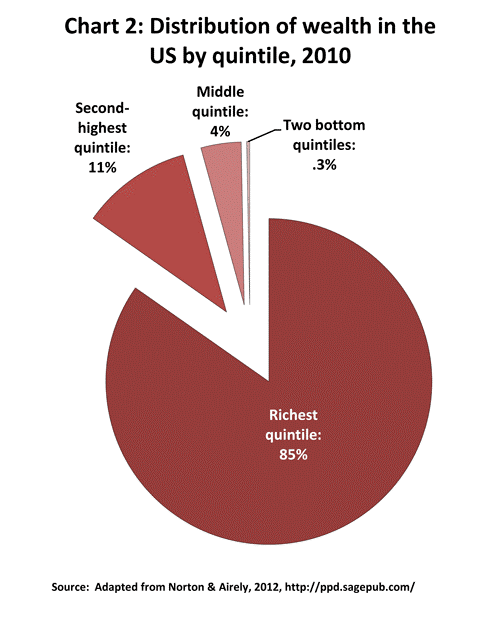
Thinking that the Inequity created naturally by unsustainable capitalistic policy – is somehow preferable or unavoidable – is a Logic Gap. Rich people make $3 million dollars a day for 30 years; so any notion that working harder at three jobs is going to catch you up somehow is not a reasonable expectation.
To determine if Guaranteed Incomes are an affordable option to protect us against inequity and automation job losses, let’s look at the Business Case.
Spoiler alert – we cannot afford to not provide Guaranteed Working incomes.
 The stats that I found within GDP (Gross Domestic Production) Reports globally, support that Inequity costs the United States as much as $8 trillion in Exports annually.
These Opportunity Costs are the revenues lost by 160 million U.S. citizens that are unable to contribute to the production of exports (wealth) and other economic spending.
The actual costs of inequity might be much higher than this as well – if I was to add tax evasion losses, incarceration spending (the US has five-times the prisoners that the next G7 has), Military Spending, and the cumulative costs of Terrorism and Policing. I can also add the lost revenue created by the renewable automations that 160 million people cannot create as well.
Eight Trillion dollars annually – is a high price to pay to protect inequity.
Universal Healthcare in the U.S. would cost around $1.7 trillion; Universal DayCare $600 million; Housing Bubble Controls – no cost; Guaranteed Incomes $233 billion. All of these costs are Chump-change when compared to the Opportunity Costs recovered.
$8 trillion dollars is the payback for having a little Empathy at the polls and voting to afford a minimum reverse-tax or guaranteed working income.
And this is as true in the U.S., as it is in the U.K., Canada, Australia and others. Let’s take a closer look.
The Data
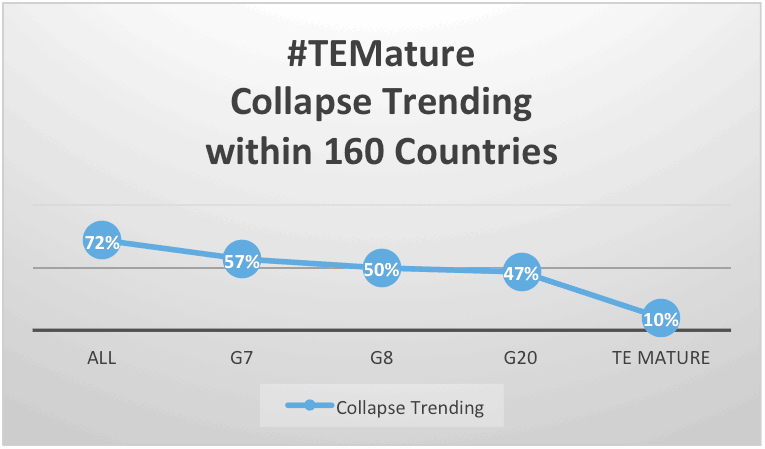
According to a Transition Economics Maturity Model (TE-Mature) study, 72% of all 160 countries measured are in a Collapse Trending today. Of the countries that exercised TE-Mature Policy, just 5% to 10% are in a Collapse Trending globally.
Here are two charts that summarize Export Revenues for a handful of example countries:

GINI – is a statistic that measures country-wide wealth distribution pretty well; each country’s GINI score can be found here.
HDI – is the U.N.’s less-than-perfect Human Development Index; I say less-than-perfect because 45% of Hong Kong’s residents live in 8×8 apartments without a window – and still the country gets a very-high HDI scoring. Wealth Distribution is considered little in this calculation.
Export Quality – on this chart, is an assessment of GDP Export quality; high-profit specialty-goods are higher quality than raw resources. The diversity of exports and the per-unit profitability are important measures. For example, selling your mining resources at pennies a tonne, are low-quality exports that put a your country at much risk of commodity market fluctuation; far better to sell and ship manufactured pharmaceuticals, or engineered tunnelling and automation equipment, at $1000 per box.
Compare the Exports-per-Capita of your Country to understand how much export that your country is failing to earn every year when it fails to engage every citizen in creating export commerce (aka New Wealth).

Opportunity Cost – is a term used to explain the export incomes that are not realized. In the chart above, Opportunity Cost describes the export revenues lost because citizens are not generating as much Export per-Capita as Dutch Citizens.
Exports & Export Per Capita – taken from Wikipedia – https://en.wikipedia.org/wiki/List_of_countries_by_exports_per_capita
The Policies that enable the success of The Netherlands’ Exports, are some of the strongest economic controls in the world. The Dutch Government’s controls protect spending power, local employment & engineering, housing, and foreign investment and business ownership. The Dutch have an open-market with a laser focus on Export (Wealth)-per-Capita creation.
In the Netherlands, education at all levels is free, daycare, healthcare, guaranteed incomes and even retirements are all paid for through a graduated tax structure that permits all citizens to participate in businesses and other commercial work.
Taxes are “higher” here than in G7 countries presently, but these differences can be considered tax-equivalent and revenue-neutral in that they cover needed healthcare, retirements, and other costs of living that G7 countries call “personal spending” and not “taxes”. An apples-to-apples comparison of Cost of Living shows that they pay a total lower Cost of Living than other nations with a higher quality of life as well.
Collapse or Advance “Trending” – is a Transition Economics Term that measures a country’s trade balance and debt; see Transition Economics Maturity Index for that explanation.
The Affirmation – Social Collapse is a Bad Thing
 What does Social Collapse from a lack of responsible government controls look like?
 - Inequity increases, salaries drop below minimum living wages to slave-wages, and people no longer have spending power with their incomes
- Incomes become scarce as well, job-loss and homelessness increases
- Incarceration rates increase and social problems like divorce rate risk
- Trickle-down is a proven failure due to business ethics failings and a lack of laws that make business accountable
- Reliance on immigration revenue increases
- Revolutions and war are not far behind as society continues to collapse – unless the Economy is Reset by TE-Mature Policies.
Canada, and most of the G20, are in a Collapse Trending, so you may well recognize that this list feels very familiar.
The Export-per-Capita statistics of Holland prove conclusively that citizens do take advantage of their social supports to improve both their own productivity – and the standard of living for their larger community as well.
The last G8 country to support “The American Dream” was Russia when Perestroika ended support for a Good Life for all citizens in 1986. Once that universally sustained Good Life was lost, social problems began in earnest. Russia is experiencing a 3.5% homeless rate in a country where homelessness was illegal and unknown previous to this.
With increasing inequity, Incarceration Rates and Divorce increase; Longevity and Birth Rates decrease, and other stats confirm that social problems appear to be the direct symptoms of economic inequity that also lead to social collapse.
The Business Cases:
There are compelling Business Cases for Incomes, Housing, Energy Poverty, free Higher Education, DayCare, and many other social supports. The key is to find enough social policy supports to permit optimal Export revenues. The #TEMature Policy line in this next chart shows that we sustain a Good Life by maintaining incomes and protected spending-power across every phase of Capitalist cycles, including our current Depression phase today.

The Business Case for Guaranteed Incomes
So – without further adieu, here are the numbers for an ROI calculation for a Guaranteed “Living Wage” Income.
Country America Germany Canada U.K Australia Export Per Capita (in billions) $5,057 $ 18,316 $ 13,286 $ 7,378 $ 10,446 Exports ($bill) $ 1,510 $ 1,309 $ 411 $ 436 $ 188 Export Increase 665% 184% 253% 456% 322% Annual_Opportunity Cost ($billions) $ 8,538 $ 1,096 $ 630 $ 1,553 $ 418 Cost of Living (Income per Month) $ 2,500 $ 3,000 $ 3,000 $ 3,500 $ 3,000 Population (million) 324 82 36 65 24.2 Labor force (million) 155.4 44.2 19 30.8 12.4 Unemployment 5.0% 4.5% 6.8% 5.0% 6.8% Current Benefits 15% 14% Total Cost ($bill) $ 233 $ 60 $ 40 $ 64.6 $ 30 GDP ($bill) $17,348 $ 3,868 $ 1,785 $ 2,989 $ 1,472 Tax Inc vs GDP 26.9% 40.6% 32.0% 39.0% 25.8% Total Tax Revenues ($bill) $ 4,666 $ 1,570 $ 571 $1,166 $ 379 New Tax ($bill) $ 3,618 $ 1,466 $516 $997 $ 347 Tax Increase -22.45% -6.59% -9.53% -14.45% – 8.5 % Tax Rev New Export (15%) $bill $ 1,280 $ 164 $ 516 $ 233 $ 62 ROI (Return on Investment) 3663% 1801% 1574% 2405% 1374% Return per $ 36-times 18x 15x 24x 13x These calculations indicate that every country tested would benefit by up to 36-times the program’s costs. Why? Because people with these supports are confirmed (in data) to create much more wealth when given the opportunity.
Good Lives are the direct result of sustainable policies and development projects…


Conclusions
Ensure consistent communities with a Guaranteed Working Income – and make sure that these incomes are meaningful by restoring spending power – by eliminating bubbles housing, energy, etc. The economic turn-around that results is pervasive and easily proven statistically – see Transition Economics and TE Maturity.

I found that:
- Citizens who enjoy excellent Wealth Distribution and a Good Life – a Life with free healthcare, education, family-friendly communities and good security – Citizen-for-Citizen, did create more Wealth for their country. Therefore, TE-Mature Policies like free University, Healthcare, and so on. See TE-Mature Policies here…
- Thirty-eight-million to fifty-million citizens living in Countries with TE-Mature Policy and good Wealth Equality often report reduced incidents of race, religion and gender concern (recent E.U. immigration mistakes introduce a logic-gap or two so read more about Immigration Policy here).
- There was an exactly reverse relationship between both GINI (Wealth Distribution) and Export per Capita with Incarceration Rate where more Inequity resulted in more Incarceration and shorter lifespans as well.
- Wealth Distribution – Incomes with Spending Power – is the underlying Problem – and the Symptoms of that problem include Race, Gender, Terror and Religion “Crisis” in the News.
Why did it take G7 countries like Germany and Italy longer to adopt stronger Business Case Socialistic Policies? Because they studied smaller population & GDP countries, saw the impact of unsustainable Policy quickly and relied on facts and values to make good choices. Larger economies took much longer to feel the impacts of unsustainable policy – and then frankly, they could hide social problems more easily too.
If you are arguing against empathy, no matter the context, you are arguing on the wrong side.
What did you find?
Author: Edward Tilley
Read more about understanding solutions important to all of our futures in “Transition Economics” and “World Peace – The Transition“.


-
AuthorPosts


- You must be logged in to reply to this topic.